九米波段

vip
Age 4.7 Yıl
Peak Tier 1
No content yet
Pin
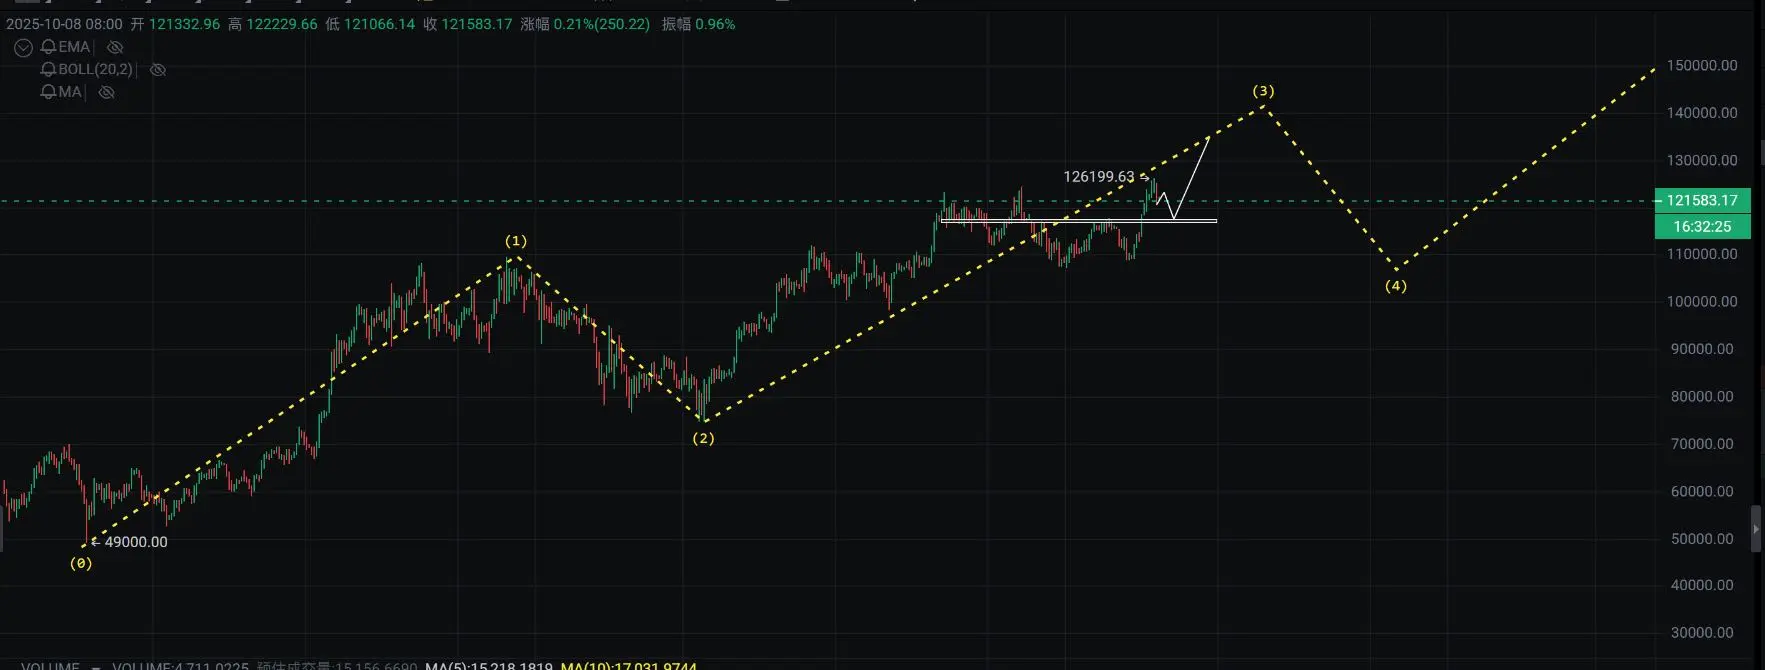
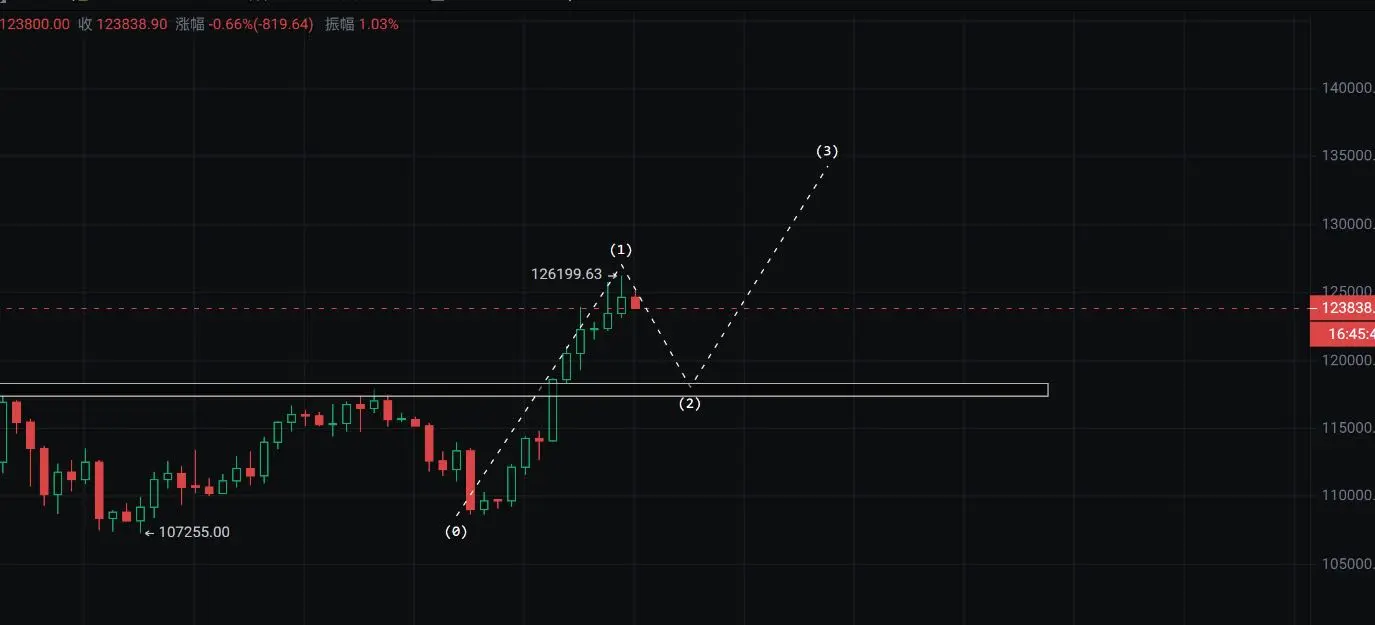
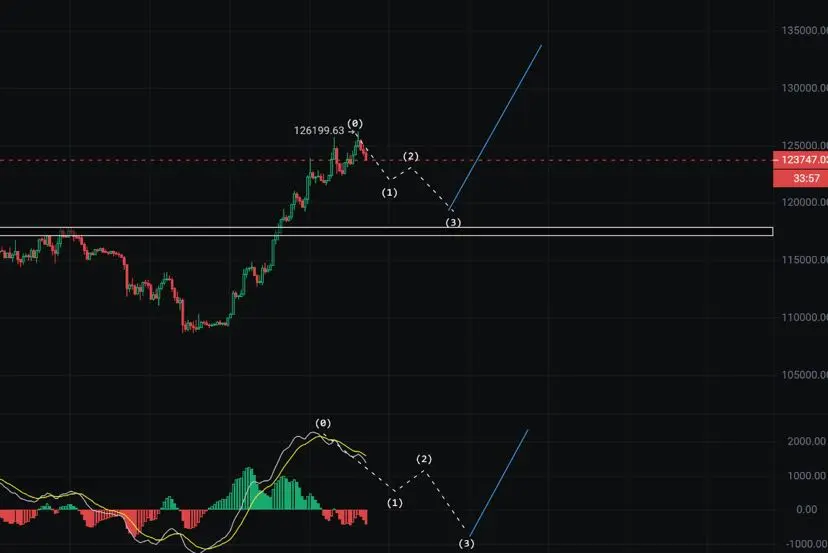
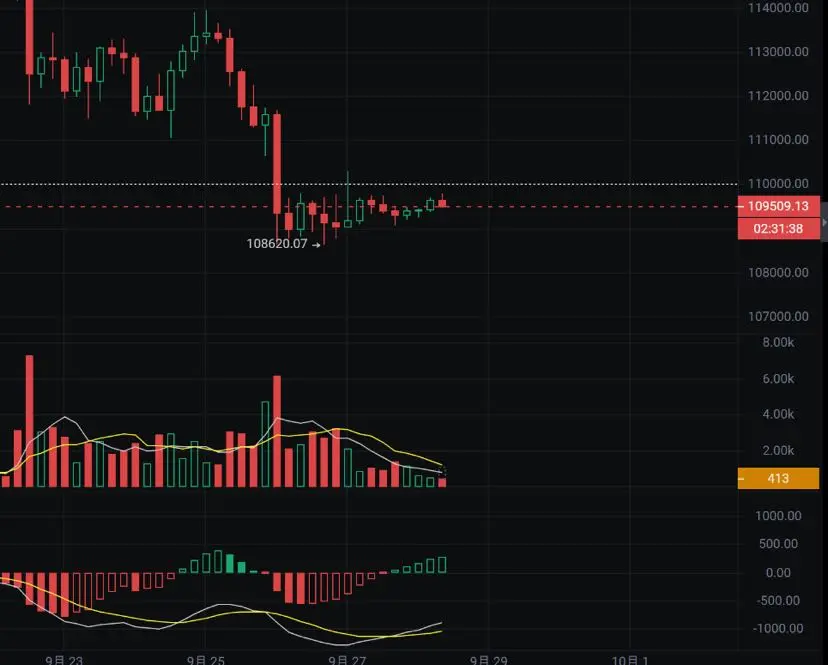
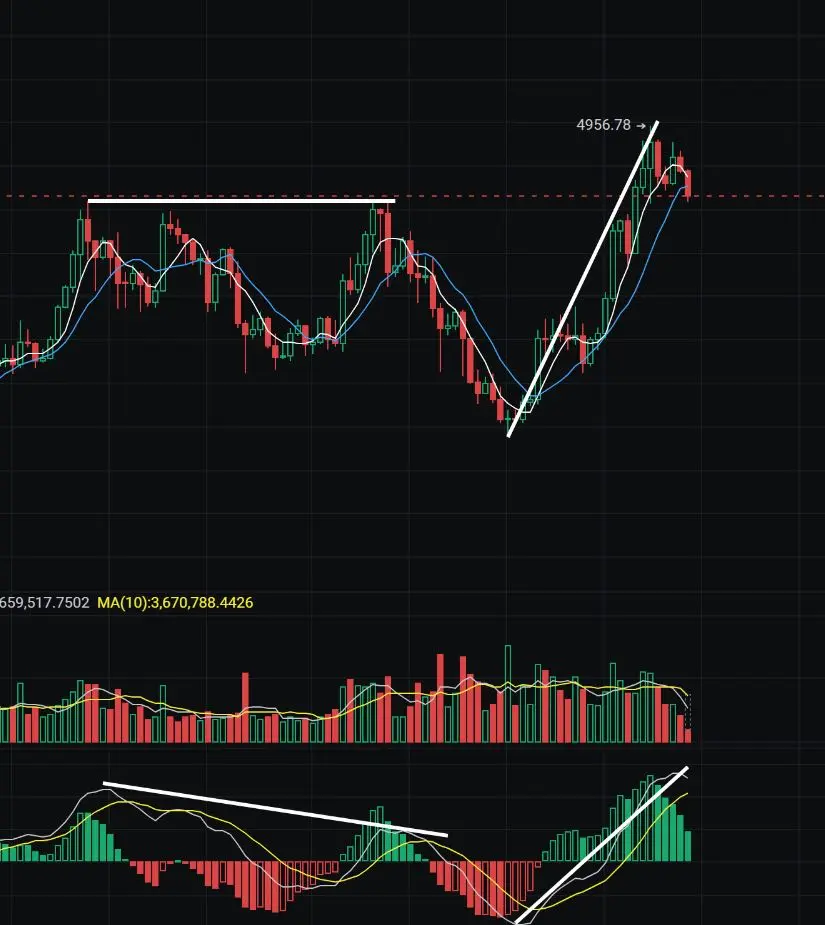
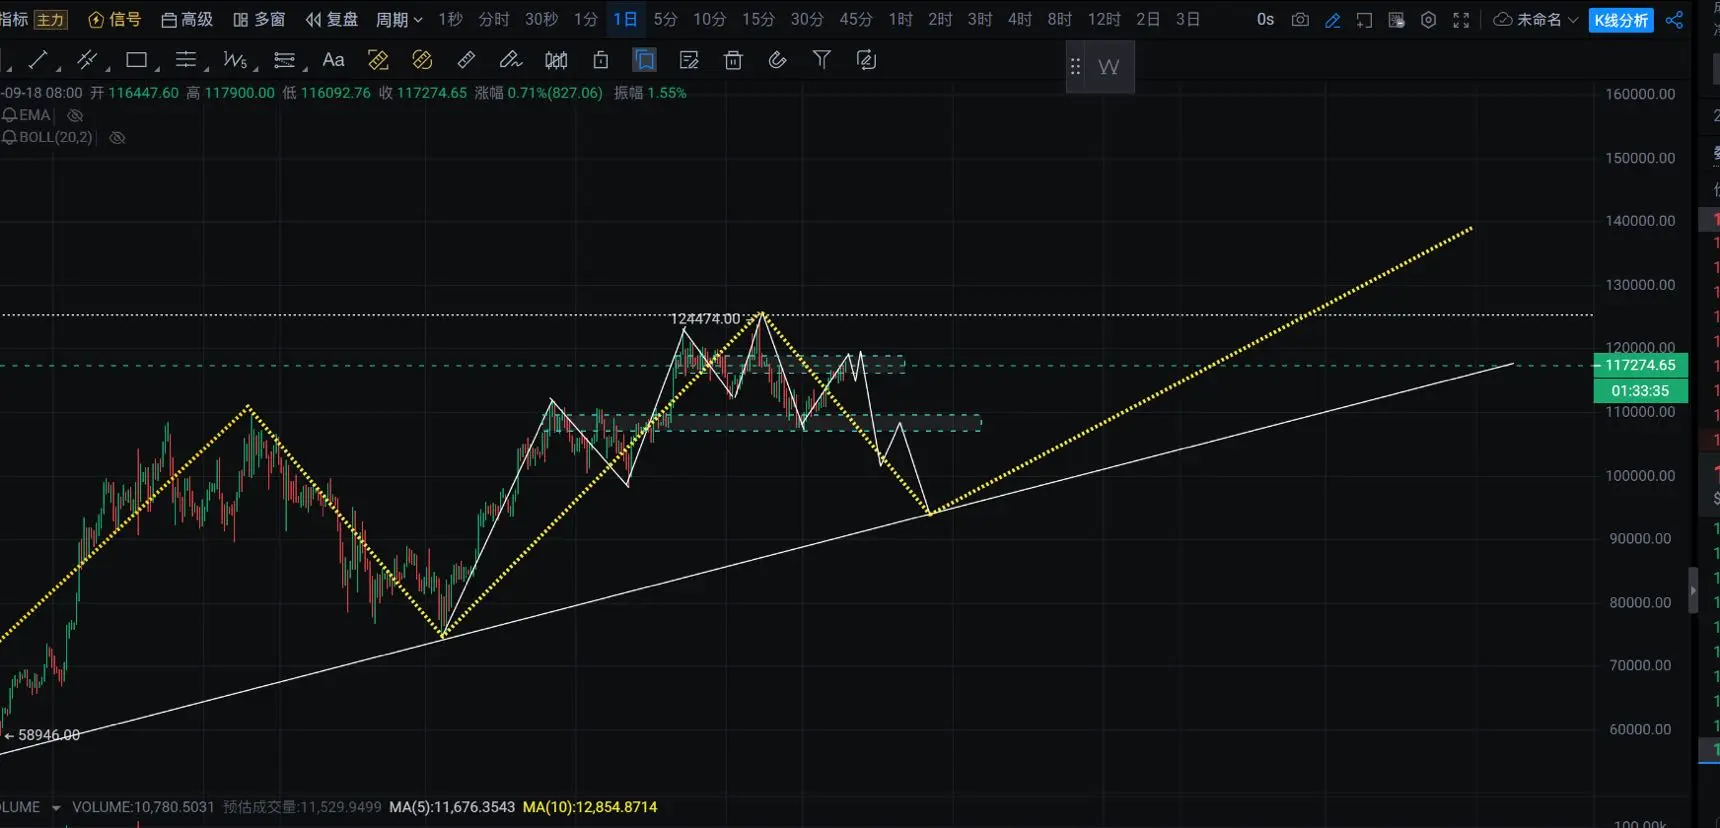
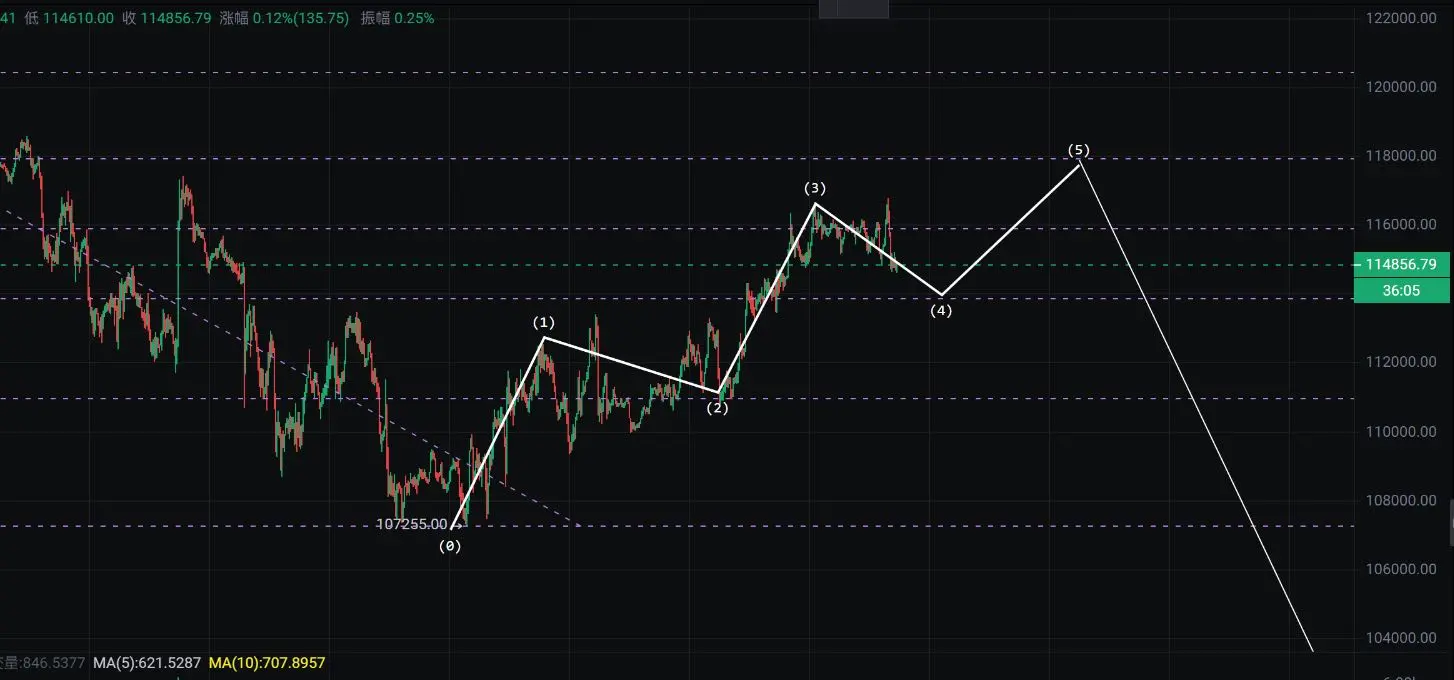
Short-term players in contracts should be the majority, right? If everyone can find a very good point in a small swing trading, you can follow my overall trend. The K-line forms minute by minute, hour by hour, and day by day. If you can't hold on, just reduce position and push for breakeven.
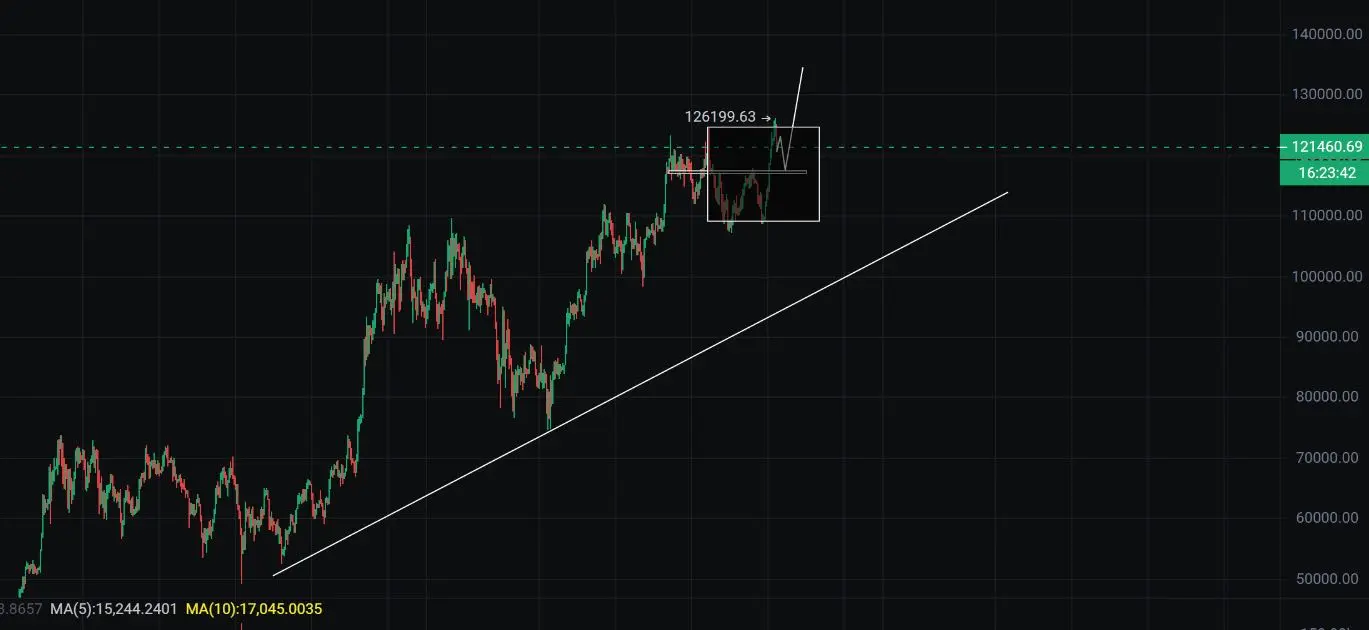
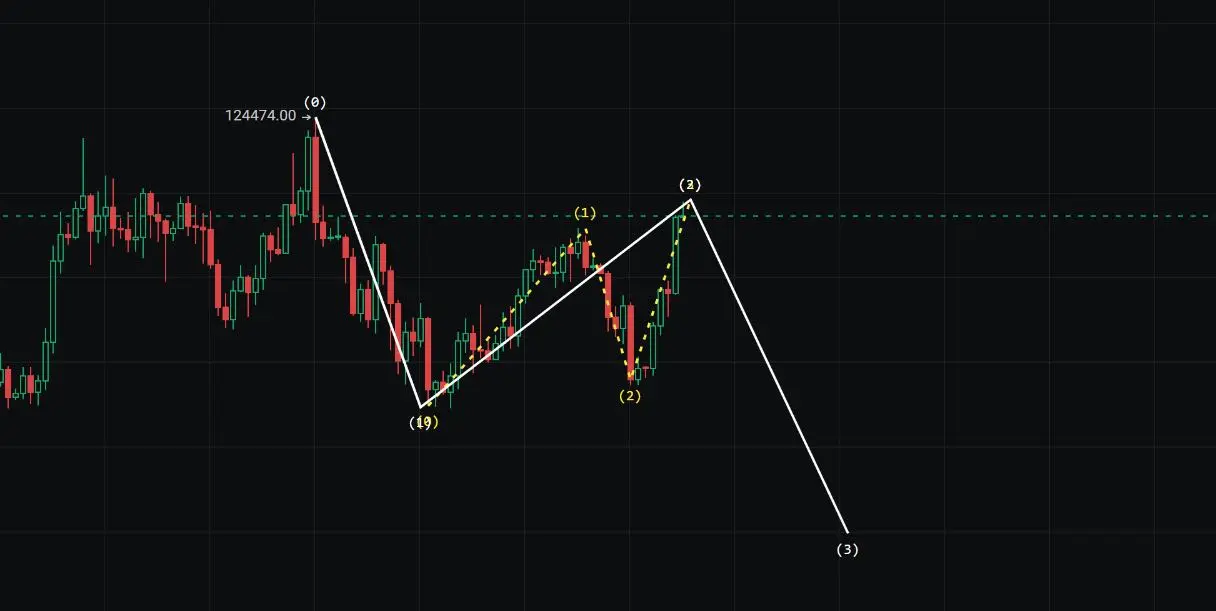
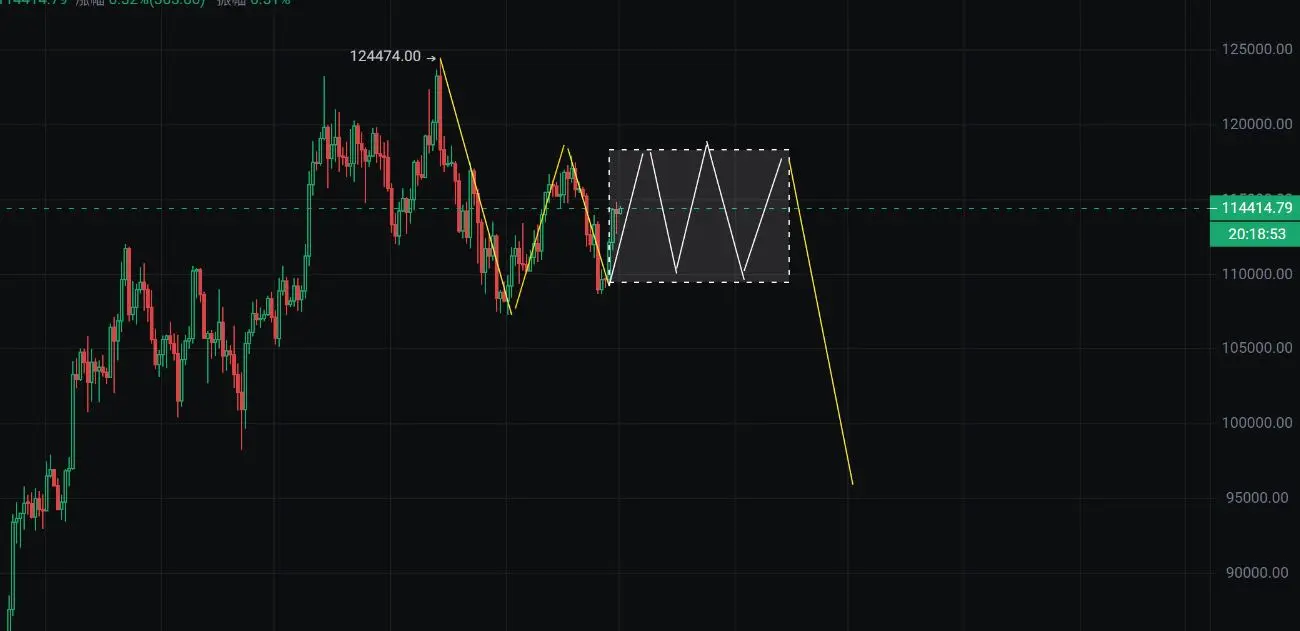
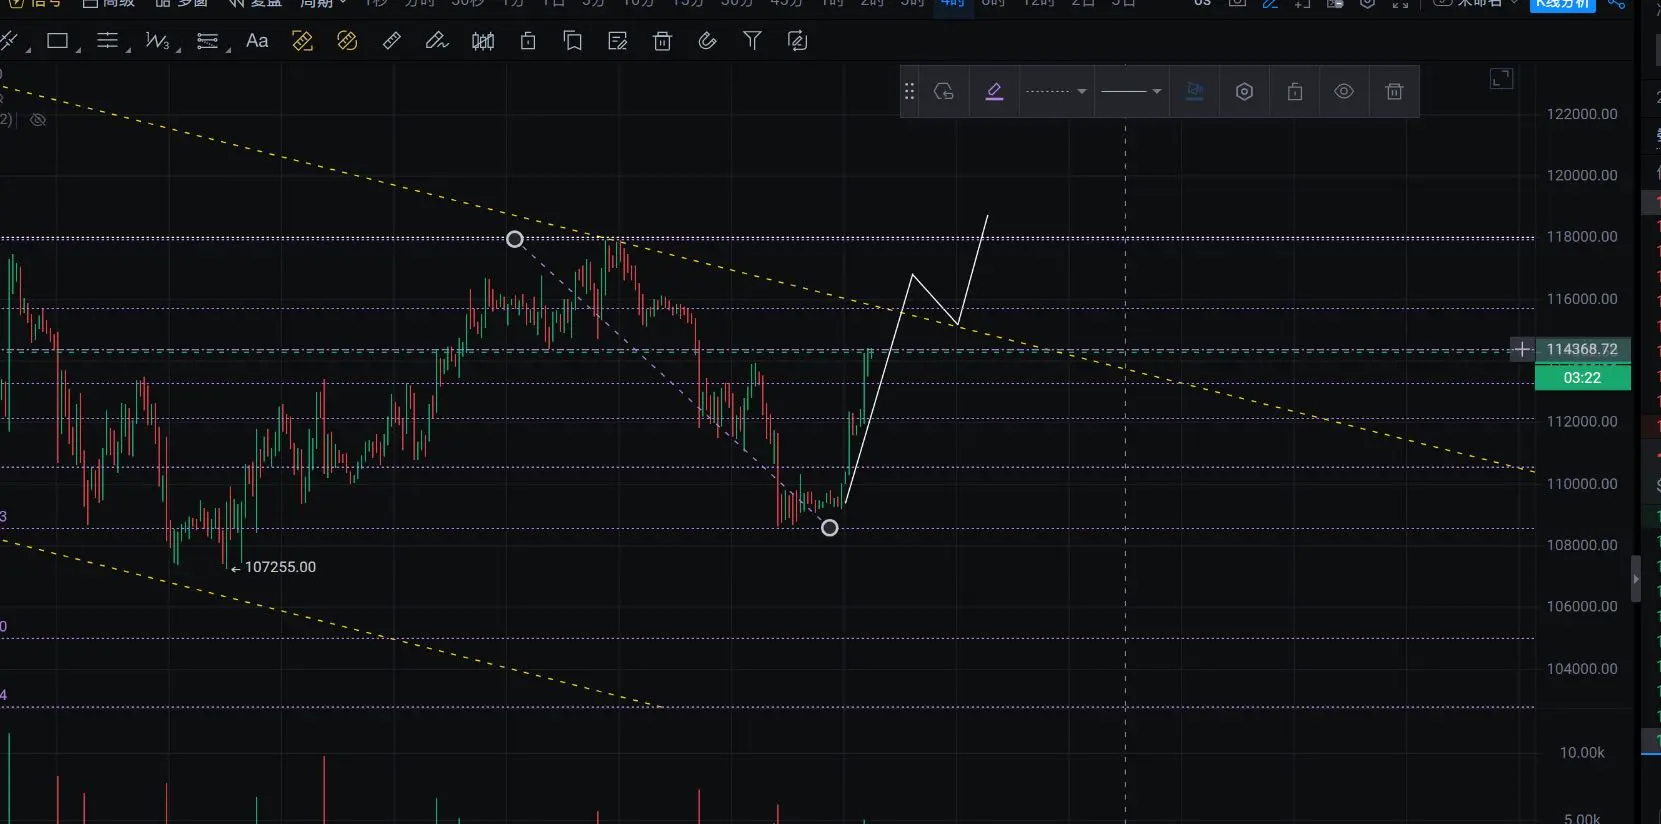
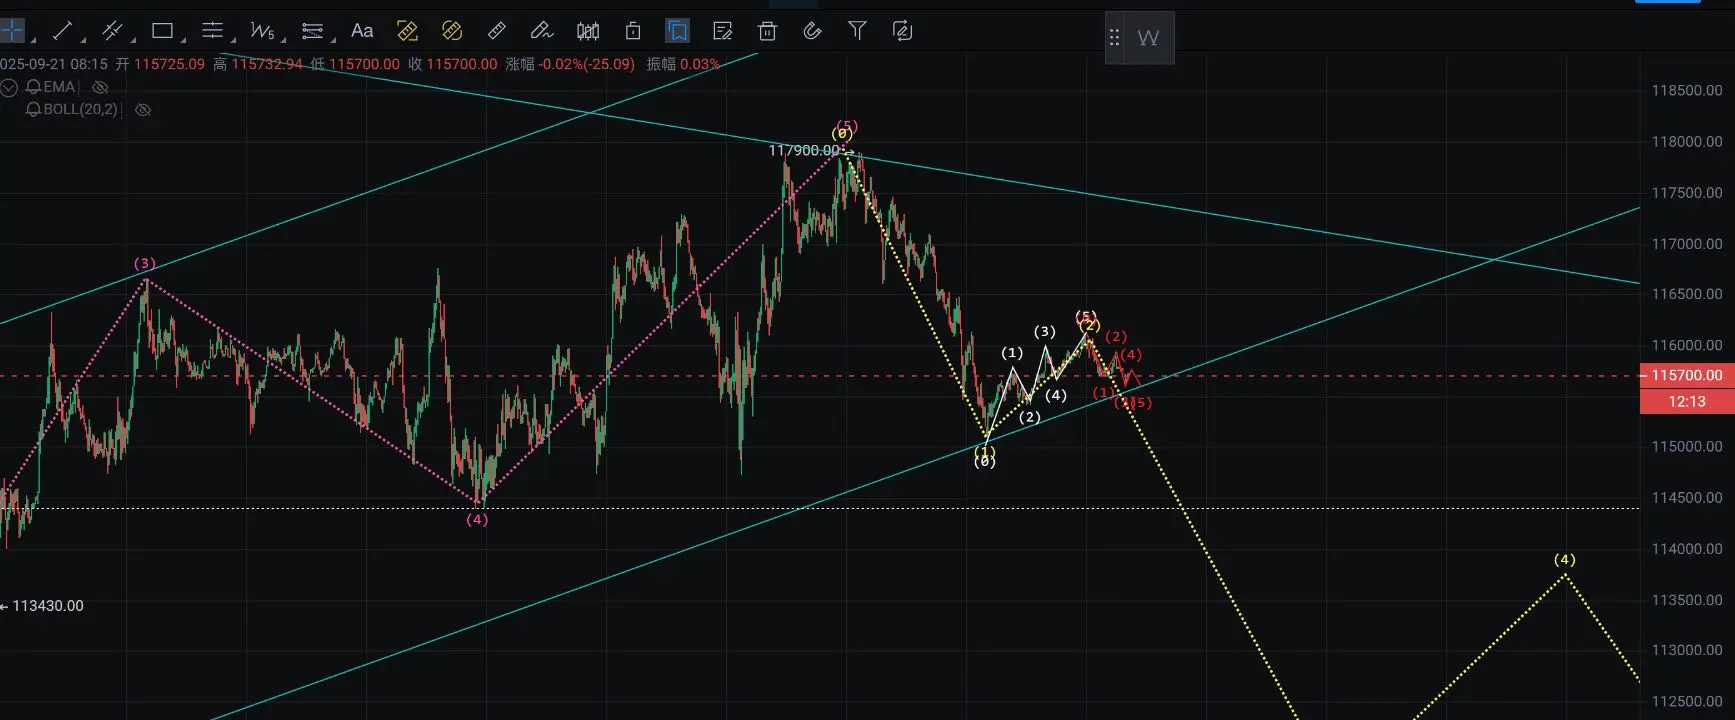
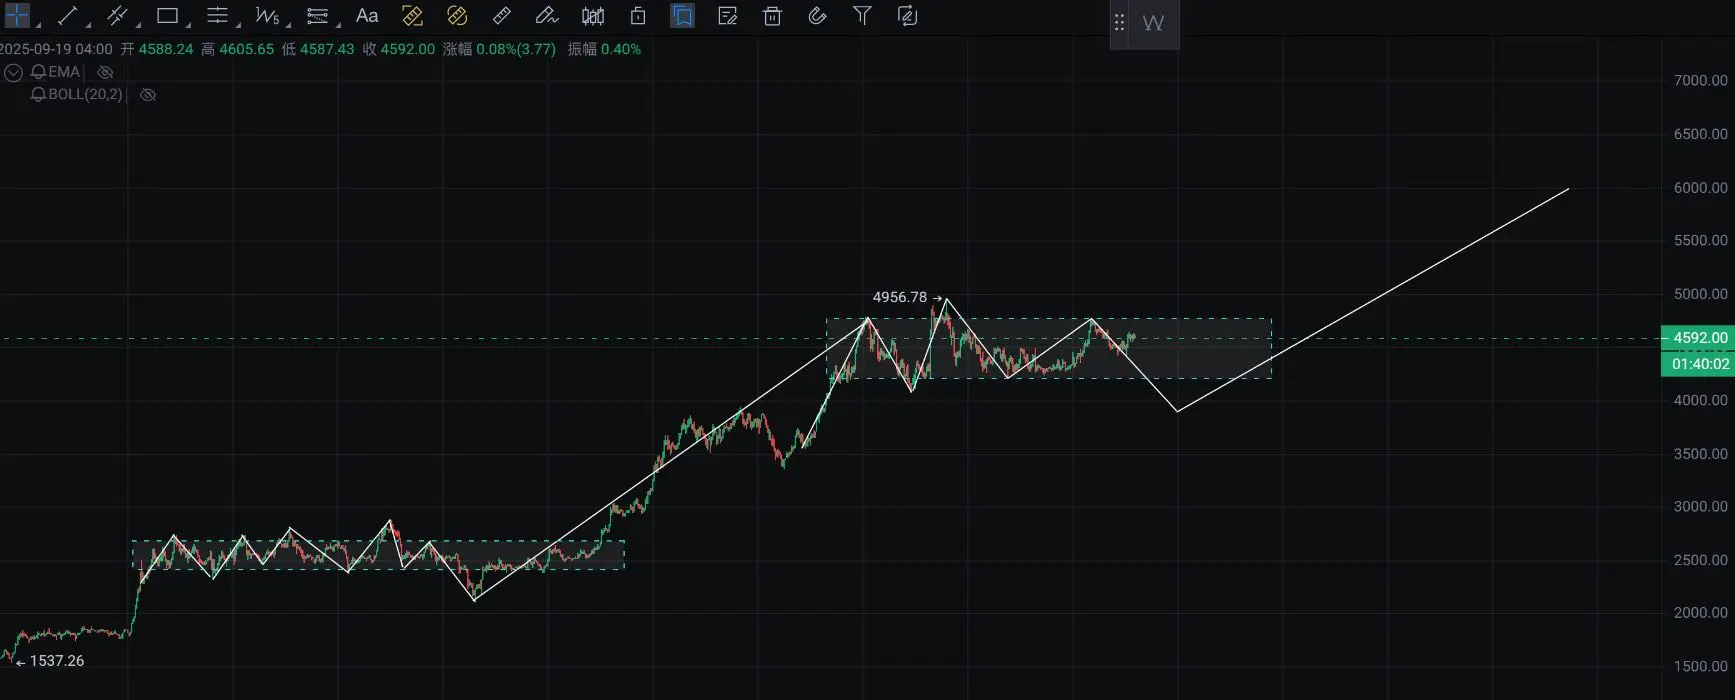
Treat contracts as investments and be clear about what level of trading you are engaged in. Don't think about the patterns with 5-minute K-lines; you can hold positions appropriately with significant tops and bottoms at the four-hour level.
Don't let contracts take over your life, and don't let contracts a
View Original
[The user has shared his/her trading data. Go to the App to view more.]
  • Reward
  • 1
  • Repost
  • Share
MayFortuneAndLuckCome.vip:
It makes sense.
In terms of the overall trend, from August 6, 2024, to January 20, 2025, it is the first weekly level pump, taking 171 days, with an increase of around 61,000. From April 9, 2025, to August 14, 2025, it was originally thought to be the third weekly level pump, taking 128 days, with an increase of 50,000. Previously, there was discussion about how this one is shorter than the first one, but it seems that it is not yet completed. While it is not completed, we need to see if the third one can reach the longest (requiring a supplementary rise of more than 15,000 points, which would be around 140,0
ETH2,16%
BTC1,07%
View Original
post-image
post-image
post-image
  • Reward
  • 1
  • Repost
  • Share
Happy National Day, continue with daily updates.
#BTC行情分析
To put it directly, first of all, this month, the deepest pullback is estimated to be around 118,000. As for whether it will fall below 100,000, that is not something to consider this month.
As mentioned above, if the third wave of the weekly chart has not yet ended, we can expect it to be around 13.5-14.5. Here, it is important to emphasize that the daily upward trend has not yet finished; this month is likely to pull the price up significantly before coming back to fill the gap, referring to the rally in October and November of last
BTC1,07%
ETH2,16%
View Original
post-image
post-image
post-image
post-image
  • Reward
  • Comment
  • Repost
  • Share
#市场分析与趋势 Yesterday I thought of a very scary question: did I misjudge the strength of the third pump on the weekly chart? All previous data were based on the assumption that the peak of the third pump on the weekly chart was 1124474. The first pump lasted about 168 days and rose by 60,000. So far, the third pump has lasted about 175 days and has risen by 50,000. We previously expected that this pullback would go down to 93500, and then the fifth pump would rise by about 40,000, which means it would challenge 140,000. So if the third pump exceeds 60,000, it would start at 135,000. Of course, a
ETH2,16%
View Original
post-image
post-image
post-image
post-image
  • Reward
  • Comment
  • Repost
  • Share
Starting today, the article will be slightly modified to analyze BTC from larger to smaller timeframes, including the daily chart, four-hour chart, and one-hour chart. The weekly chart fluctuation has been quite long, so it will be briefly mentioned at the end, unless there is a particularly large directional fluctuation.
BTC
Daily chart level: First, let's look at the yellow line. The move from 0 to 1 has fallen into the center of July, which is a very strong decline. The move from 1 to 2 is also a very precise correction that we anticipated. My previous expectation was that the move from
BTC1,07%
ETH2,16%
View Original
post-image
post-image
post-image
post-image
post-image
  • Reward
  • 2
  • Repost
  • Share
JustDoItInReverse.vip:
Just go for it💪
View More
#市场分析与趋势
Yesterday we thought there would be another wave of increase, but we didn't expect it to be this strong. Currently, the position is still at a reasonable rebound level within the normal downtrend (exactly at the 0.618 of this decline, and it meets the following conditions: 1. The rebound time in the downtrend is shorter than the main downtrend duration, 2. The rebound strength is exactly at the Fibonacci level, 3. The one-hour and four-hour charts have absorbed a wave of upward energy, 4. Four days have passed, 5. In the one-hour downtrend, the upward energy is almost depleted, t
BTC1,07%
ETH2,16%
View Original
post-image
post-image
post-image
  • Reward
  • 1
  • Repost
  • Share
Albitapachevip:
Excellent information
#市场分析与趋势
The big trend has been talked about every day, so I won’t elaborate. You can check my previous articles.
On a smaller scale, currently at 112350, it is within a reasonable rebound range, and one can attempt to short on the left side. This left-side shorting must strictly control the stop loss. The reason for shorting on the left side here is that (the rebound has lasted about 3 days, and the strength of the rebound has also been established. Currently, it has encountered the lower edge of the previous range, and indicators like MACD and volume have also reached high points). Of cours
BTC1,07%
View Original
post-image
post-image
  • Reward
  • Comment
  • Repost
  • Share
#行情分析
Today let's talk about Bitcoin and Ethereum together. The bullish volume on the 4-hour chart has emerged, but the price hasn't gone up. From the trading volume perspective, there hasn't been much significant movement from large funds. Looking at the candlestick patterns, there aren't any obvious top or bottom formations. Friends who are looking to go long in the short term should pay attention. Although Ethereum has shown an upward range, its resistance level is actually at 4070, not 4000, which was mentioned yesterday. It is estimated that Sunday will also be passed wit
BTC1,07%
View Original
post-image
post-image
post-image
[The user has shared his/her trading data. Go to the App to view more.]
  • Reward
  • Comment
  • 1
  • Share
#btc In the past two weeks, the fall of BTC has been somewhat too regular, and the effective Rebound only appeared in the second segment, and the strength of the Rebound is not very strong. It is still necessary to pay attention to a strong Rebound, and there is no need to fear high-position short order. The momentum of the three segments of the fall is stronger than the last, indicating that the short positions trend has not yet ended. In terms of time, this drop should have just reached 50%, and it will continue, with a target of 100,000 and a duration of about 7-10 days.
#eth Regarding the
BTC1,07%
ETH2,16%
View Original
post-image
post-image
  • Reward
  • Comment
  • Repost
  • Share
Currently, the BTC daily chart has only shown top and bottom formations on August 14, September 1, and September 14. August 14 is the highest point before the death cross, and the energy bars show divergence, with volume and price also diverging. September 1 is the lowest point before the golden cross, with energy bars slightly diverging and volume and price slightly diverging as well. The situation on September 14 is the same. Additionally, September 14 is at the fibonacci retracement level of 0.618.
This is said to draw the trend. Currently, it is the third leg of a pullback on the daily cha
BTC1,07%
ETH2,16%
View Original
post-image
[The user has shared his/her trading data. Go to the App to view more.]
  • Reward
  • Comment
  • Repost
  • Share
#btc In yesterday's video, it was mentioned that the upward momentum bars of the 4-hour MACD are too few and need to be filled. There are only two types of trends for filling bars: consolidation and Rebound. The Zen Master once said that trends will eventually become perfect. After a nap, BTC has shown a Rebound on the 1-hour level, while Ether is in consolidation. It was also mentioned yesterday that the Rebound position for BTC is around 114, and it hasn't even reached that yet. So today, we need to closely follow whether the 1-hour MACD will diverge. It is most reasonable to find a
BTC1,07%
ETH2,16%
View Original
post-image
  • Reward
  • Comment
  • Repost
  • Share
#eth Note that from March 24 to December 24, in the way of Ether at 4000, the MACD line and energy bars have shown no divergence. One thing that can be confirmed is that 4956 is definitely not the peak of Ether, it might even just be the beginning. Observing the BTC from April 21 will make this clear (do not compare with the Ether from 21, as the patterns are still different). Additionally, with the gradual normalization of virtual coins over the past two years, the upward space for Ether should be infinitely large.
However, during the period from August 18 to September 8, Ether formed a seco
ETH2,16%
BTC1,07%
View Original
post-image
post-image
[The user has shared his/her trading data. Go to the App to view more.]
  • Reward
  • Comment
  • Repost
  • Share
#btc Currently, the third wave of decline at the daily chart level has begun. What needs to be followed now is the strength of the bullish traders' counterattack. A counterattack up to 114500 is considered normal, so don't panic with the short order; try to hold on. Looking back at the bottoming out from August 30 to September 1, this phase was also very torturous. Of course, this is an idealized trend; if there is such a strong counterattack, the next wave of decline is likely to be very significant. A pullback in the range of 114000 to 113500 is reasonable. In short, just don't
BTC1,07%
ETH2,16%
View Original
[The user has shared his/her trading data. Go to the App to view more.]
  • Reward
  • Comment
  • Repost
  • Share
#btc On August 30th, you can close your short orders at lower levels. Before and after the interest rate cuts, you should position your short orders. There's not much to analyze; the market has already moved. If you want to do long term, wait for a Rebound to see how high you can short. As for take profit, those who are cautious can take profits near the previous low, while those who are bold can hold until around 9. I'll update daily, so there's no need to rush to follow the take profit.
If you really want to draw lines, this is roughly the trend (to emphasize again, if you are do
BTC1,07%
ETH2,16%
View Original
[The user has shared his/her trading data. Go to the App to view more.]
  • Reward
  • 1
  • Repost
  • Share
九米波段vip:
I forgot to send the diagram with the lines..
Today's Foreword: I originally planned not to update over the weekend, but this morning, while scrolling through short videos, I came across many celebrity-certified financial bloggers chatting about the market on various platforms, and I felt like sharing my thoughts with everyone. You might often see phrases like "as long as it doesn't fall below xxx, the market will continue to rise," "if it doesn't break through xxx, the market will continue to fall," and "although the general direction is south/north, we still need to guard against it breaking through xx, or the market is abou
BTC1,07%
View Original
post-image
  • Reward
  • Comment
  • Repost
  • Share
#btc The price of BTC has currently reached a high of 117900, while our previous expectation was between 113950 and 117950. Looking back, it has perfectly reached that.
So the current thinking needs to change, BTC could end this rally at any time, MACD shows divergence at various levels, Fibonacci retracement at the 0.618 level, previous dense trading consolidation, including 18 bullish and 18 bearish candles, and a time span of 19 days of price increase.
Now let's review the larger time frame. Here, the significant rise has reached 124474, followed by a sharp decline. This decline was ve
BTC1,07%
ETH2,16%
View Original
post-image
post-image
  • Reward
  • Comment
  • Repost
  • Share
#btc BTC weekly chart, daily chart, 4-hour, 1-hour, have all diverged. It has been almost 20 days since August 30. We have continuously emphasized to short within the 1145-1179 range, which has now been reached. So both the time and the level are in place, and we will have to see tonight's news. Everyone should not panic; as we approach the highs and lows, there will be various smokescreens, so-called teachers, all kinds of news, like Whales buying and selling, wars, how much has been transferred from ancient Wallets, don't believe it all. The news is just a catalyst. The market will
BTC1,07%
ETH2,16%
View Original
post-image
post-image
  • Reward
  • Comment
  • Repost
  • Share
#btc In terms of time, the first daily chart level fall took 16 days, today is the second rebound, which took 16 days. If the 4h level fifth rebound can emerge, it is estimated to be in these two days. Everyone can lay out long term shorts above 116. Whether the fifth at the four-hour level can move like this, or form a top central here, I am more inclined towards a long wick candle upwards followed by a continued daily chart level fall.
#eth Ethereum and Bitcoin, just the strength may vary, and it is also more inclined to have a long wick candle upwards and then continue the daily chart fall
BTC1,07%
ETH2,16%
View Original
post-image
post-image
post-image
  • Reward
  • Comment
  • Repost
  • Share
#btc BTC is already within our target range, but I want a better entry point. A long term order can be entered now; my entry point is 1151. Add more if it goes up, watching for 9.35.
Do not recommend entering a short position on ETH now. If ETH has a fifth rebound, the strength is expected to be considerable. There's no need to hold the order; just wait for a higher short position.
BTC1,07%
ETH2,16%
View Original
post-image
post-image
  • Reward
  • Comment
  • Repost
  • Share
#btc Recently I was urging you to go long, but now the long term short order entry point has arrived, and it’s time to shift to a bullish mindset. The period from September 10th 21:00 to September 12th 10:00 has already diverged, and we are currently in the phase of exploding short orders. The 25% interest rate cut expectation has already been digested, and there is still a maximum of 50% interest rate cut expectation that hasn't been digested yet. For the entry point, refer to my previous article; I’m too lazy to say it every day. Reporting a range was treated like a phone number limit.
BTC1,07%
ETH2,16%
View Original
  • Reward
  • Comment
  • Repost
  • Share
Today's article is very important, please read it carefully.
#btc I have been saying to short between 113950 and 117960 for Bitcoin, and it is now within the target range. So where exactly will it go?
There are two scenarios for this short-term analysis. The first scenario is that the current 114434 is the highest point of the third wave. In this case, the upward movement is not as significant as the first wave, indicating that the strength of the fifth wave will be even smaller, and we can only expect to reach 116. However, I prefer the second scenario as illustrated by the white line, w
BTC1,07%
ETH2,16%
View Original
post-image
post-image
  • Reward
  • Comment
  • Repost
  • Share
  • Pin

Trade Crypto Anywhere Anytime
qrCode
Scan to download Gate App
Community
  • بالعربية
  • Português (Brasil)
  • 简体中文
  • English
  • Español
  • Français (Afrique)
  • Bahasa Indonesia
  • 日本語
  • Português (Portugal)
  • Русский
  • 繁體中文
  • Українська
  • Tiếng Việt