Decred (DCR) is maintaining an impressive breakout momentum, increasing by an additional 5% at the time of writing on Monday, marking its fifth consecutive rally. This upward trend occurs amid bullish efforts to challenge a key resistance zone in the market.
Notably, the limited circulating supply—stemming from continuous user staking and persistent treasury accumulation—is creating significant upward pressure on DCR’s price. From a technical perspective, Decred is at a critical juncture, as increasing buying pressure could determine the next direction of the trend.
Limited Supply Drives DCR Demand
On-chain data shows that 10.9 million DCR are currently staked, accounting for 67.4% of the total mined supply (16.2 million DCR) and locked for 142 days. Additionally, the treasury holds over 873,000 DCR, removing another 5.4% from the circulating supply and reducing actual market liquidity to approximately 4.40 million DCR. This scarcity of supply is significantly boosting demand, attracting increasing investor interest in this privacy-focused coin.
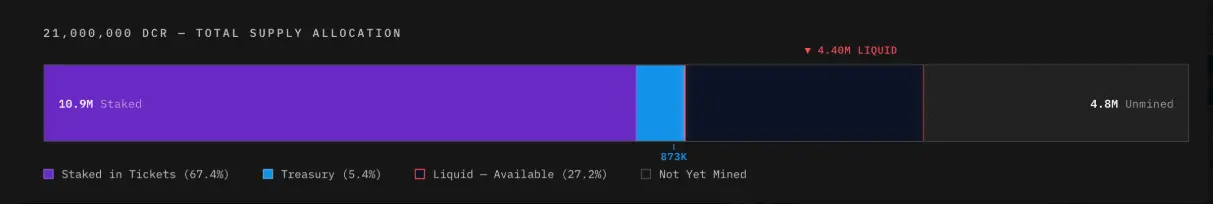 DCR Supply Distribution | Source: Decred.supply## Technical Outlook: Will Decred Continue Its Uptrend?
Decred has gained about 5% at the time of writing on Monday, breaking above the $25.00 level. The short-term recovery is currently challenging the 38.2% Fibonacci retracement at $26.13, calculated from the November 4 high of $70 down to the December 23 low of $14.21. This is a key resistance zone that has repeatedly halted upward attempts since late November, reflecting ongoing significant selling pressure.
If the price can convincingly close above the $26.13 level, the bullish trend may be reinforced, opening the door toward higher Fibonacci retracement levels at $31.54 (50%) and $38.07 (61.8%).
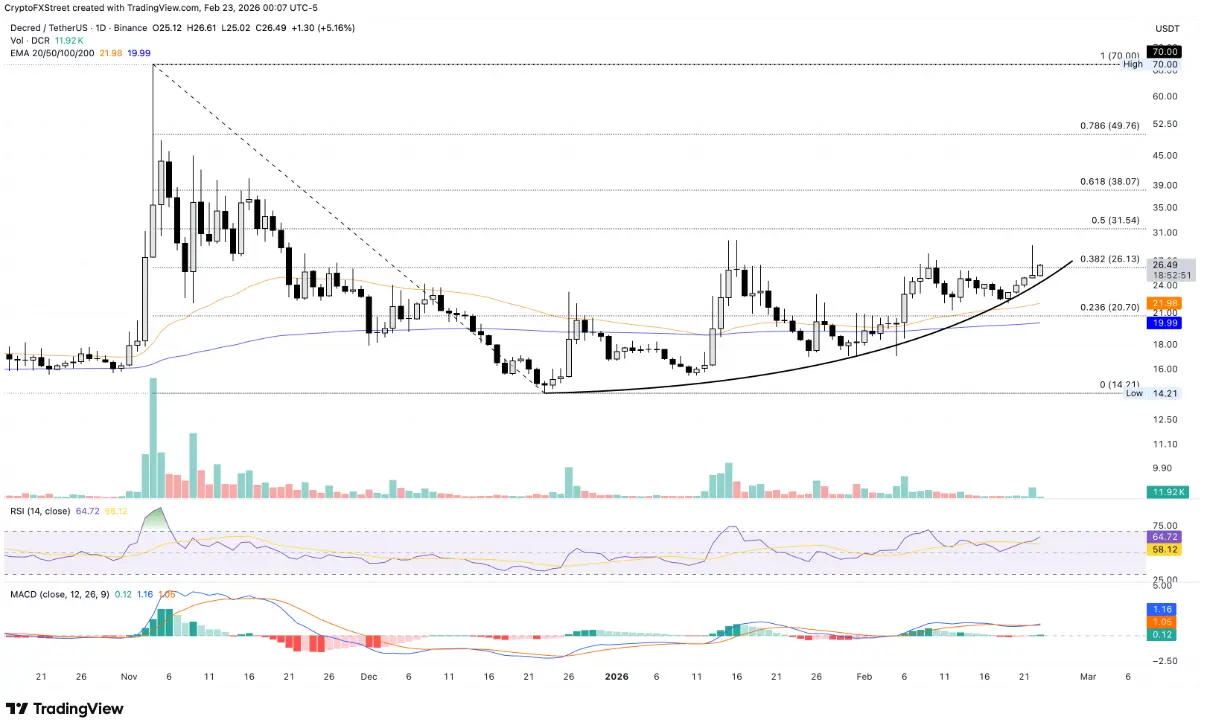 Daily DCR/USDT Chart (Logarithmic) | Source: TradingView In terms of momentum, the Relative Strength Index (RSI) on the daily timeframe is around 63 and continues to rise, indicating increasing buying strength and a sustained recovery from the neutral zone. More importantly, the RSI still has room to grow before entering overbought territory, supporting the scenario of continued price advancement. Additionally, the MACD line has crossed above the signal line, signaling positive momentum and the potential formation of a new bullish impulse.
Conversely, if the price fails to break above and reverses from the $26.13 zone, a correction scenario could unfold, with Decred retreating to test the 50-day Exponential Moving Average (EMA) around $21.96.
Disclaimer: The information on this page may come from third parties and does not represent the views or opinions of Gate. The content displayed on this page is for reference only and does not constitute any financial, investment, or legal advice. Gate does not guarantee the accuracy or completeness of the information and shall not be liable for any losses arising from the use of this information. Virtual asset investments carry high risks and are subject to significant price volatility. You may lose all of your invested principal. Please fully understand the relevant risks and make prudent decisions based on your own financial situation and risk tolerance. For details, please refer to
Disclaimer.
Related Articles
油價回穩助攻風險資產反彈!Wintermute:比特幣重上 7 萬美元反映地緣風險溢價降溫
加密貨幣做市商Wintermute指出,比特幣重返7萬美元關口的原因在於中東局勢緩和導致原油價格回落,降低地緣政治風險。市場對通膨與供應中斷的憂慮減輕,資金流向風險資產。若油價保持穩定,或將改善比特幣的表現;若再度上升,則可能壓制比特幣的價格。
区块客32m ago
Bitcoin steadies above $71,000 as oil falls below $100 after U.S. drafts 15‑point Iran peace plan
The essay discusses a 15-point peace plan aimed at resolving the U.S.-Israel-Iran conflict, reflecting positive market responses like a stable Bitcoin price. It also highlights fluctuating oil prices and their potential impact on inflation and financial markets, emphasizing uncertainty about the plan's effectiveness.
CoinDesk34m ago
加密貨幣 ETF 如何影響市場?疲弱市況下,從 ETF 趨勢辨別行情走勢
2026年的加密ETF市場已從監管故事轉變為觀察機構資金流向與比特幣價格韌性的指標。隨著市場成熟,主動式策略將成為新趨勢,ETF已不僅是資金進場的工具,而是配置風險的手段。ETF資金流動已成為市場情緒的即時溫度計,連續流入或流出反映風險偏好的變化。理解ETF的功能在於確認市場結構而非預測價格,特別是在弱市中,流入的資金更顯示底層需求。
区块客36m ago
Bitcoin ETF Ends Seven-Day Rally, Bitcoin Price Pressure Resurfaces
Recently, U.S. Bitcoin spot ETFs experienced significant outflows after consecutive seven trading days of net inflows, with net outflows of $163.5 million on the 18th and an additional $51.9 million on the 19th, indicating simultaneous weakening of market capital and prices. Bitcoin prices temporarily broke below $70,000, highlighting that ETF capital flows can no longer support its rebound, while deteriorating macroeconomic conditions have created pressure on risk assets, causing investor preference to noticeably contract. The test of the $70,000 level has become a barometer of short-term market sentiment.
区块客51m ago
Conflicting Ceasefire Signals Between US and Iran! Analysts: Iran's Next Move Will Determine Bitcoin's Direction
The United States is pushing for a ceasefire agreement with Iran, but Iranian media denies there are negotiations. These contradictory messages triggered market volatility, with stocks briefly rising, oil prices falling, and Bitcoin rebounding. Analysts point out that Iran's refusal of peace talks helps maintain its influence, market expectations of easing tensions or continued tensions will directly impact Bitcoin's price, and the future direction of the situation still requires monitoring of subsequent diplomatic developments.
MarketWhisper59m ago
XRP price compression zone approaches critical level, $1.42 becomes the key dividing line between bullish and bearish sentiment
XRP price oscillates around $1.41, entering a convergence zone in the short term. Whale accumulation signals capital positioning, but the macro environment constrains market sentiment. Technically, a break above $1.42 would point toward $1.45 to $1.50; a drop below $1.38 could trigger a pullback to $1.30. The market is watching key levels to determine the subsequent trend.
GateNews1h ago
