
Kaspa has been taking some heat lately, and the daily chart is starting to show the effects. As pointed out by KaspaDaily, the KAS price has now slipped into oversold territory on the daily RSI. That’s usually a sign that selling pressure is getting stretched and that the market may need a pause.
At the moment, the KAS price is hovering around $0.035, after days of steady downside. This hasn’t been a sudden crash, but a slow grind lower that’s worn buyers down and pushed momentum indicators to their limits.
- Kaspa Has Been Under Steady Selling Pressure
- All Eyes on Nearby Support
- The Next Few Days Matter for KAS
Kaspa Has Been Under Steady Selling Pressure
Looking at the daily chart shared by KaspaDaily, the direction of the KAS price has been pretty clear. After topping out in the $0.055 to $0.060 range, price started printing lower highs and lower lows. Each bounce attempt faded sooner than the last, keeping pressure on the downside.
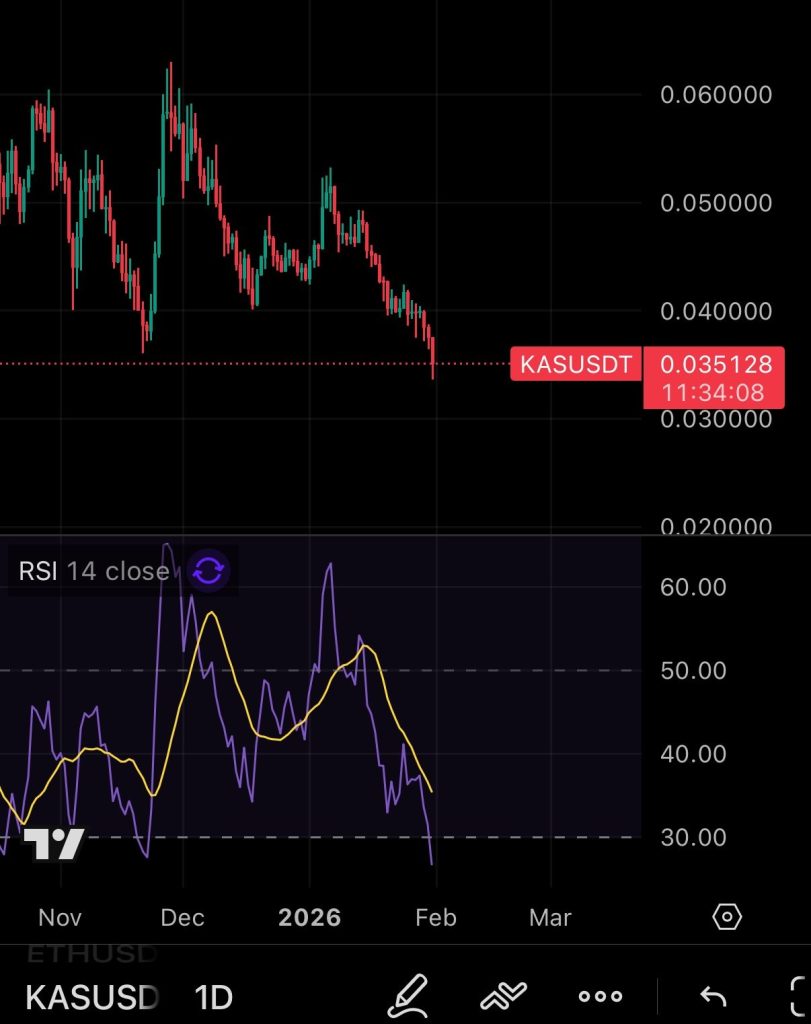
Source: X/@DailyKaspa
The $0.040 area tried to hold earlier in the move, but once that level broke, the KAS price slipped further without much resistance. By the time price reached the mid-$0.03 range, momentum had already weakened significantly, setting the stage for the current oversold reading.
The daily RSI dropping near the 30 level doesn’t mean Kaspa suddenly flips bullish. What it does mean is that selling has become crowded. A lot of traders who wanted out have likely already sold, and pushing the price much lower often takes more effort at this stage.
For the KAS price, oversold conditions usually lead to a slowdown. Sometimes that shows up as sideways movement. Other times there’s a short relief bounce. Either way, trends often lose speed when momentum gets this stretched.
All Eyes on Nearby Support
Right now, the zone between roughly $0.035 and $0.032 is the area to watch. This is where the KAS price is trying to find its footing. It’s close to prior reaction levels and sits just above the next visible support on the chart.
If price holds this range, Kaspa may spend some time stabilizing and letting indicators cool off. If sellers keep pressing and price slips cleanly below $0.032, attention shifts to lower levels that haven’t been tested recently.
Kaspa (KAS) vs BNB: This Comparison Makes BNB Look Uncomfortable_**
The Next Few Days Matter for KAS
The key takeaway here isn’t that the KAS price has to bounce right away. It’s that the pace of the decline is changing. Oversold conditions often force the market to slow down and reassess.
How Kaspa behaves over the next few daily candles will be important. If the sellers step back and the price starts to base, then we have a different story from another big move down. For now, the price of KAS is at a crossroads, and the market is waiting to see who blinks first.
Disclaimer: The information on this page may come from third parties and does not represent the views or opinions of Gate. The content displayed on this page is for reference only and does not constitute any financial, investment, or legal advice. Gate does not guarantee the accuracy or completeness of the information and shall not be liable for any losses arising from the use of this information. Virtual asset investments carry high risks and are subject to significant price volatility. You may lose all of your invested principal. Please fully understand the relevant risks and make prudent decisions based on your own financial situation and risk tolerance. For details, please refer to
Disclaimer.
Related Articles
XRP Today's News: SOPR Approaching Historical Signal of 1, Bottom Signal Emerging
XRP has continued to underperform since the start of the year, failing to attract market capital, with current trading prices below major moving averages. SOPR and NUPL indicators show bottom signals, but these are only probabilistic characteristics. $1.51 serves as a near-term bullish-bearish dividing line, with breakouts potentially triggering a bullish rebound. The market maintains a cautious stance on XRP's short-term strong rebound, with the probability of returning to $2 at only 5%.
MarketWhisper4m ago
Bitcoin Falls Below $69,000, Derivatives Market Shifts to Defense, Downside Risks Intensify
10x Research analysis points out that Bitcoin has broken below $69,000, marking a shift in market structure. Traders have significantly adjusted positions, with increased futures liquidations and negative funding rates. Options capital flows are moving toward downside protection, signaling hedging demand against downside risks. Meanwhile, market expectations regarding rate increases are diverging from the Federal Reserve's rate-cutting guidance, which could impact risk asset performance.
GateNews34m ago
Hyperliquid Surpasses CME Pricing Status, On-Chain Commodity Trading Volume Breaks $173.4 Billion
Hyperliquid's HIP-3 board has achieved billion in trading volume over the past 7 days, primarily driven by WTI crude oil contracts, demonstrating strong market activity. Powered by the US-Iran conflict, the platform's 24/7 trading functionality has made it an important source for price discovery, replacing traditional exchanges. As Hyperliquid adapts to CFTC regulations, it aims to maintain financial neutrality, but how to balance compliance requirements with the advantages of decentralized trading remains a challenge.
MarketWhisper59m ago
Gate Daily Report (March 23): MicroStrategy Releases Bitcoin Buy Signal; MajiDaBro's ETH Liquidation Incurs Losses of 30.35 Million
Bitcoin has continued to decline to around $67,950, with MicroStrategy founder Michael Saylor reiterating a buy-the-dip strategy. Huang Licheng's highly leveraged ETH position was completely liquidated, with losses exceeding $30.35 million. Fidelity has called on the US SEC to improve its regulatory framework for crypto assets. US stocks have broadly declined, and market sentiment remains cautious.
MarketWhisper1h ago
Scaramucci: Bitcoin Halving Cycle Remains Intact, Q4 Bull Market About to Resume
SkyBridge Investment Company partner Scaramucci stated that Bitcoin's four-year halving cycle remains effective, with the current bear market representing a normal pullback, predicting another bull market for Bitcoin in 2026. The market's collective belief is self-fulfilling, and pessimistic sentiment similar to historical patterns could present entry opportunities. Although institutional investors influence cyclical volatility, the fundamental nature of the halving cycle has not changed.
MarketWhisper1h ago
Why Did Bitcoin Fall Today? Trump's 48-Hour Ultimatum Triggers Market Panic
Bitcoin declined to $67,979.57 today, primarily affected by US-Iran tensions, higher-than-expected US PPI data, and whale short-selling activity. Global markets face stagflation pressure, with $70,000 serving as a key support level. If this level is breached, prices could potentially decline to $68,000.
MarketWhisper2h ago
