Bitcoin has recovered strongly from the $86,000 zone, but the upward momentum remains unconvincing as the bulls struggle to hold higher levels. This development indicates that selling pressure is still ready to emerge whenever prices rally, creating significant short-term pressure on the trend.
Although Bitcoin’s outlook is still subject to debate, Binance co-founder Changpeng Zhao told CNBC that Bitcoin could enter a “super cycle” within the next 12 months. This view reflects confidence in the long-term growth potential of the largest cryptocurrency in the market.
Conversely, Bloomberg Intelligence strategist Mike McGlone believes that BTC has formed a cycle top. In an interview with Cointelegraph, he admitted that the bottom area has not yet been identified, but views the upcoming correction as a “price cleansing therapy.”
Meanwhile, many institutional investors are more optimistic, assessing that Bitcoin is undervalued in the $85,000–$95,000 range. Coinbase’s Charting Crypto Q1/2026 report shows that 80% of surveyed institutions are willing to hold or increase their positions if the market drops another 10%.
So, can Bitcoin and the top altcoins hold steady at these key support levels? Let’s delve into the analysis of the charts of the 10 largest cryptocurrencies to find the answer.
Technical Analysis of SPX
The S&P 500 (SPX) rebounded strongly from the 50-day simple moving average (SMA) at 6,840 on Monday, indicating buying interest as prices corrected.
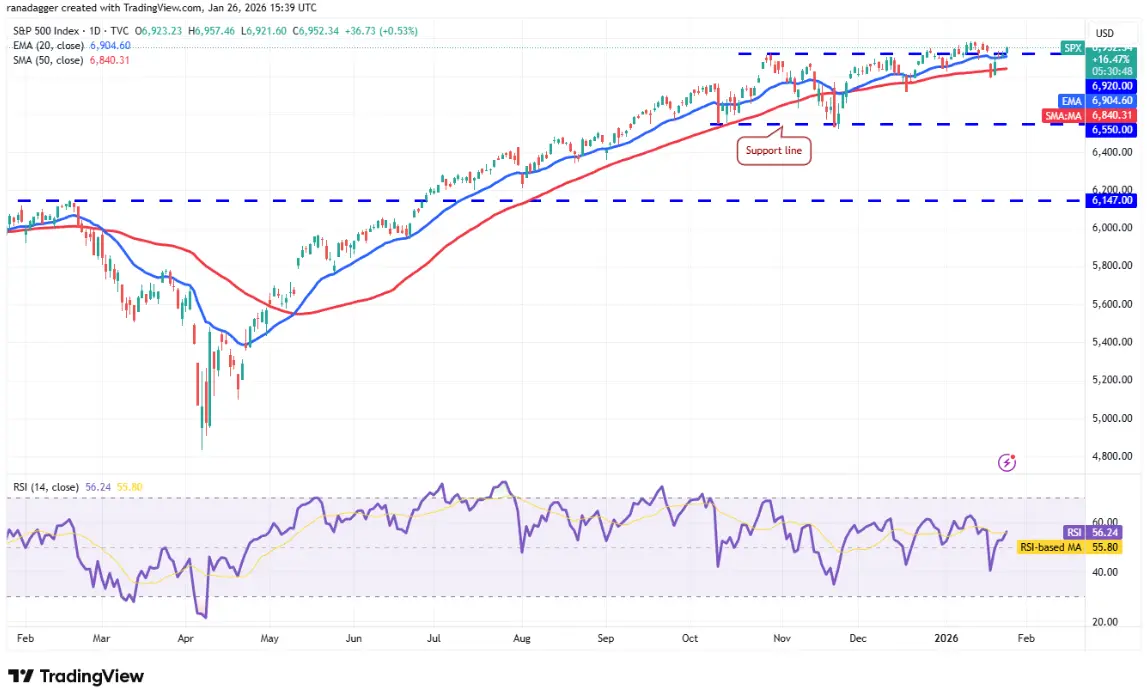 Daily SPX Chart | Source: TradingView The 20-day exponential moving average (EMA) at 6,904 is moving sideways, while the Relative Strength Index (RSI) is only slightly above neutral, reflecting weakening momentum. Bulls need to push the price above the 7,000 mark to open the door for the next rally toward 7,290.
On the downside, bears may attempt to pull the price below the 50-day SMA, triggering a deeper correction toward 6,720.
Technical Analysis of DXY
The DXY index fell below the moving averages on Monday and broke the support level at 97.74 on Friday.
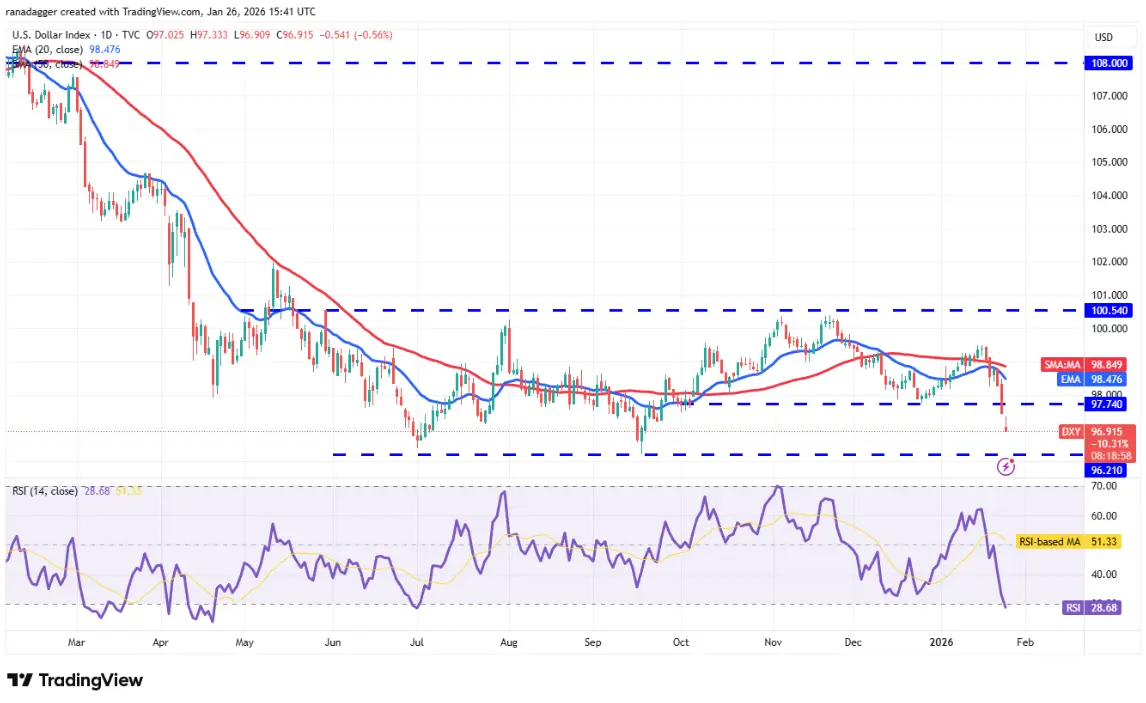 Daily DXY Chart | Source: TradingView The bears will try to push the price down to the strong support zone at 96.21 — an important level to watch. If this support is broken, the index could continue its decline toward 94.62.
The bulls face many challenges as they need to push the price back above the moving averages to maintain a sideways trend within the range of 96.21 to 100.54 for some more time.
Technical Analysis of BTC
BTC reversed lower from the 20-day EMA at $90,521 on Friday and fell below the upward trendline on Sunday.
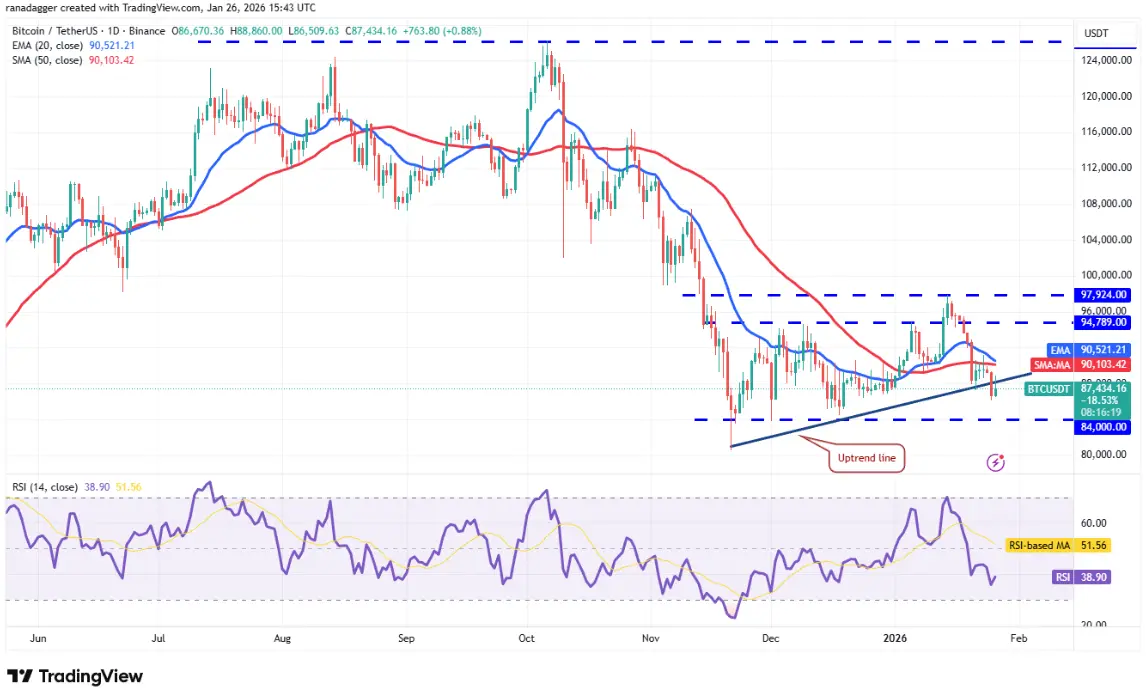 Daily BTC/USDT Chart | Source: TradingView The 20-day EMA has started to slope downward, while RSI is in the negative zone, indicating that the advantage is tilted toward the bears. Any recovery attempts are likely to face selling pressure at the moving averages. If the price reverses from these levels, the BTC/USDT pair could plunge to $84,000, possibly even to $80,600.
This negative scenario will be invalidated in the short term if Bitcoin reverses higher and breaks above the moving averages. In that case, the price could surge toward the resistance zone at $97,924.
Technical Analysis of ETH
Ether (ETH) broke down from the symmetrical triangle pattern to the downside after piercing the support level on Sunday.
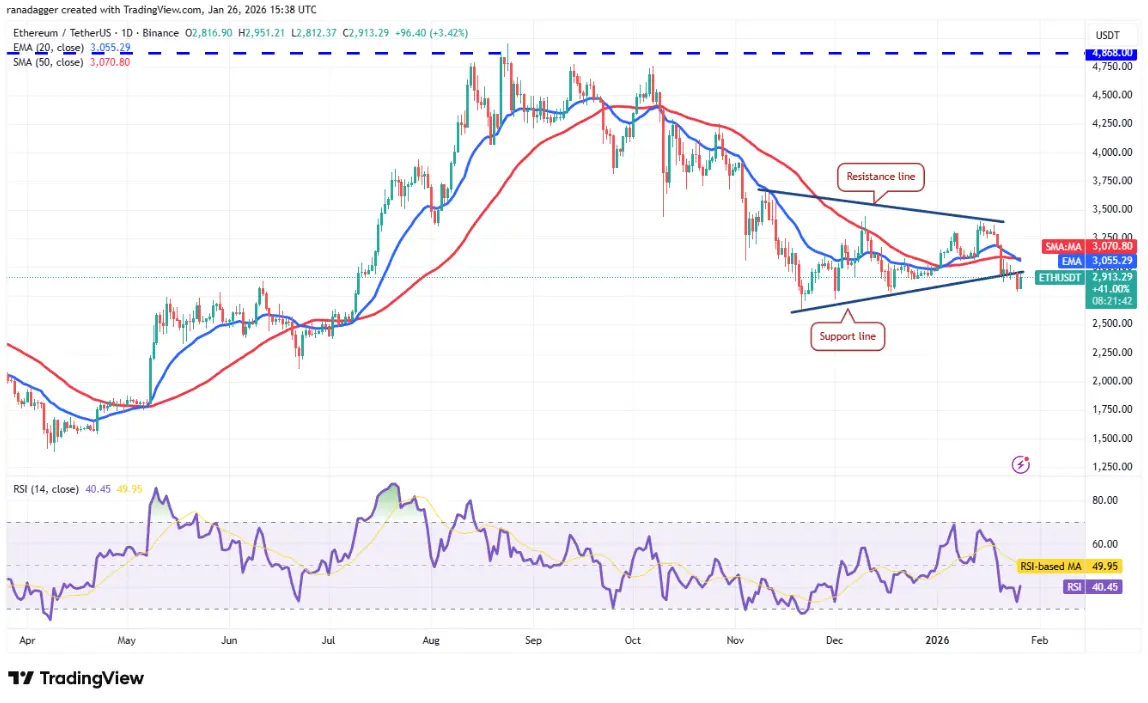 Daily ETH/USDT Chart | Source: TradingView Bulls will try to push the price back inside the triangle, but are likely to face significant resistance from the bears. If the price drops sharply from the moving averages, the risk of ETH falling to $2,623 increases.
To reverse the trend, bulls need to quickly push the price above the moving averages, which could indicate that the recent breakdown was just a “bear trap.” If so, the ETH/USDT pair could rise to the triangle’s resistance line.
Technical Analysis of XRP
XRP is gradually declining within a descending channel pattern, indicating that bears are still in control.
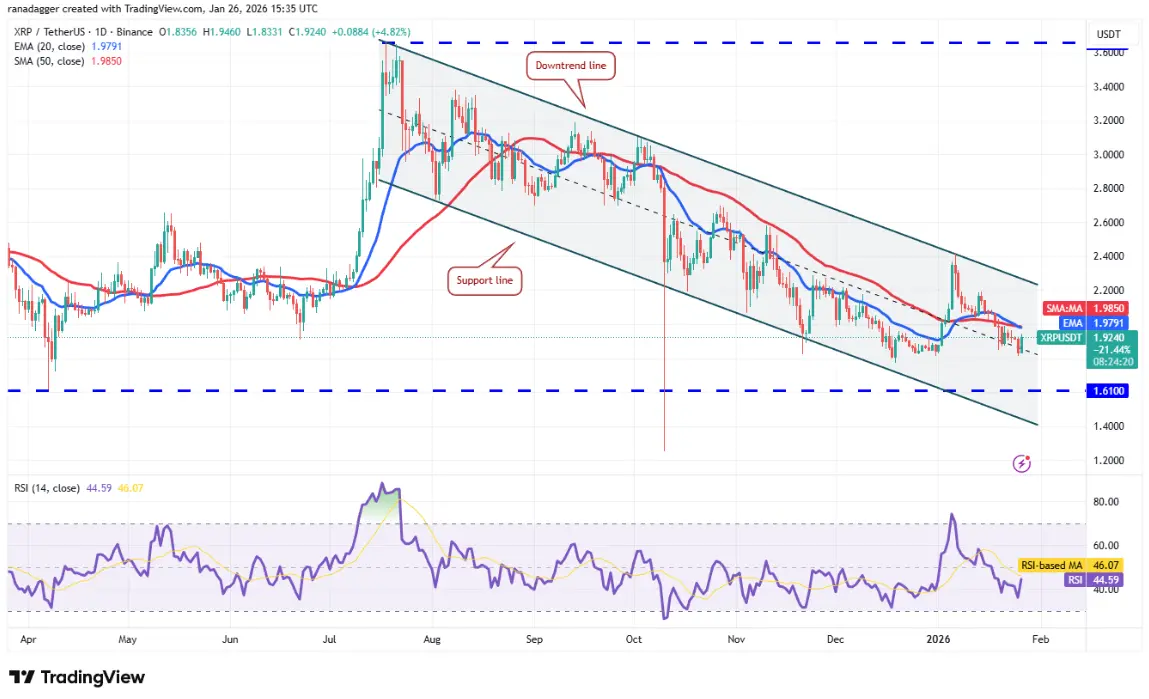 Daily XRP/USDT Chart | Source: TradingView The support zone is currently at $1.81, but a technical rebound is likely to encounter selling at the 20-day EMA at $1.97. If the price drops sharply from this level, the XRP/USDT pair could plunge to the strong support at $1.61.
Conversely, if XRP breaks above the moving averages, the recovery could extend to the downward trendline. Closing above this trendline would signal a potential short-term trend reversal.
Technical Analysis of BNB
BNB closed below the 50-day SMA at $883 on Sunday, indicating that bulls are gradually losing their advantage.
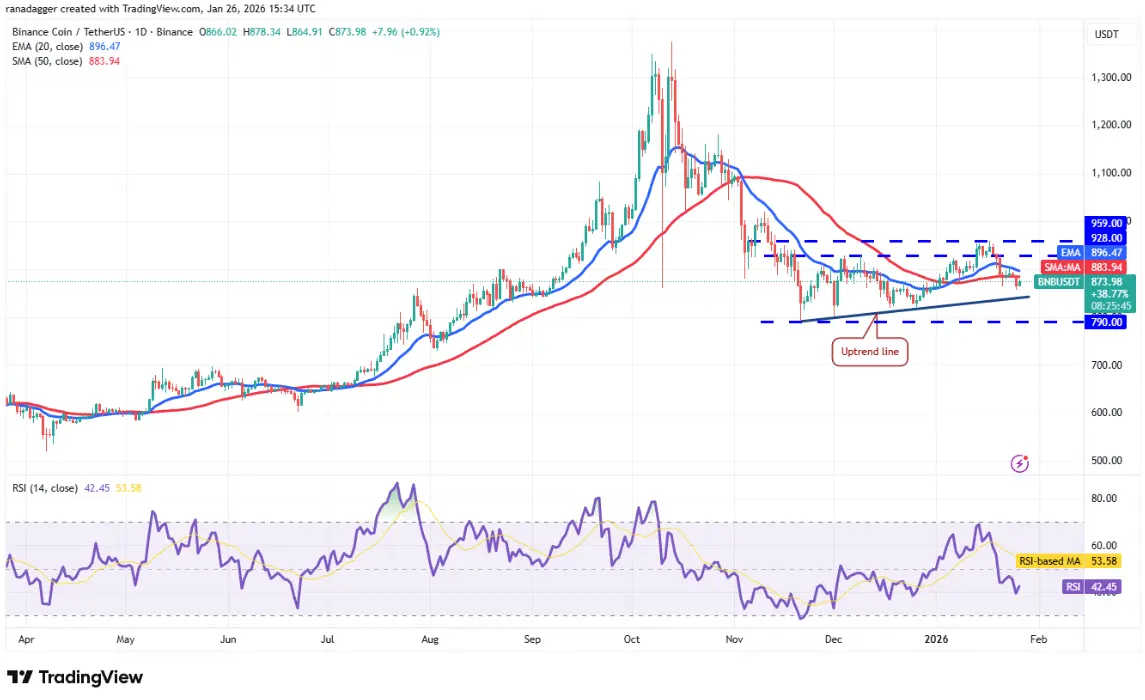 Daily BNB/USDT Chart | Source: TradingView The recovery from the upward trendline is expected to face selling pressure at the 20-day EMA at $896. If the price reverses downward from here, the likelihood of BNB falling back to the support zone at $790 increases. Bulls must defend the $790 level strongly, as a close below this could lead to continued downward movement.
The first positive signal would be a close back above the moving averages. If that happens, the BNB/USDT pair could move up toward the resistance zone at $959.
Technical Analysis of SOL
Solana (SOL) rebounded from the $117 support zone on Monday, indicating that bulls are trying to defend this level.
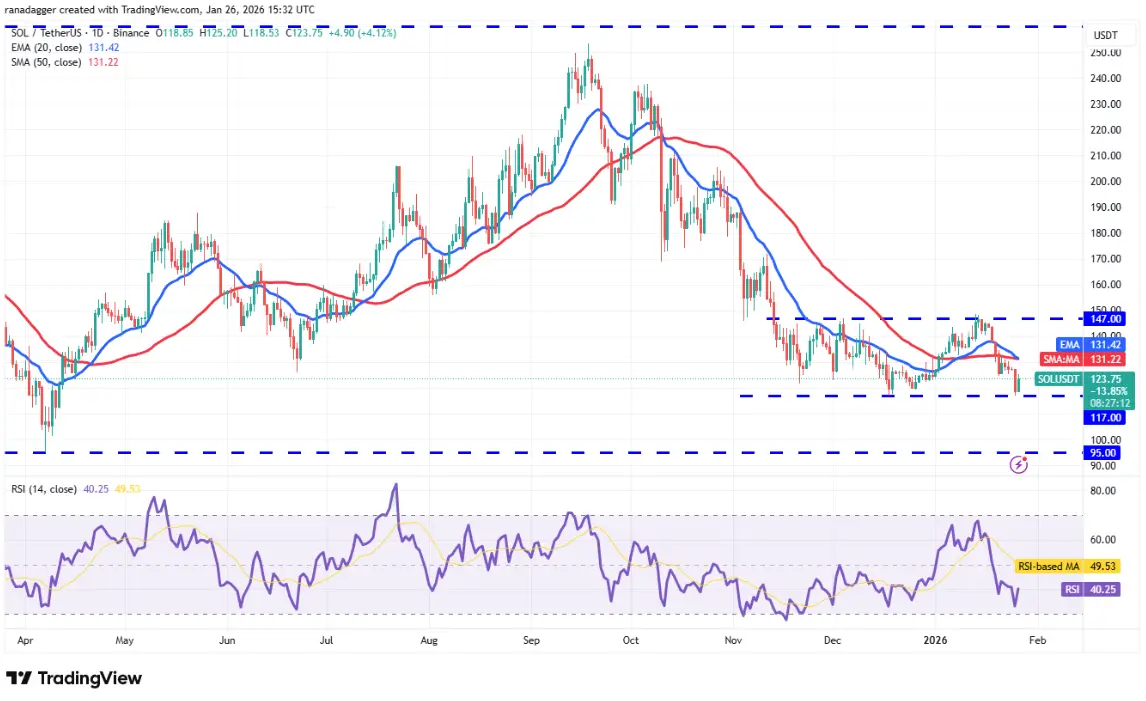 Daily SOL/USDT Chart | Source: TradingView However, the technical recovery is expected to face selling pressure around the 20-day EMA at $131. If the price drops sharply from the 20-day EMA, the risk of breaking below $117 increases. In that case, the SOL/USDT pair could plunge toward the strong support at $95.
Alternatively, if Solana’s price rises again and breaks above the moving averages, it suggests that the pair could continue to fluctuate within the 117–147 USD range for some more time.
Technical Analysis of DOGE
Bulls are trying to keep Dogecoin (DOGE) above the $0.12 level, but bears are continuously exerting pressure.
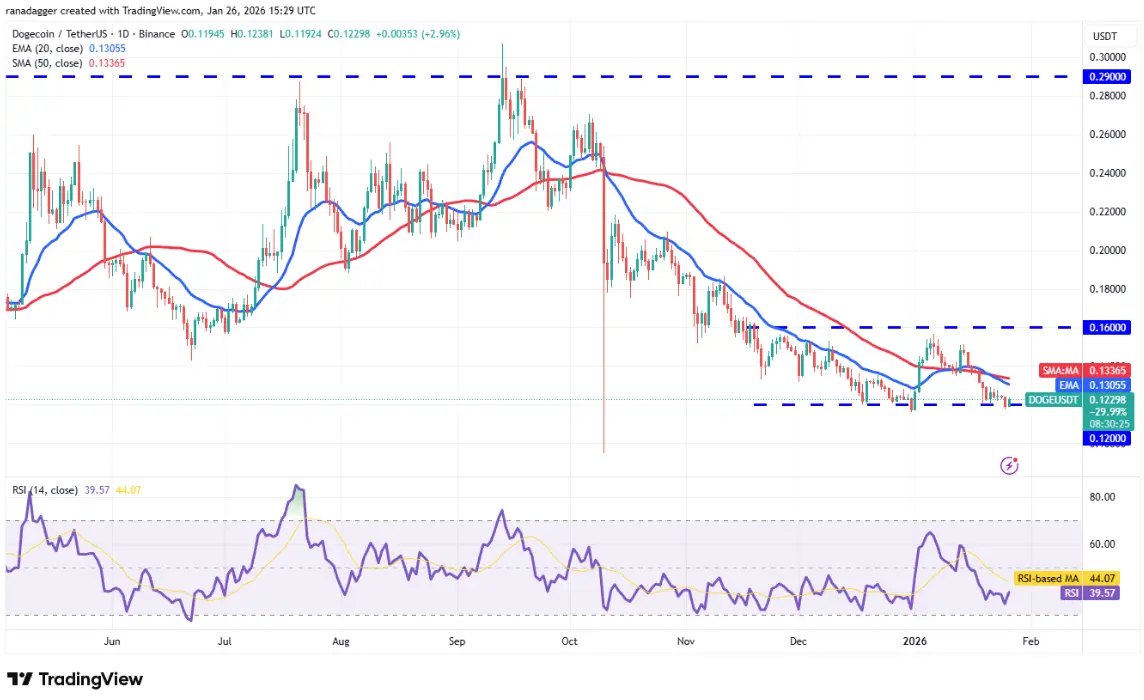 Daily DOGE/USDT Chart | Source: TradingView If the support at $0.12 is broken, the DOGE/USDT pair could enter the next leg of decline toward the October 10, 2025, low at $0.10.
If the price rebounds from the current zone, bears will attempt to block the recovery around the moving averages. If this scenario occurs, the probability of breaking below $0.12 increases. To maintain the trading range of $0.12–$0.16, bulls need to push Dogecoin above the moving averages.
Technical Analysis of ADA
Cardano (ADA) has rebounded from the support zone at $0.33, which is an important level to watch in the short term.
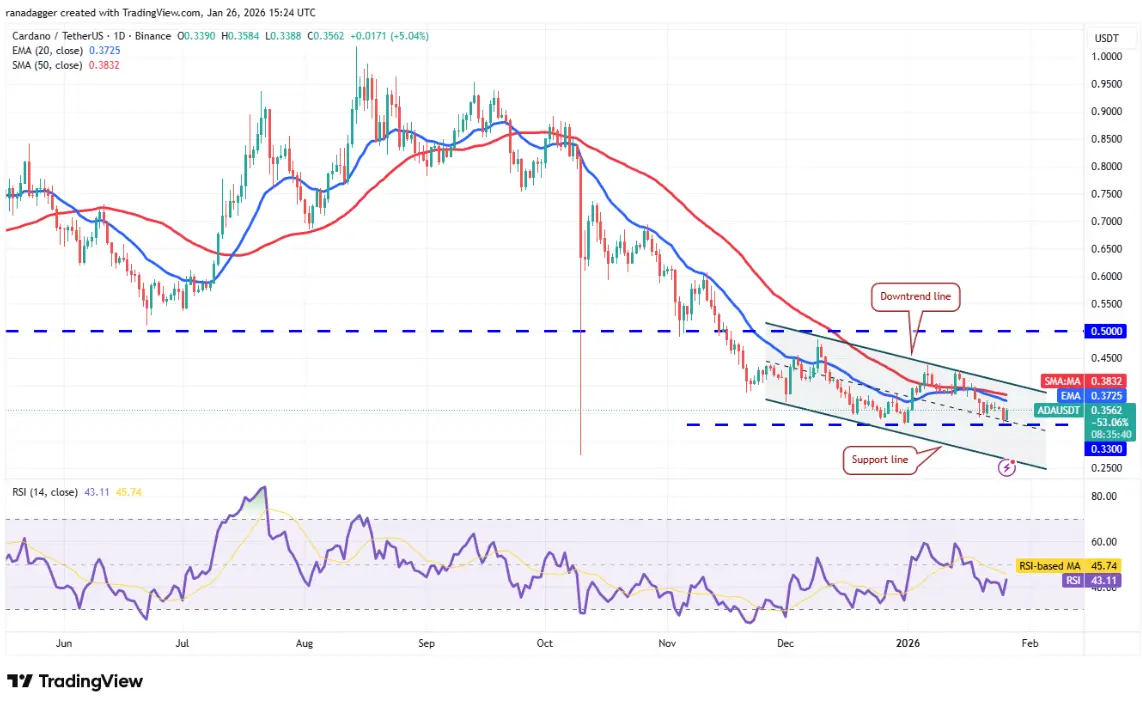 Daily ADA/USDT Chart | Source: TradingView Bulls need to quickly push the price above the downtrend line to send a positive signal. If successful, the ADA/USDT pair could rise to the $0.50 zone — a previous breakout level that is expected to be a major challenge for the bulls.
Gains will be hindered if bears manage to prevent the recovery at the downtrend line. If the price reverses downward from the resistance zone above, bears will continue to try to push the pair below $0.33. If they succeed, the next target is likely the support line of the descending channel pattern, near the October 10, 2025, low at $0.27.
Technical Analysis of BCH
Bitcoin Cash (BCH) dropped sharply from the 20-day EMA at $596 on Sunday. However, a small positive sign is that bulls managed to hold the support zone at $563.
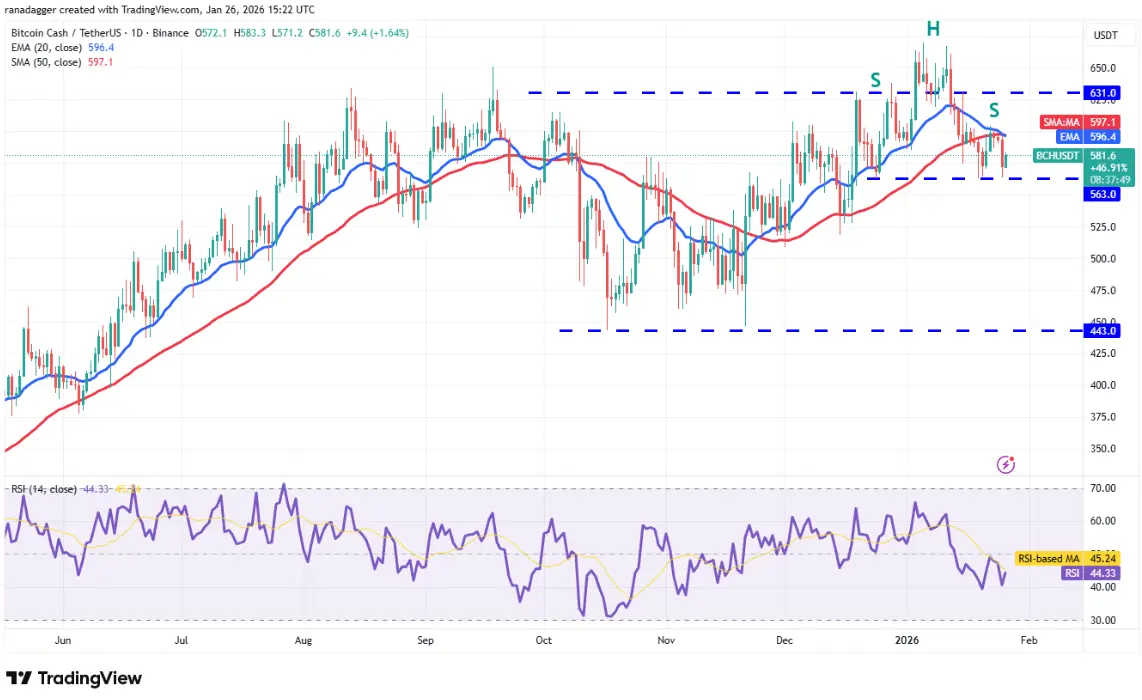 Daily BCH/USDT Chart | Source: TradingView The 20-day EMA is sloping downward, and the RSI is in the negative zone, indicating that the bears may continue to push BCH below $563. If that happens, the BCH/USDT pair could complete a head and shoulders pattern and plunge toward the $518 support zone.
On the other hand, if bulls push the price above the moving averages, the pair could rise to $631. Bears are expected to defend the zone between $631 and $670 aggressively.
