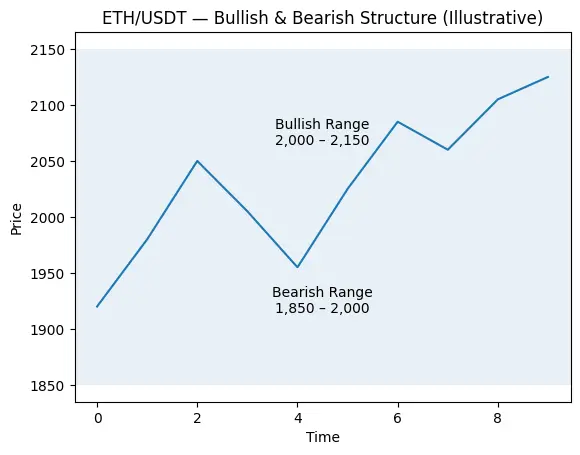
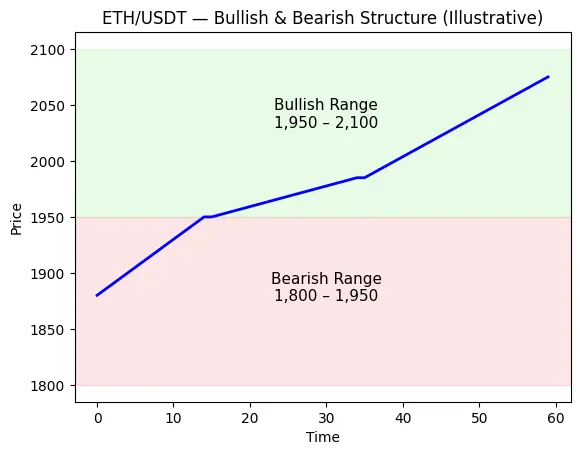
$ETH Speaks Louder Than Candles
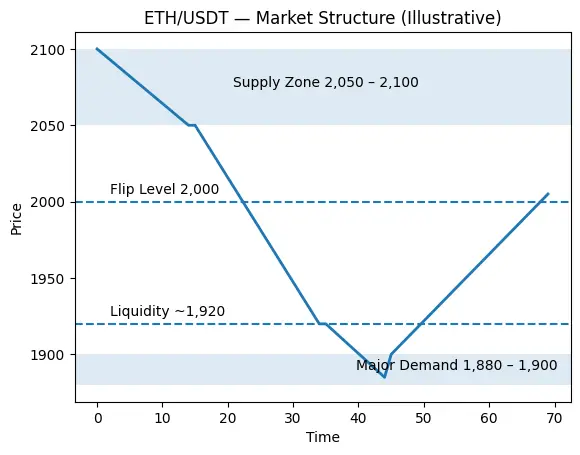
Price behavior is rarely random. Momentum gets attention, but structure shows intent. ETH reacted sharply from the lower area near 1,906, establishing a clear recovery leg. The move was not explosive; it was controlled. This often signals positioning rather than emotion.
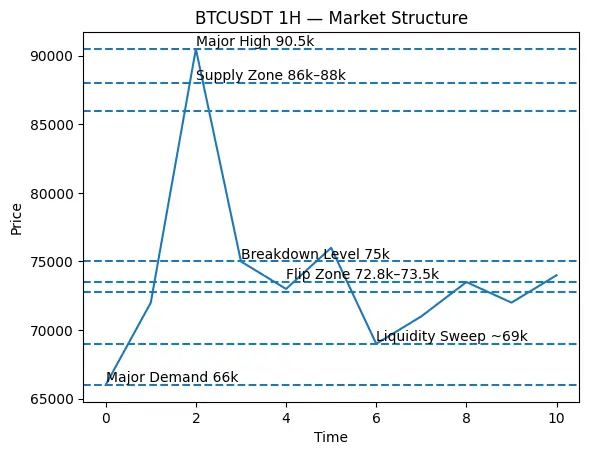
Current Structure Map
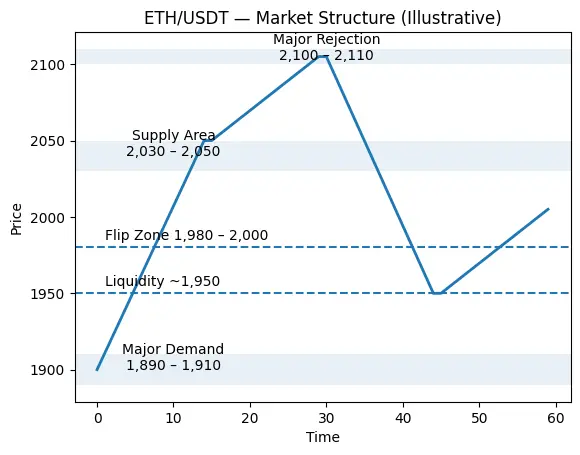
• Immediate Resistance: 2,000, 2,010
• Local Reaction Zone: 1,970, 1,985
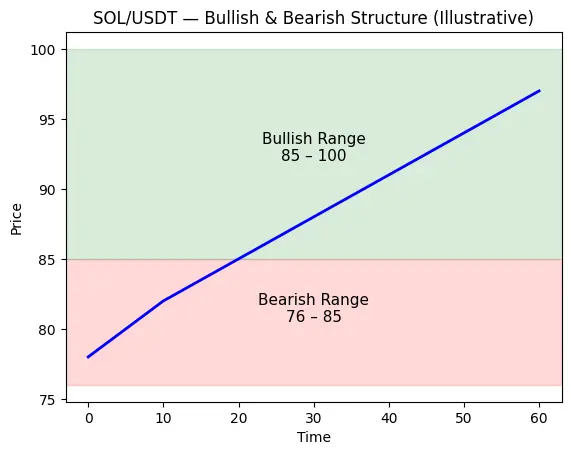
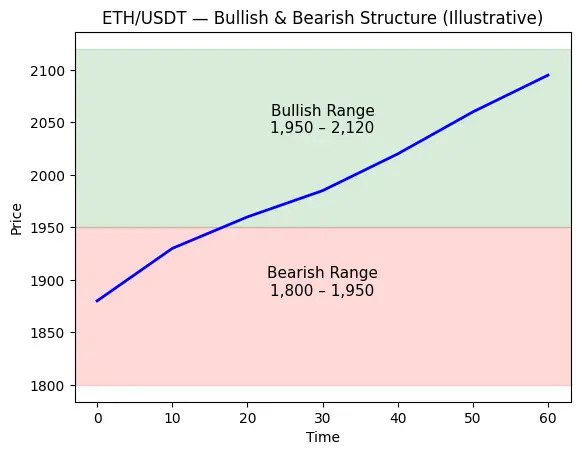
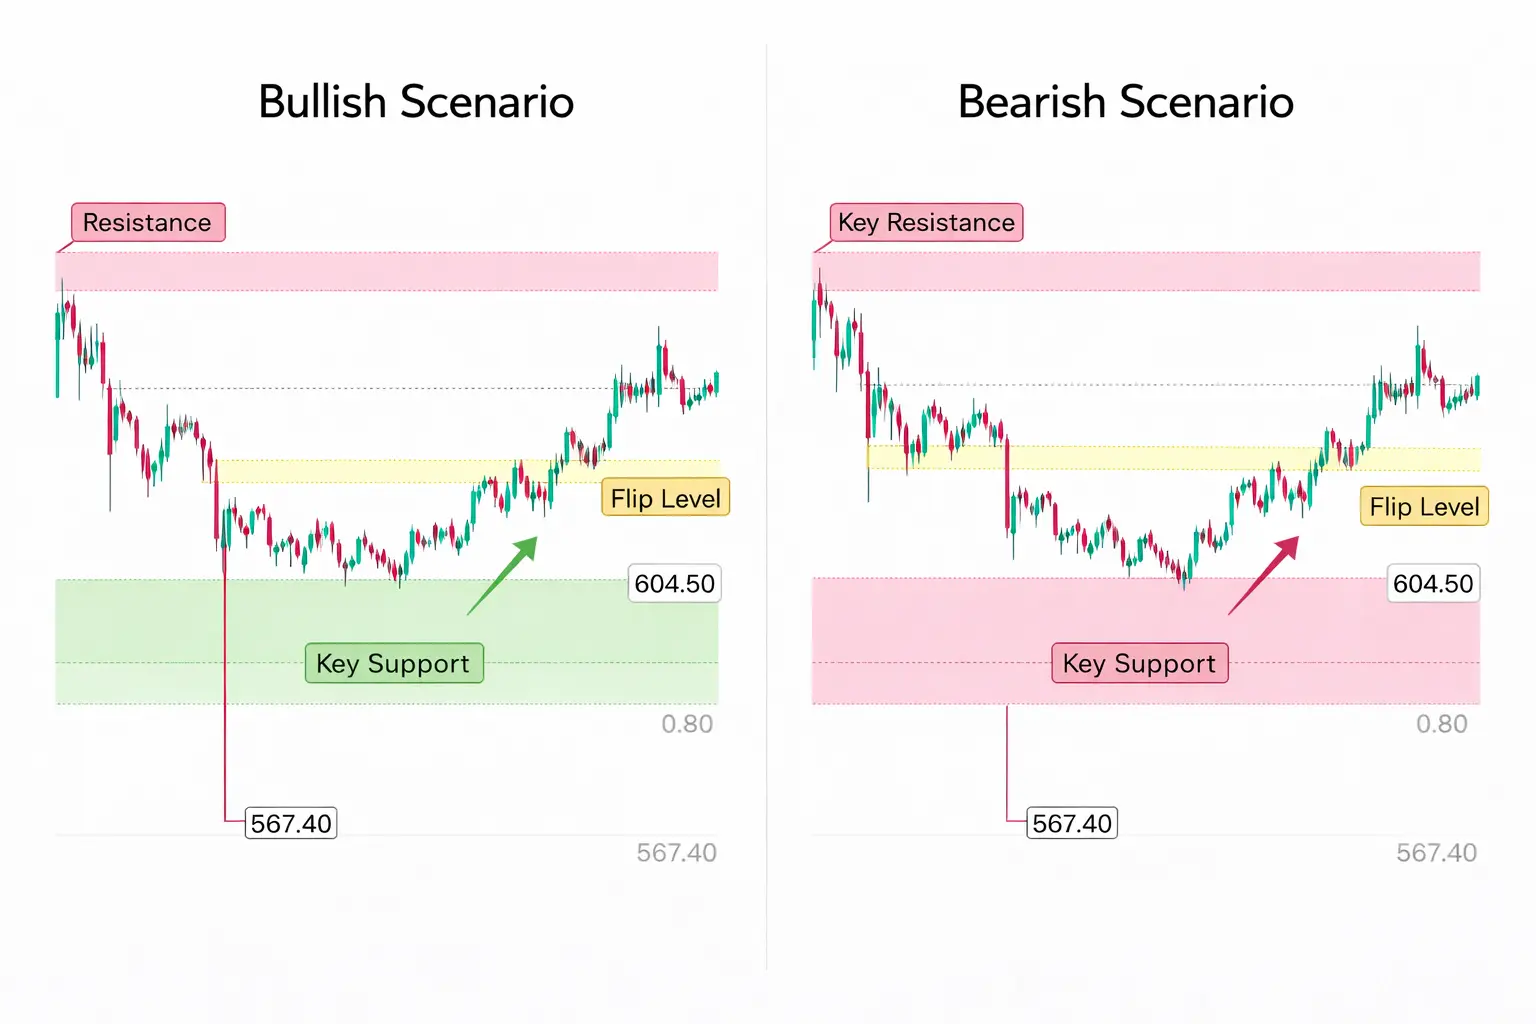
• Flip Level: 1,955, 1,965
• Key Support: 1,930, 1,945
• Major Demand: 1,900, 1,915
The crucial detail is not the bounce itself; it is how price behaves around the flip zone. Accepta