Trade
Basic
Futures
Futures
Hundreds of contracts settled in USDT or BTC
Options
HOT
Trade European-style vanilla options
Unified Account
Maximize your capital efficiency
Demo Trading
Futures Kickoff
Get prepared for your futures trading
Futures Events
Participate in events to win generous rewards
Demo Trading
Use virtual funds to experience risk-free trading
Earn
Launch
CandyDrop
Collect candies to earn airdrops
Launchpool
Quick staking, earn potential new tokens
HODLer Airdrop
Hold GT and get massive airdrops for free
Launchpad
Be early to the next big token project
Alpha Points
NEW
Trade on-chain assets and enjoy airdrop rewards!
Futures Points
NEW
Earn futures points and claim airdrop rewards
Investment
Simple Earn
Earn interests with idle tokens
Auto-Invest
Auto-invest on a regular basis
Dual Investment
Buy low and sell high to take profits from price fluctuations
Soft Staking
Earn rewards with flexible staking
Crypto Loan
0 Fees
Pledge one crypto to borrow another
Lending Center
One-stop lending hub
VIP Wealth Hub
Customized wealth management empowers your assets growth
Private Wealth Management
Customized asset management to grow your digital assets
Quant Fund
Top asset management team helps you profit without hassle
Staking
Stake cryptos to earn in PoS products
Smart Leverage
NEW
No forced liquidation before maturity, worry-free leveraged gains
GUSD Minting
Use USDT/USDC to mint GUSD for treasury-level yields
More
Promotions
Activity Center
Join activities and win big cash prizes and exclusive merch
Referral
20 USDT
Earn 40% commission or up to 500 USDT rewards
Announcements
Announcements of new listings, activities, upgrades, etc
Gate Blog
Crypto industry articles
VIP Services
Huge fee discounts
Proof of Reserves
Gate promises 100% proof of reserves
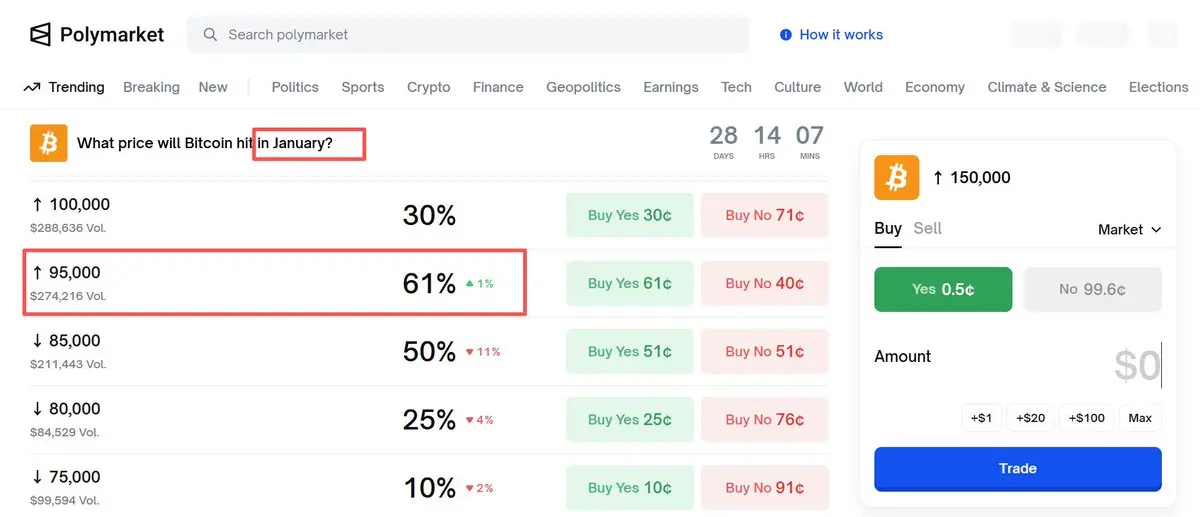
On Polymarket, the probability of the price reaching 95K in January $BTC is 61%.
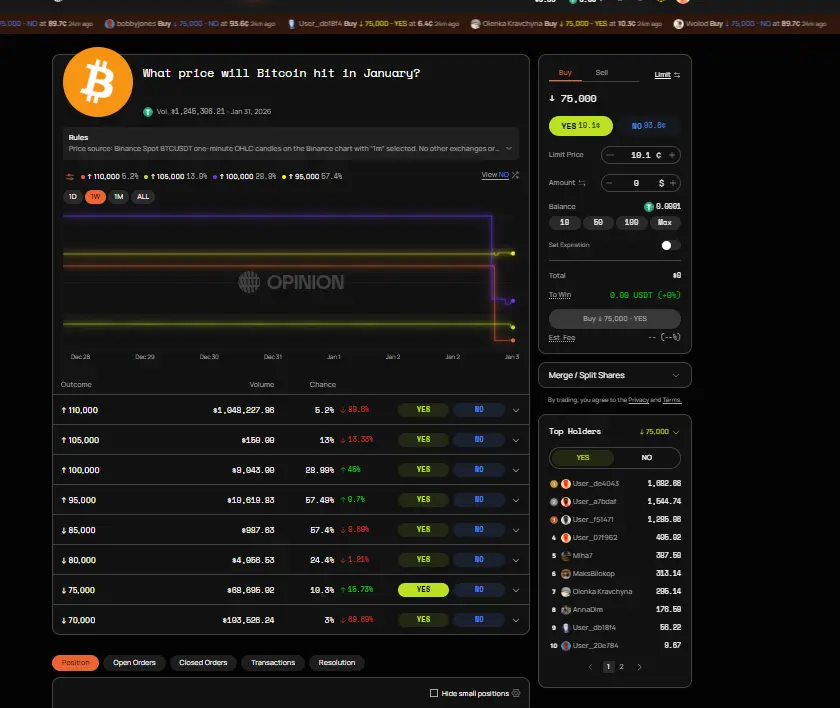
I placed bets on the more certain outcomes on opinion. The price of Bitcoin in January is unlikely to reach 75K, so I bet NO on the 75K option.
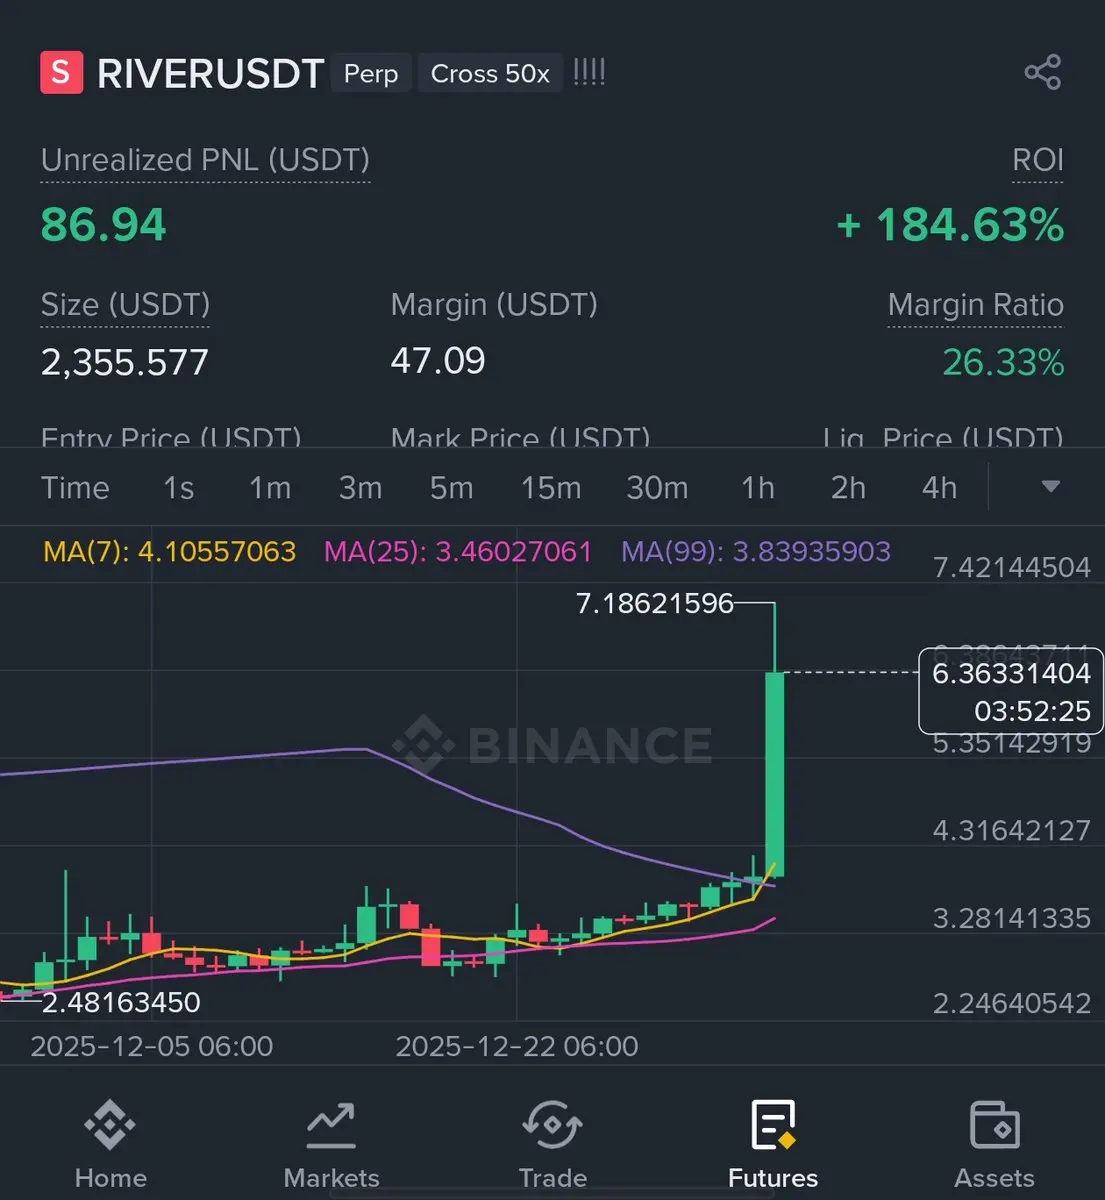
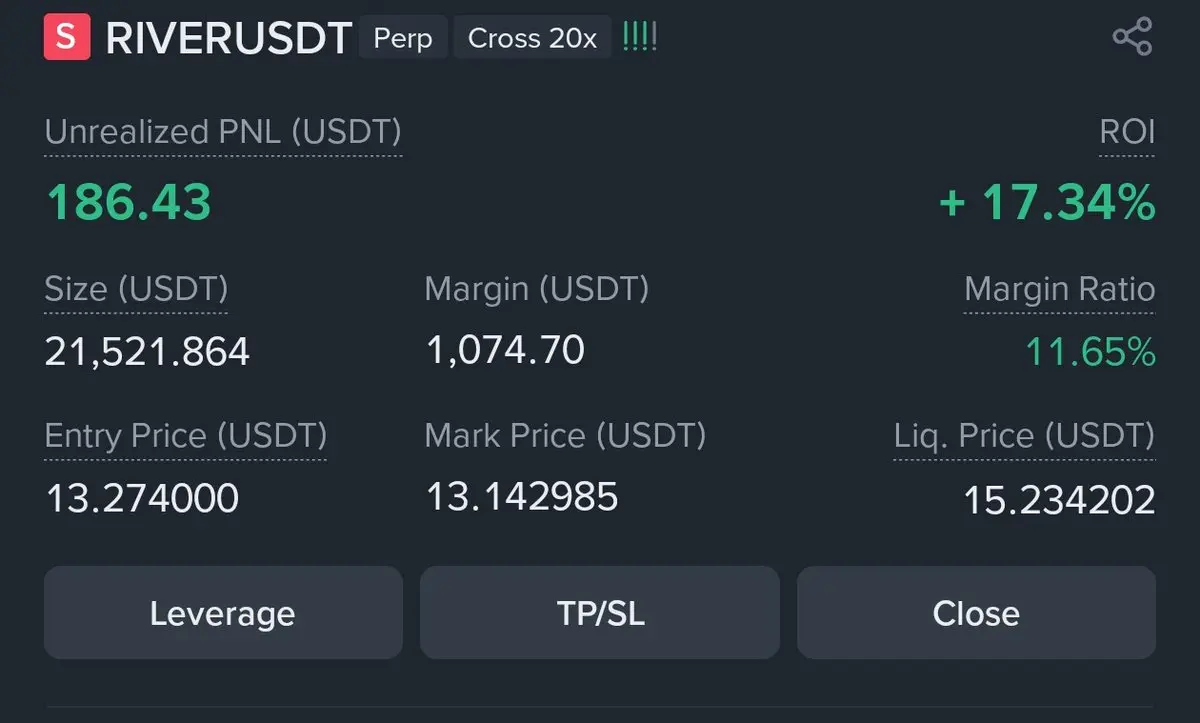
We just seek stability, not great wealth. Just trade a bit to boost trading volume and speculate on the TGE airdrop expectations.
I placed bets on the more certain outcomes on opinion. The price of Bitcoin in January is unlikely to reach 75K, so I bet NO on the 75K option.
We just seek stability, not great wealth. Just trade a bit to boost trading volume and speculate on the TGE airdrop expectations.
BTC1,43%
- Reward
- like
- Comment
- Repost
- Share
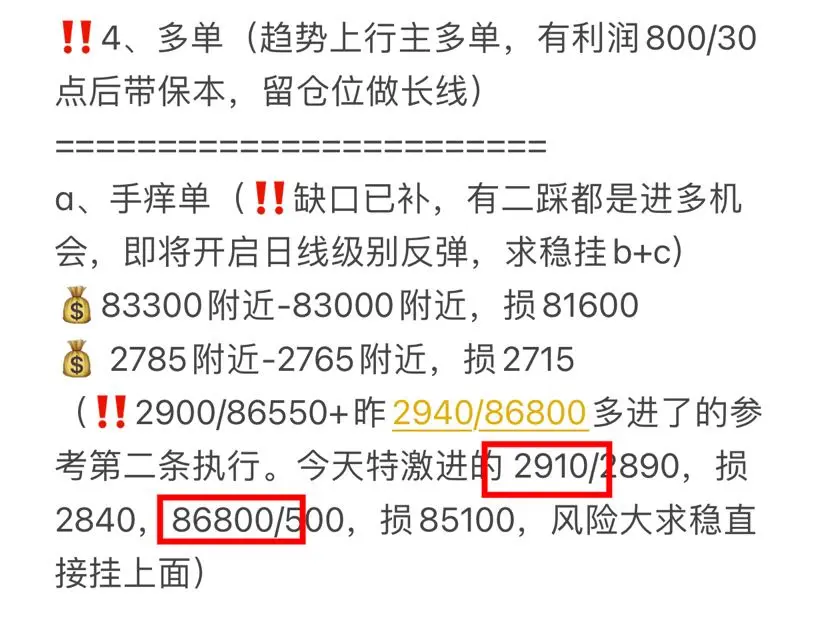
🔥 Guan He Ping Lun Old Iron Friends, give U‼️ Unknowingly, the subscription has entered its 3rd year, and the number of subscribers has exceeded 150🀄️ The New Year's Day 3.8gt discount is now available. Friends who subscribe are not fools; if you don't earn, then you definitely are haha 😄 Apple can click 👇 or copy to the web page to subscribe:
https://www.gate.com/zh/profile/Qingquan streams beneath the stones
————————————————
🔥 Monday 3045/90300 short 2910/86800 eat meat
🔥 Tuesday 2910/86800 reverse hand more 3105/90100 eat big meat
————————————————
🔥 Federal Reserve overnight 3440/943
View Originalhttps://www.gate.com/zh/profile/Qingquan streams beneath the stones
————————————————
🔥 Monday 3045/90300 short 2910/86800 eat meat
🔥 Tuesday 2910/86800 reverse hand more 3105/90100 eat big meat
————————————————
🔥 Federal Reserve overnight 3440/943
- Reward
- 10
- 10
- Repost
- Share
KeepUpWithTheRhythmOfTheTimes :
:
New Year Wealth Explosion 🤑View More
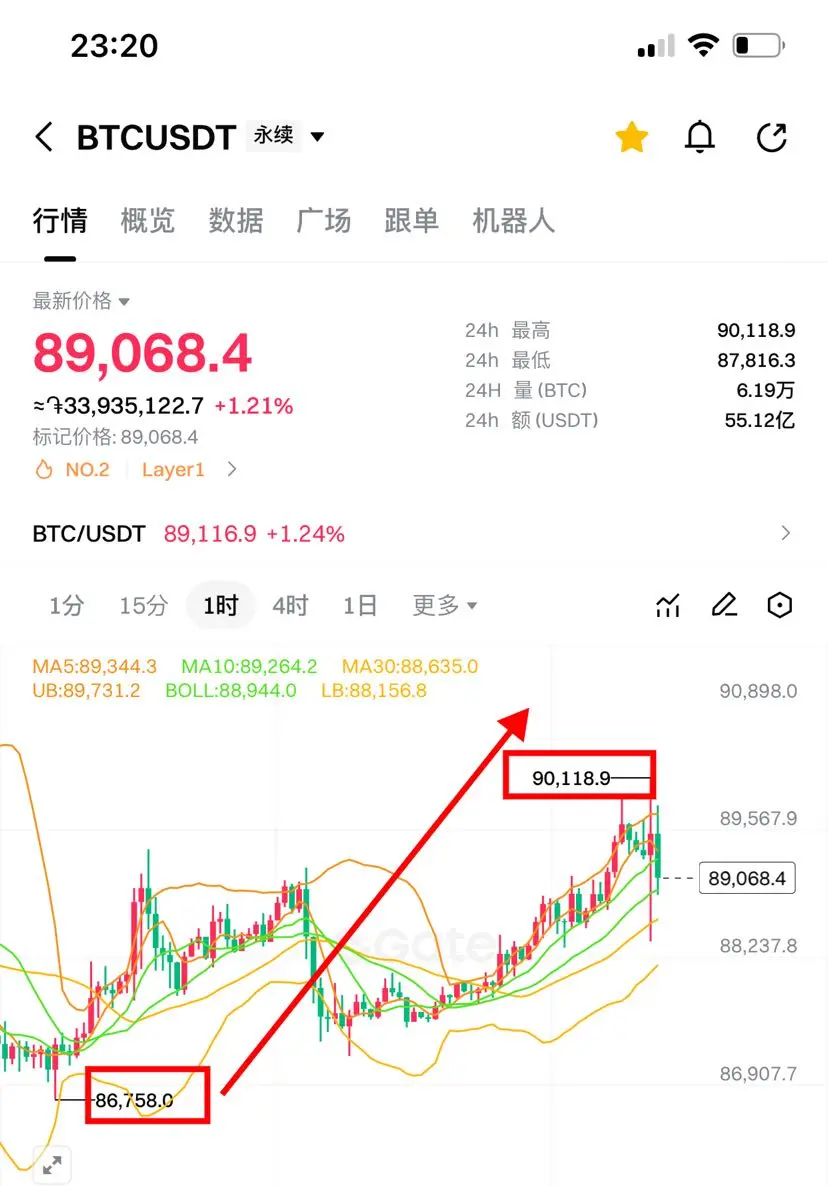
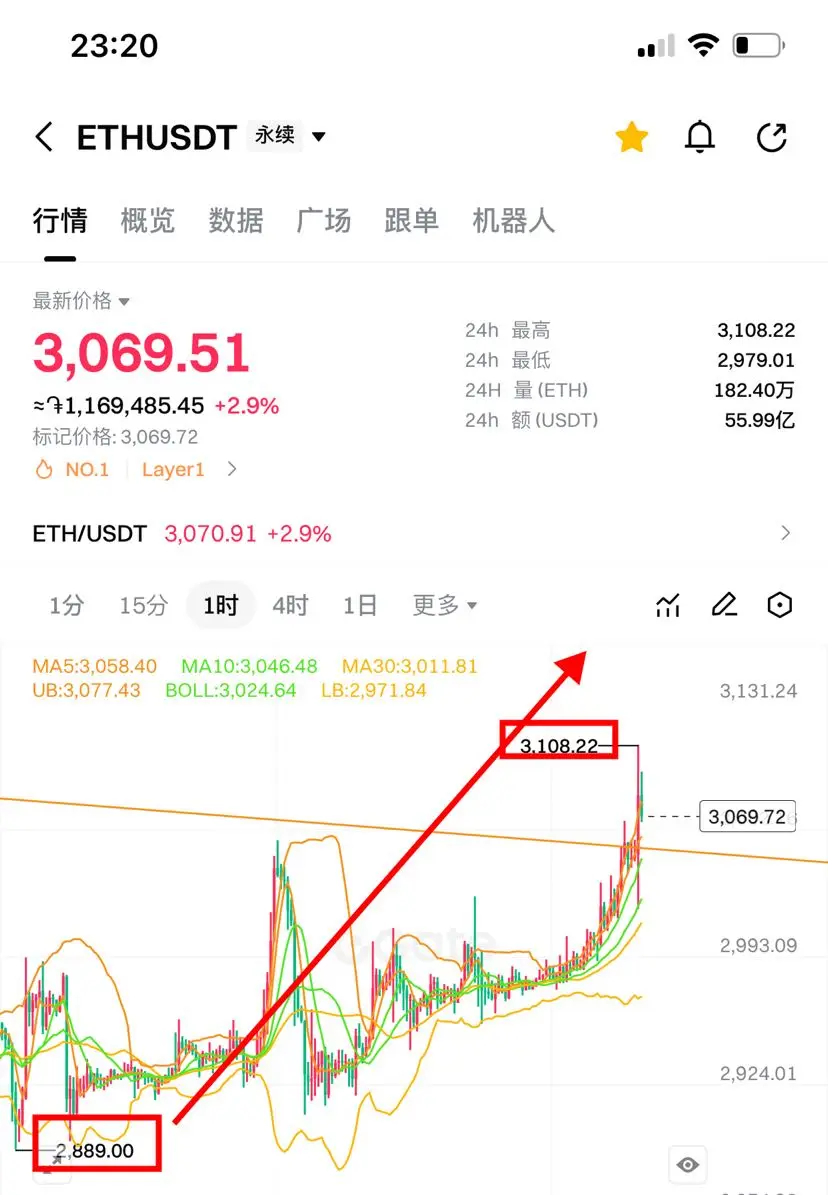
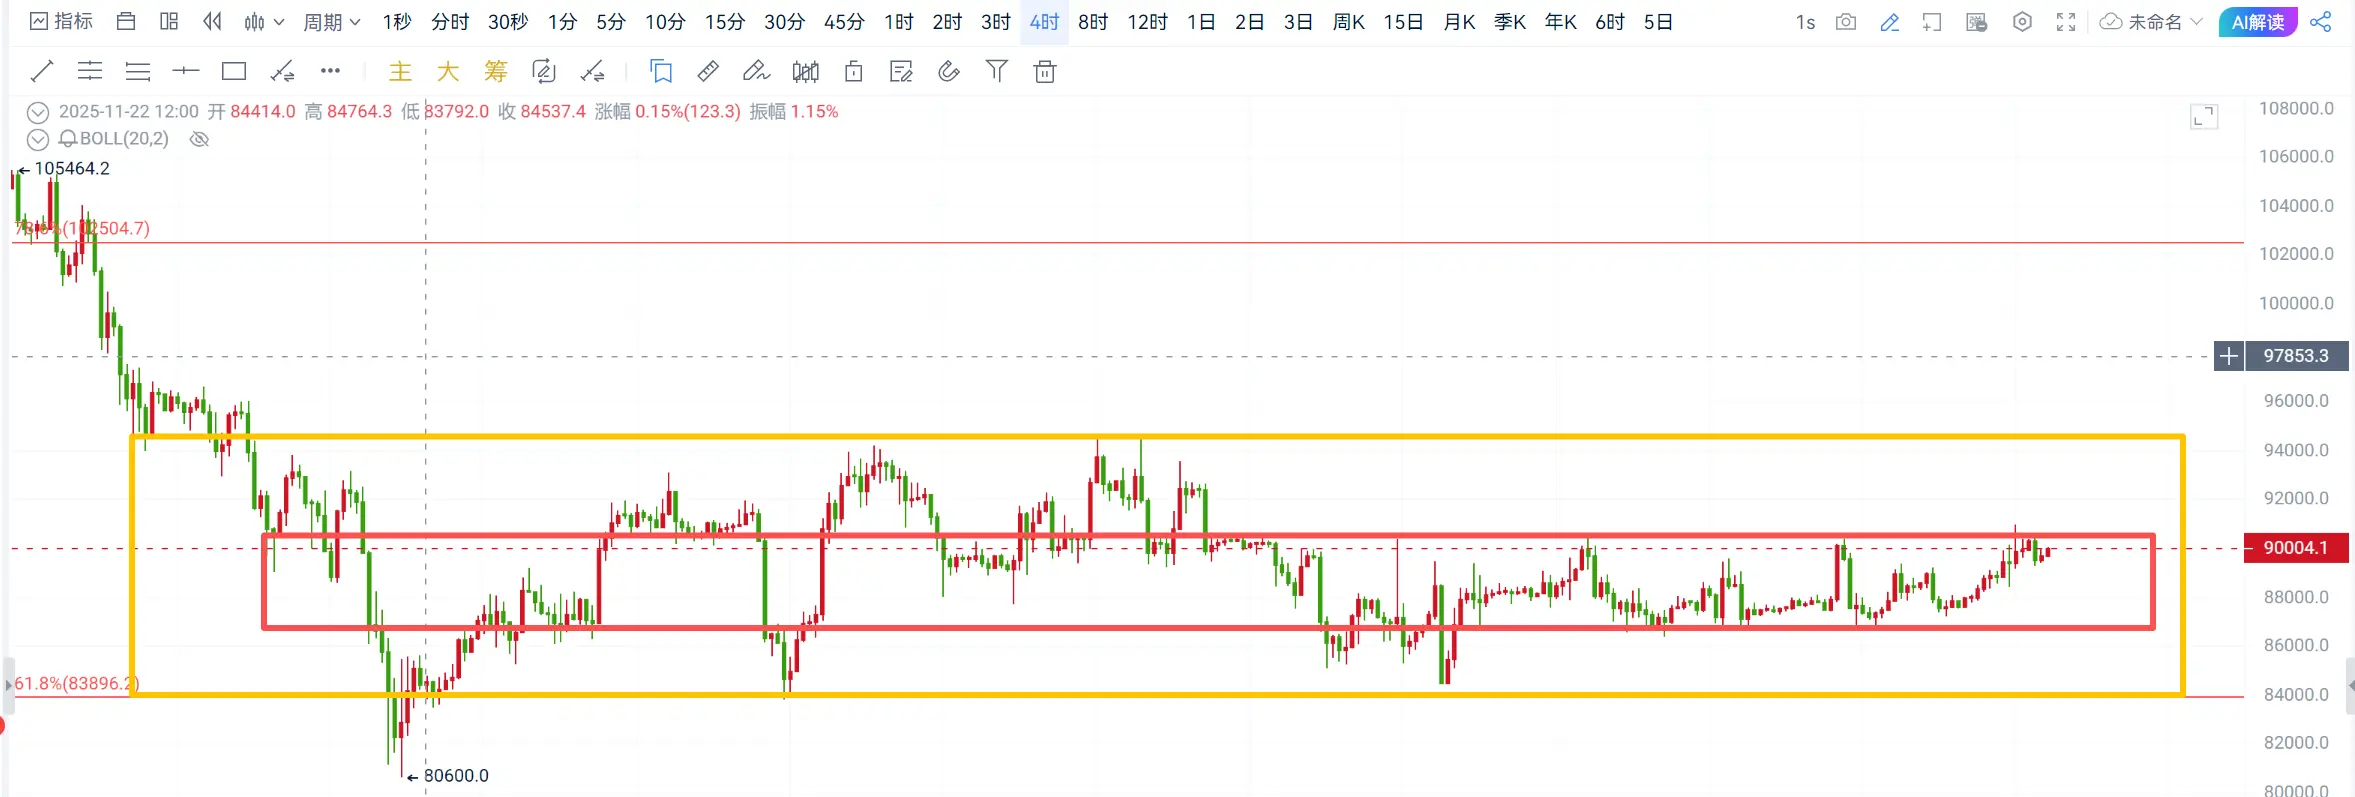
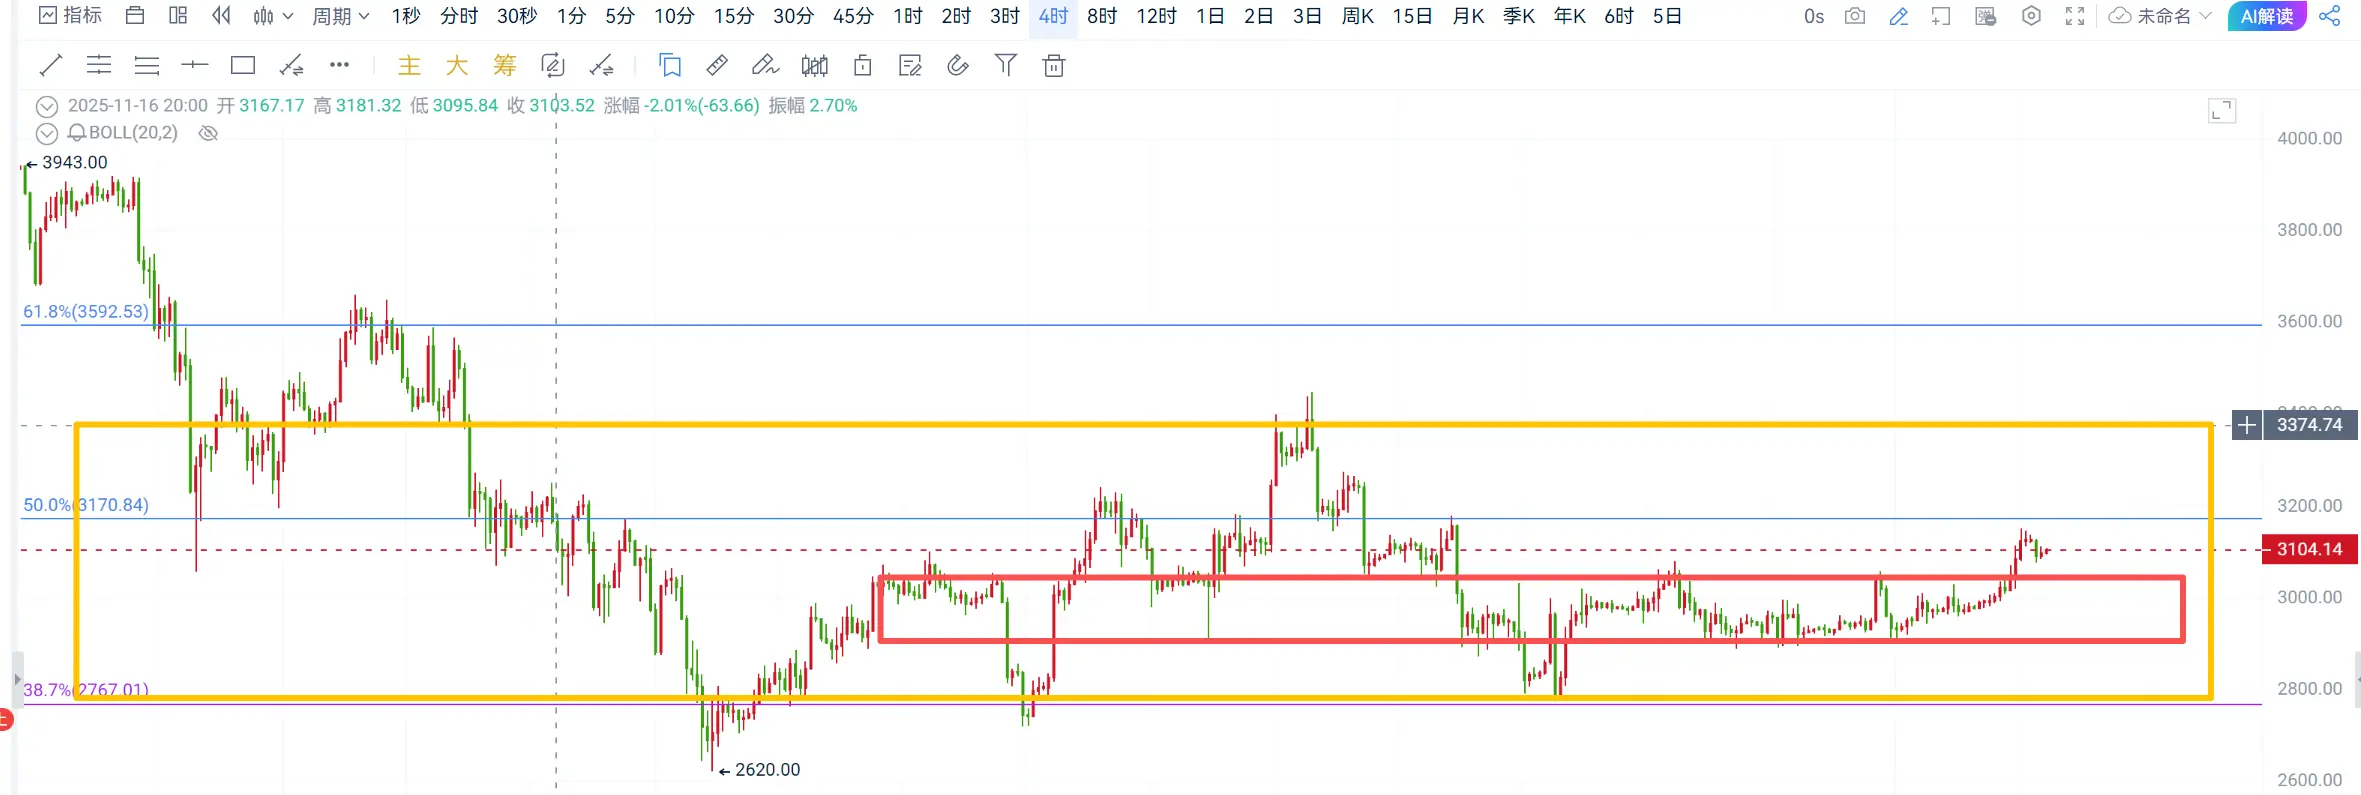
Daily chart: Bitcoin has two consecutive bullish days, rising to the 90,000 level. It is still in the lower half of the box structure, with the top at 94,500 and the bottom at 84,500. Currently, it is testing the middle resistance level, showing signs of continuing upward breakout! Ethereum also has two consecutive bullish days, rising to around 3,130. It has broken below the lower half of the box, with the top at 3,320 and the bottom at 2,770. The middle resistance is around 3,030. As previously mentioned, a breakout could lead to a rally towards 3,230!
4-hour chart: Bitcoin shows signs of up
View Original4-hour chart: Bitcoin shows signs of up
- Reward
- 5
- 3
- 1
- Share
TheHighestGoodIsLike :
:
View More
- Reward
- like
- Comment
- Repost
- Share
The emergence of CodeXero marks a significant innovation in the product form of decentralized application development tools. It pioneers an on-chain development process that combines natural language prompts with automated deployment.
Through @codexero_xyz, users can intuitively describe their ideas with prompts on Sei Network, and the platform automatically generates smart contracts and front-end components to complete deployment. This rapid iteration process from concept to production-level dApp greatly lowers the entry barrier and shortens the product landing cycle.
In traditional blockchai
SEI3,87%

- Reward
- like
- Comment
- Repost
- Share
#GateCEO2025YearEndOpenLetter: 2026 Crypto Market Outlook – From Resilience to Strategic Execution
As we close the chapter on 2025 and enter 2026, the cryptocurrency ecosystem is no longer in a phase of trial and reaction. The market has moved beyond questions of possibility and is now defined by execution, infrastructure maturation, and selective capital allocation. The past two years tested the resilience of projects, communities, and investors, filtering out speculative excesses and revealing the protocols and initiatives built to last.
Bitcoin: Beyond Digital Gold, Toward a Macro-Financial
- Reward
- 11
- 13
- Repost
- Share
repanzal :
:
Buy To Earn 💎View More

#DoubleRewardsWithGUSD How Stable Assets and Yield Launchpool Are Reshaping Crypto Income Strategies (2025–2026)
As the crypto market advances further into maturity, generating income is no longer defined solely by passive holding or aggressive trading. The 2025–2026 cycle is increasingly built on capital efficiency, sustainable yields, and structured participation models. In this environment, stablecoins have evolved from mere capital buffers to drivers of predictable income, based on strategic frameworks.
This shift reflects a broader transformation in digital finance: markets are rewarding
View OriginalAs the crypto market advances further into maturity, generating income is no longer defined solely by passive holding or aggressive trading. The 2025–2026 cycle is increasingly built on capital efficiency, sustainable yields, and structured participation models. In this environment, stablecoins have evolved from mere capital buffers to drivers of predictable income, based on strategic frameworks.
This shift reflects a broader transformation in digital finance: markets are rewarding

- Reward
- 4
- Comment
- Repost
- Share
Reflect on this year's crypto journey—from market surges to bold moves, every step is worth remembering. Check your #2025Gate年度账单 now, relive your 2025 crypto journey with Gate, and share to receive 20 USDT. https://www.gate.com/zh/competition/your-year-in-review-2025?ref=UFlNVF0&ref_type=126&shareUid=U1hHXV1b
View Original
- Reward
- like
- Comment
- Repost
- Share
- Reward
- 1
- 3
- Repost
- Share
HighAmbition:
Happy New Year! 🤑View More
hi I'm xenox new to the community can u help me to find best coin or to find hidden gems coin if u can pls msg me thank you everyone


- Reward
- like
- Comment
- Repost
- Share
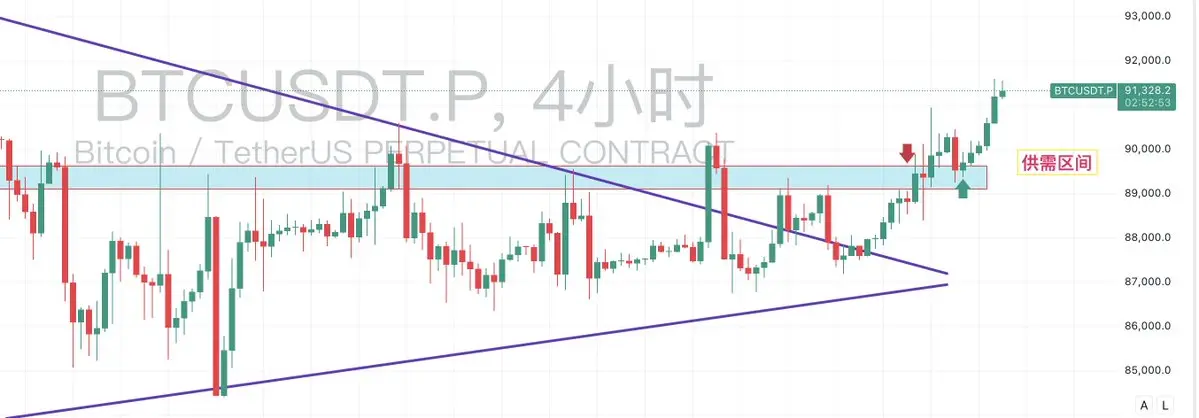
Market Analysis: $BTC (2026-1-4)
Yesterday, the four-hour level pullback below the supply and demand support level. I was planning to go long after the four-hour close, but I got carried away by "Xian Ni" and kept watching, forgot to monitor the market 😂
Currently, in the short term, there is indeed no need for a pullback. The more daring can try to chase the long positions, while the conservative traders should hold off for now.
Overall, the daily level is beginning to show a rebound trend, and the rebound strength will also be quite significant 📈
BTC1,43%
- Reward
- like
- Comment
- Repost
- Share
You buy, or don't buy GM
GM is right there, neither sad nor happy
You think of, or don't think of GM
Love is right there, neither coming nor going
You love, or don't love GM
Love is right there, neither increasing nor decreasing
You follow, or don't follow GM
GM's hand is in your hand, never abandoning or giving up
Come into GM's embrace, or let GM settle into your heart
Silent love, quiet joy
View OriginalGM is right there, neither sad nor happy
You think of, or don't think of GM
Love is right there, neither coming nor going
You love, or don't love GM
Love is right there, neither increasing nor decreasing
You follow, or don't follow GM
GM's hand is in your hand, never abandoning or giving up
Come into GM's embrace, or let GM settle into your heart
Silent love, quiet joy
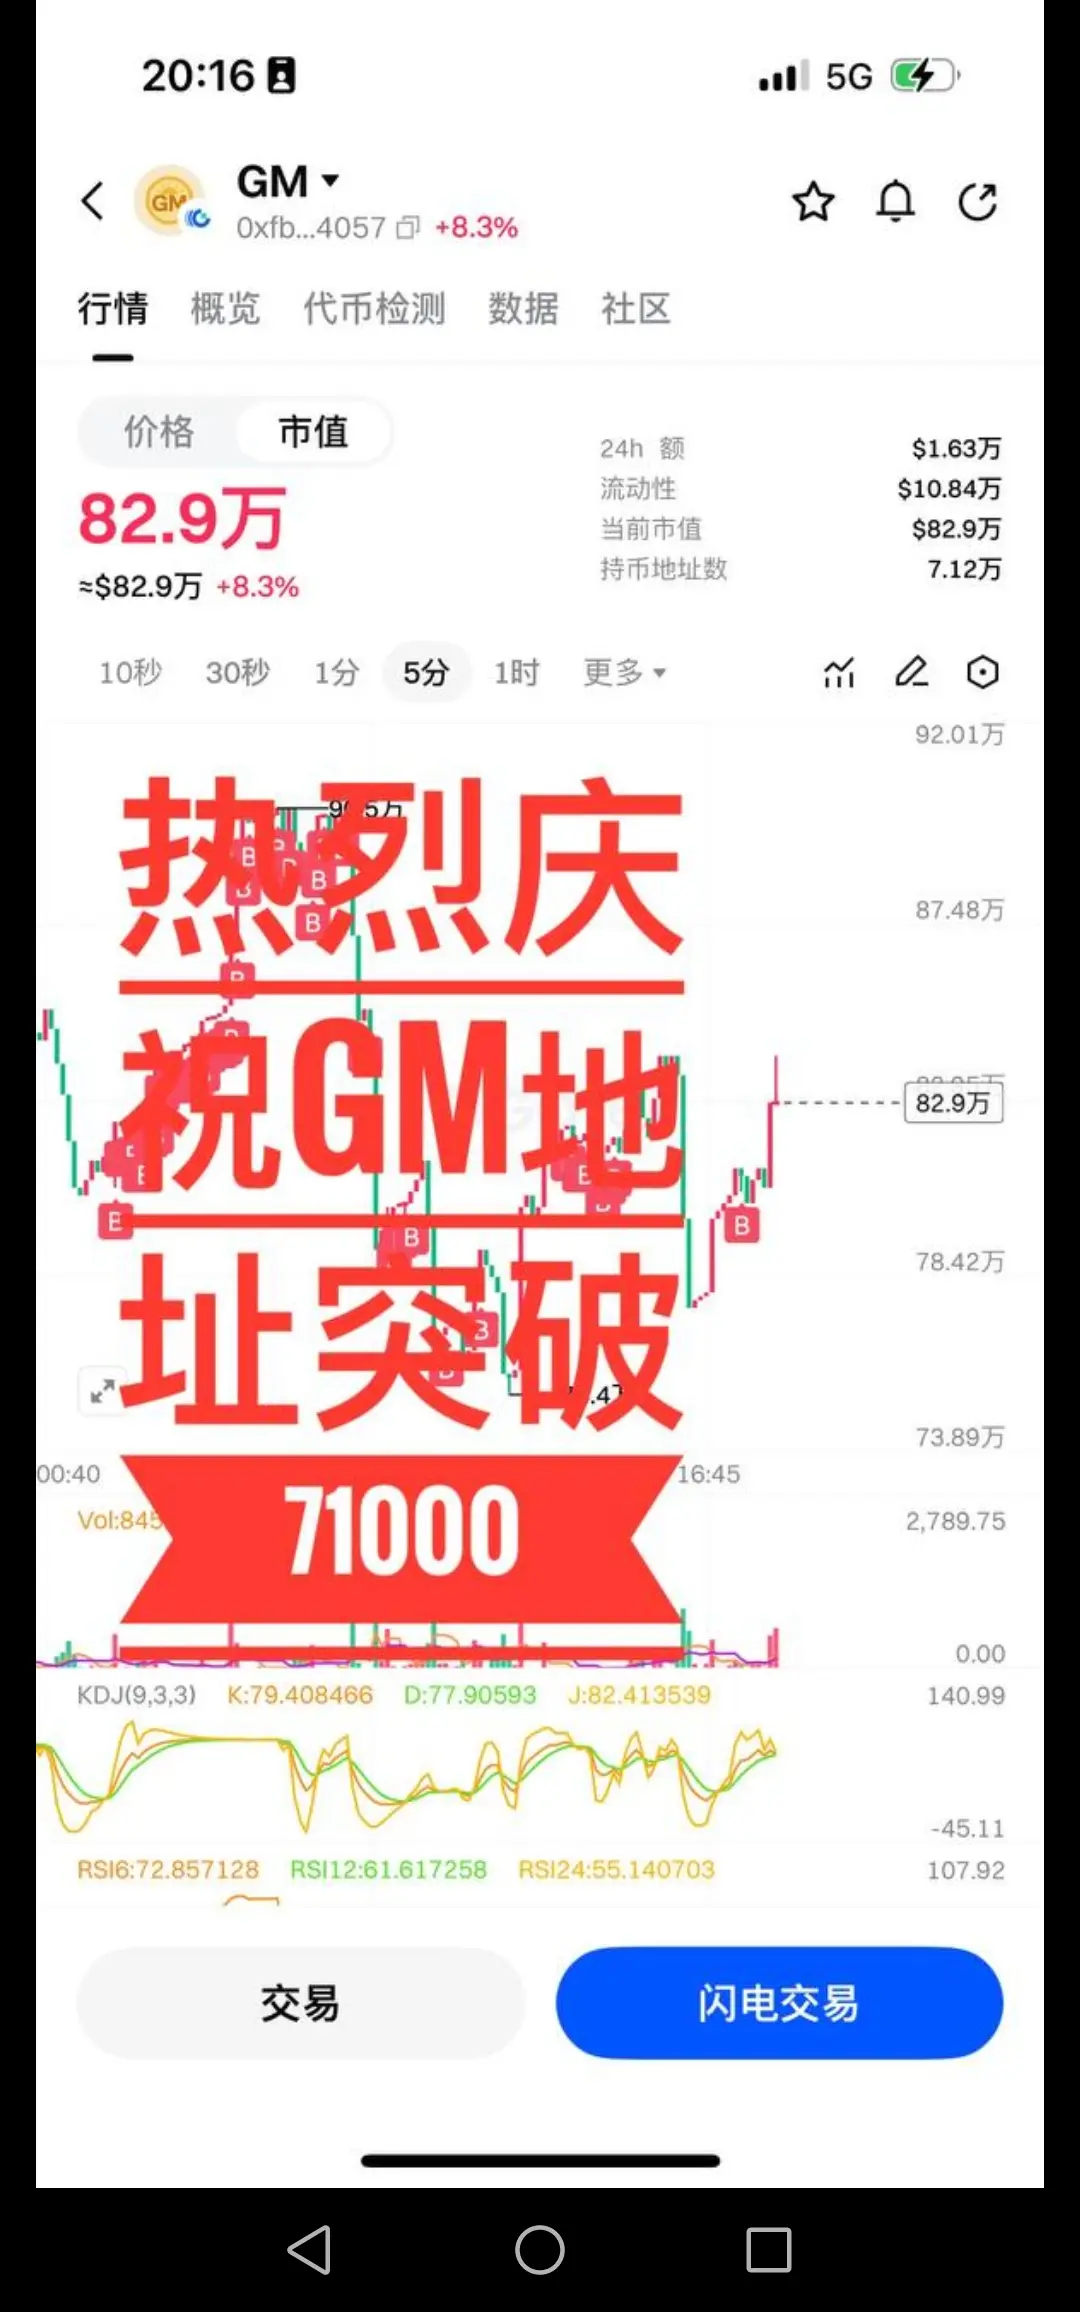

MC:$784.68KHolders:71695
100.00%
- Reward
- 7
- 1
- Repost
- Share
董姐GM :
:
$ETH
Strong bounce from major intraday support — sellers exhausted, base forming.
Buy Zone: 3,080 – 3,110
TP1: 3,150
TP2: 3,220
TP3: 3,300
Stop: 3,040
Smart money defense spotted — ETH gearing up for continuation 🔥🚀
#GateCEO2025YearEndOpenLetter #My2026FirstPost #CryptoMarketPrediction #ETFLeveragedTokenTradingCarnival #2025GateYearEndSummary
ETH0,9%

- Reward
- 1
- 1
- Repost
- Share
GateUser-e0b574d4:
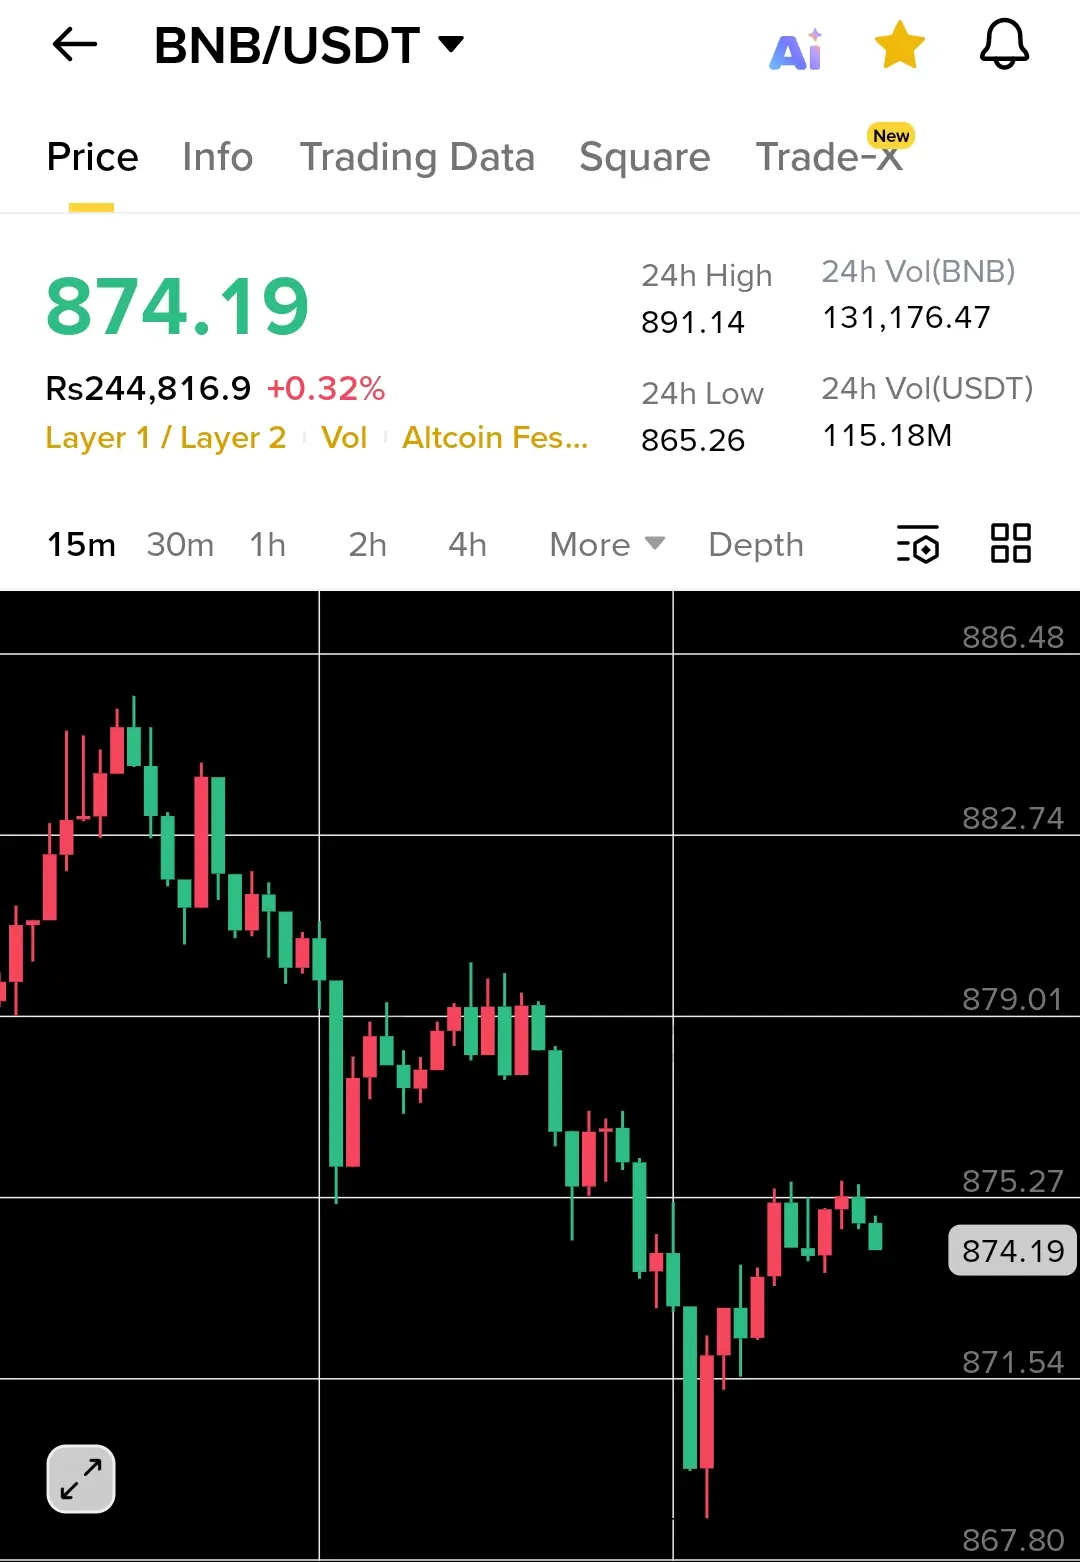
2026 Go Go Go 👊$BNB now. Price is near 874 after a slow drop. I see weak strength and small bounces. I'm not entering yet. I will wait for solid support and clear trend change. Staying patient helps me avoid bad trades.
#AreYouBullishOrBearishToday? #ETHTrendWatch
#AreYouBullishOrBearishToday? #ETHTrendWatch
BNB2,75%
- Reward
- like
- Comment
- Repost
- Share

- Reward
- like
- Comment
- Repost
- Share
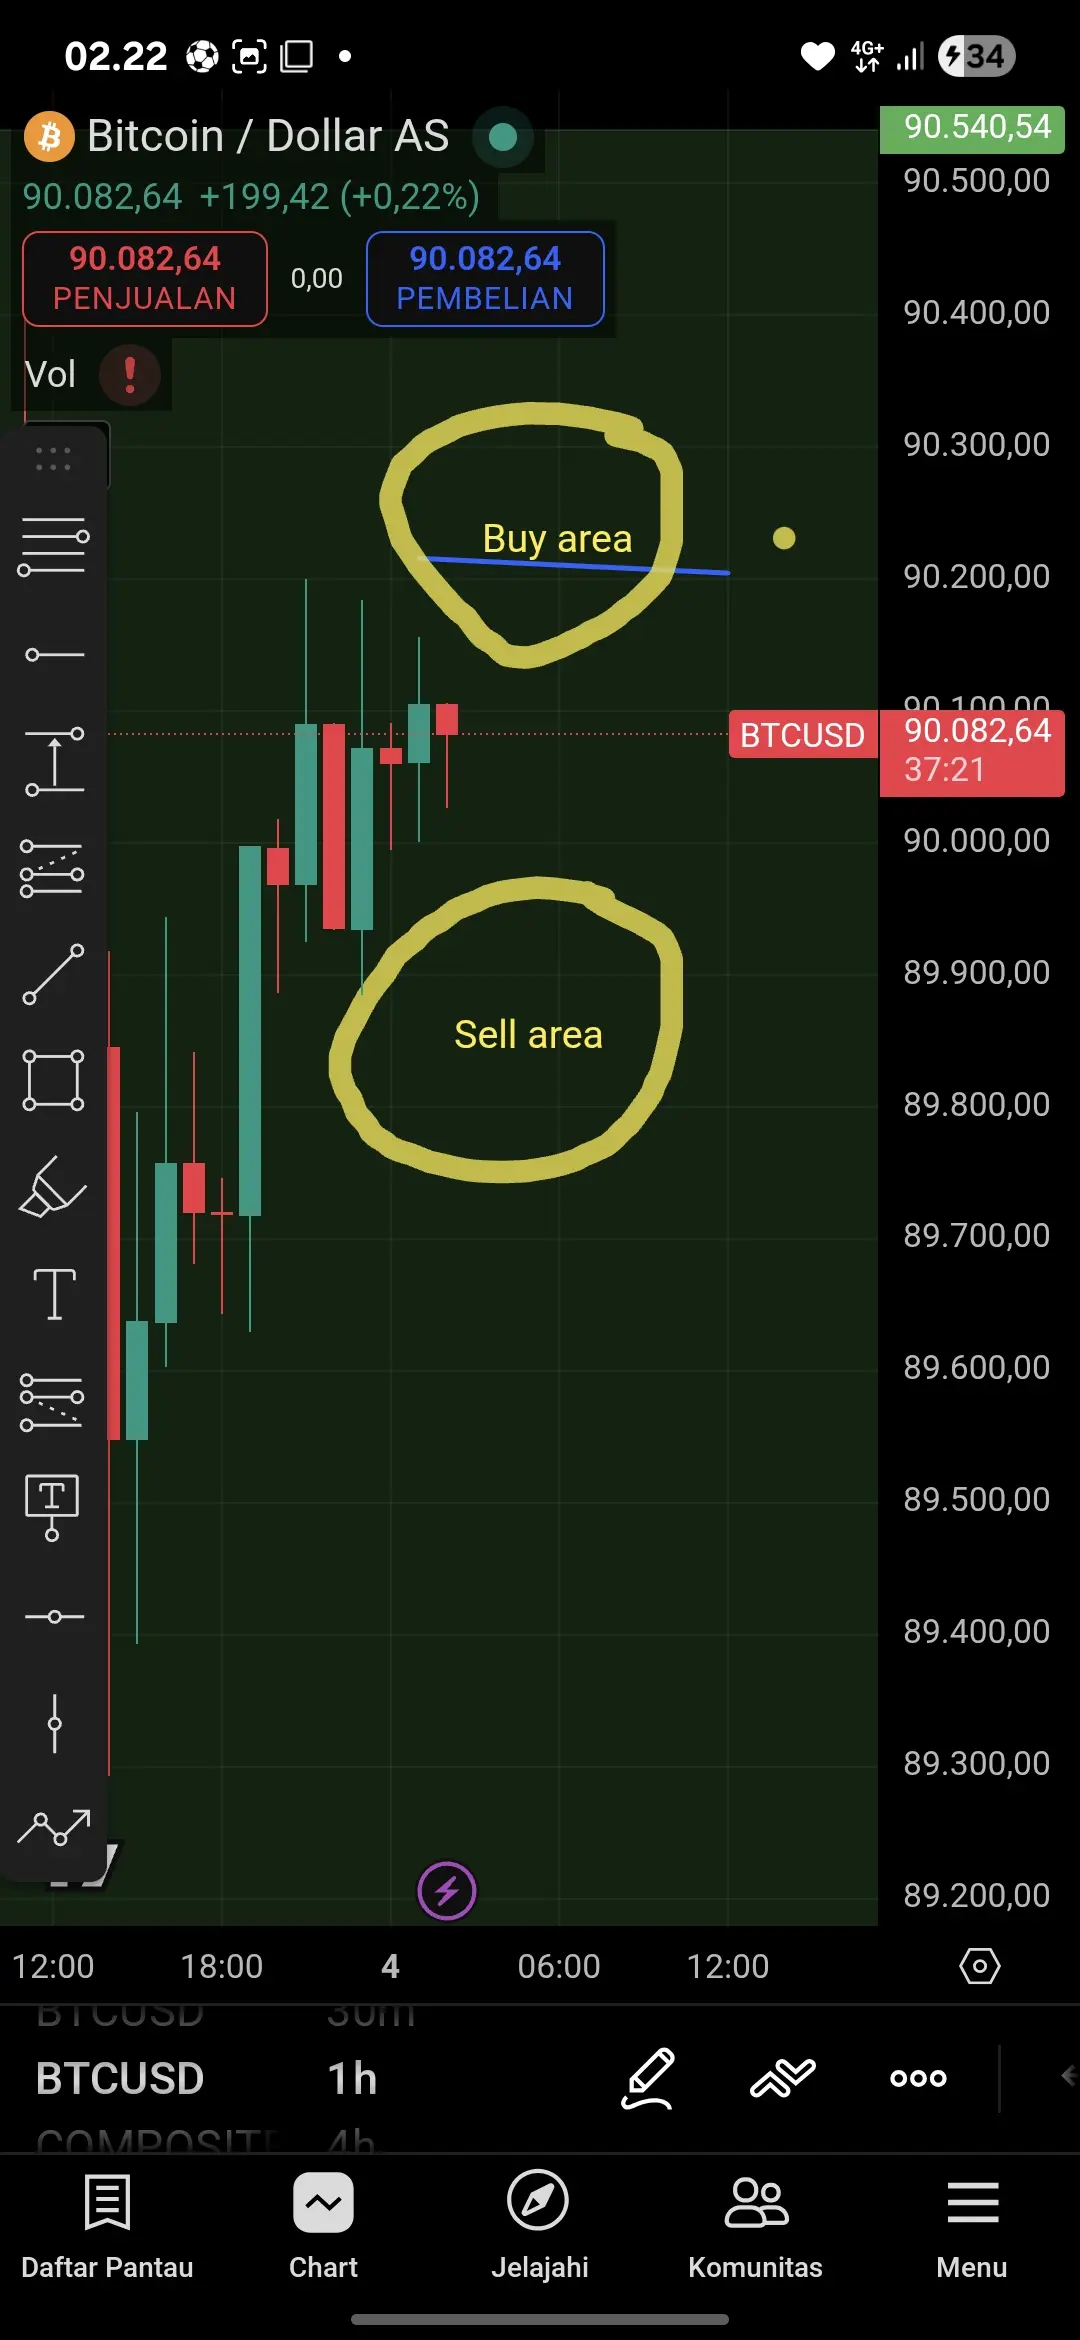
Pay attention to the current BTC condition, based on the conflict between Venezuela and America. For now, BTC is in a SIDEWAY position. What should we do? Wait for information about China's response to this situation, then the Bitcoin price will go down(bearish). As long as China hasn't responded, it remains SIDEWAYS. Wait for my next update🌏. Follow the developments with me#My2026FirstPost #GoldPrintsNewATH
BTC1,43%

- Reward
- 1
- Comment
- Repost
- Share
Load More
Join 40M users in our growing community
⚡️ Join 40M users in the crypto craze discussion
💬 Engage with your favorite top creators
👍 See what interests you
Trending Topics
View More12.2K Popularity
571.61K Popularity
68.83K Popularity
3.65K Popularity
3.82K Popularity
Hot Gate Fun
View More- MC:$3.71KHolders:20.00%
- MC:$3.63KHolders:10.00%
- MC:$3.63KHolders:10.00%
- MC:$3.62KHolders:10.00%
- MC:$3.63KHolders:20.00%
News
View Moreether.fi CEO: New crypto banks will drive Ethereum's growth to be achieved by 2026
2 h
The whale "pension-usdt.eth" has a short position size of $53 million in ETH, with an average price of $3,137.
2 h
Maji HYPE reduced the 10x long position to 98,000 tokens and increased the long position on ETH to 7,700 tokens.
2 h
JOJO increased by 61.67% after launching Alpha, current price is 0.0249 USDT
3 h
The top 100 publicly listed companies hold a total of 1,090,949 BTC, with only 5 companies increasing their BTC holdings in the past 7 days.
3 h
Pin