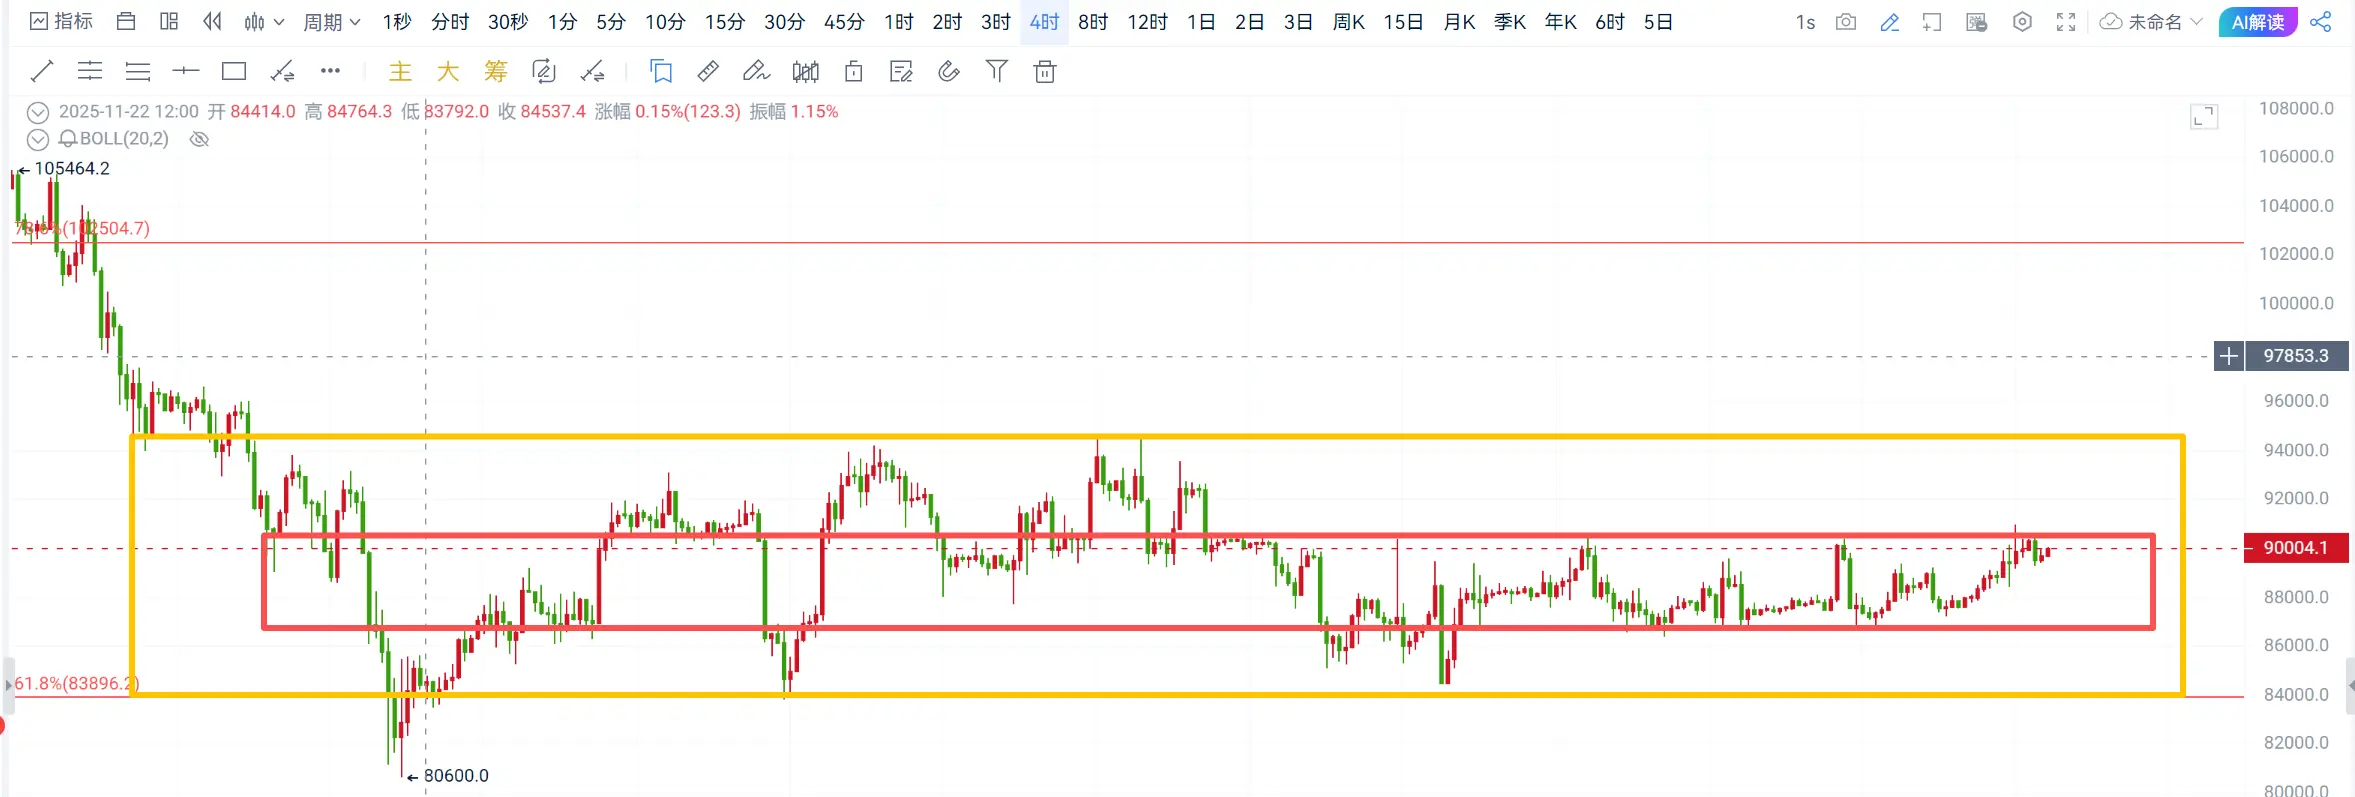
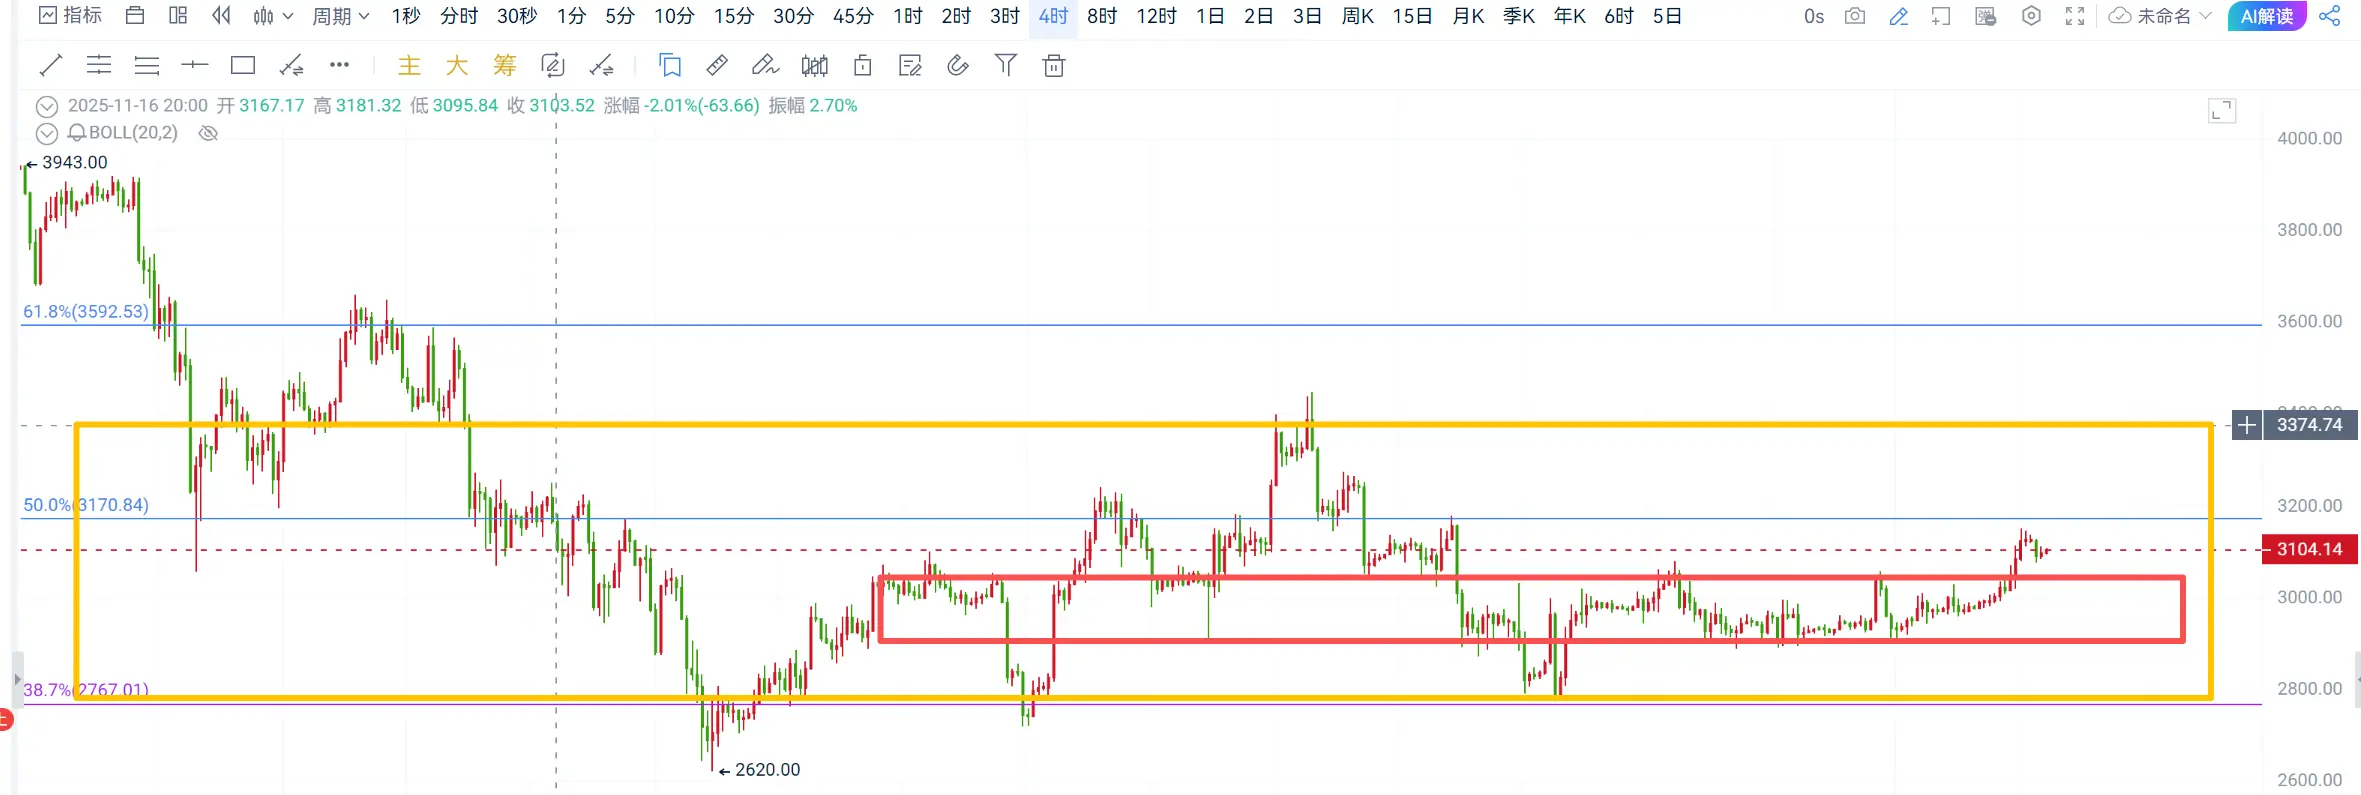
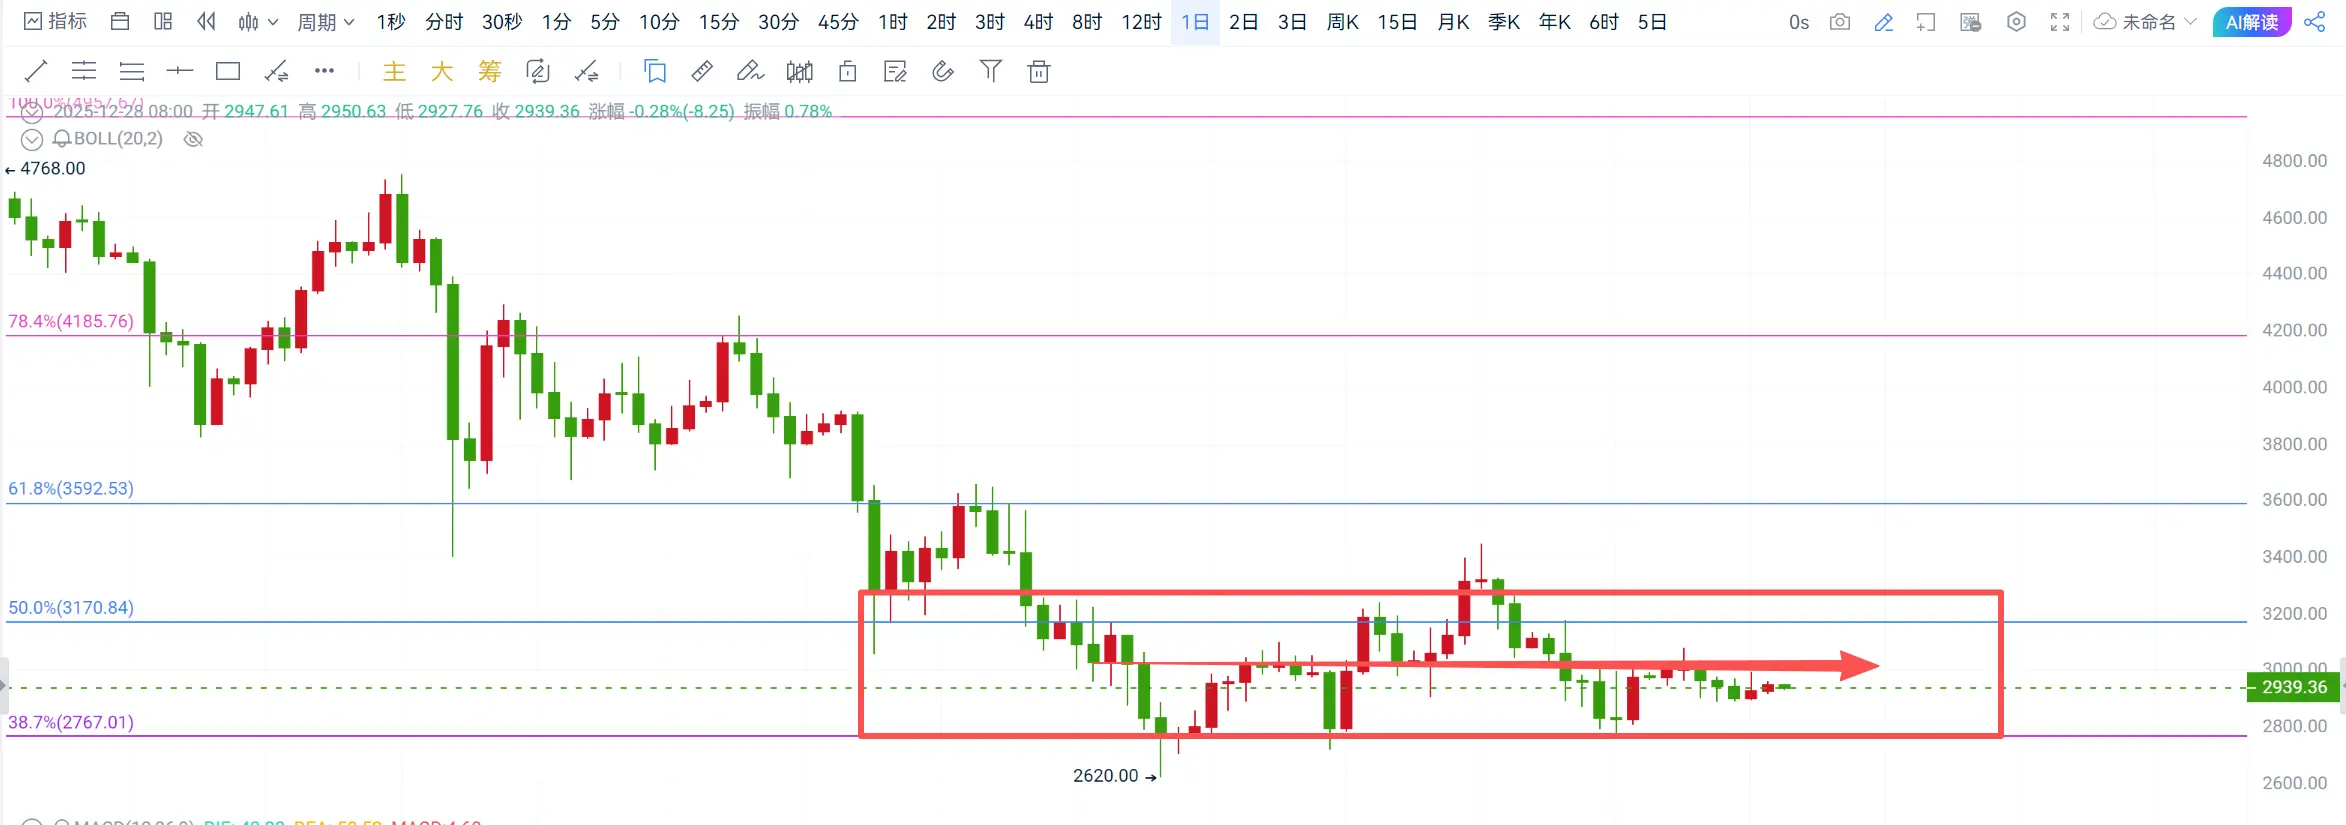
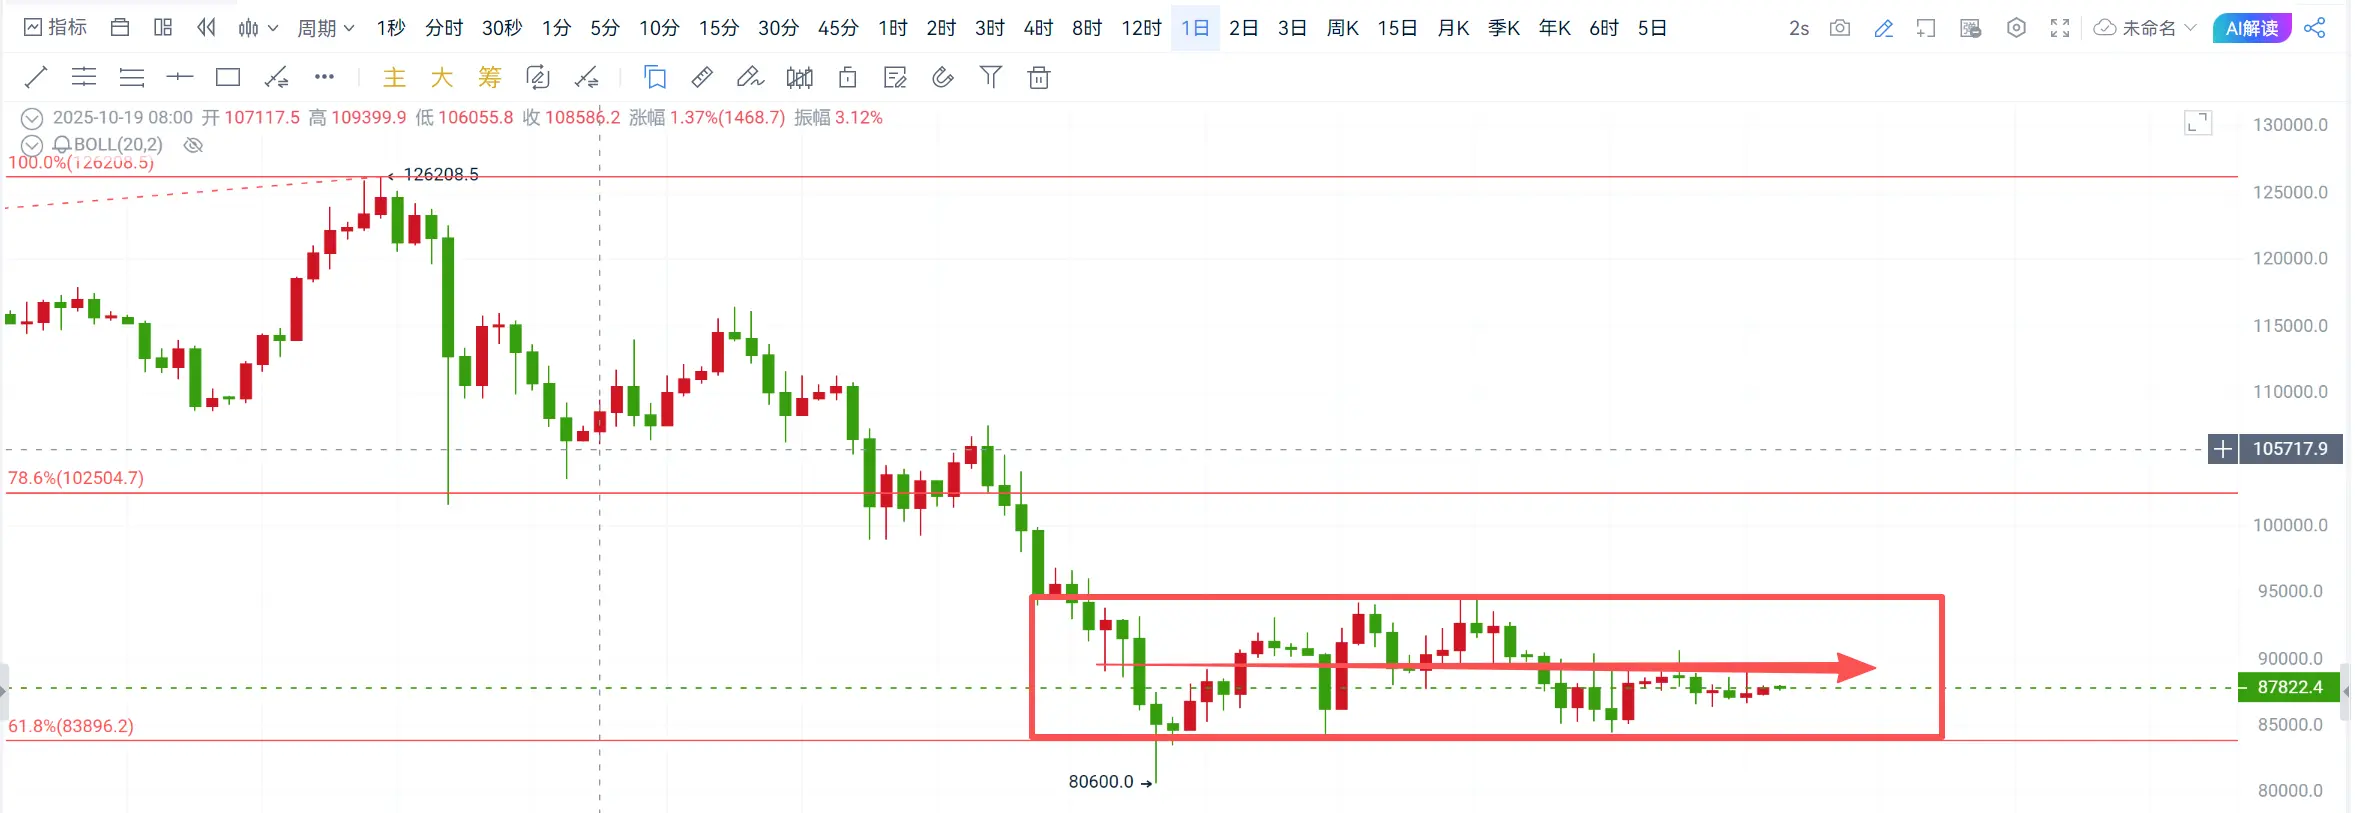
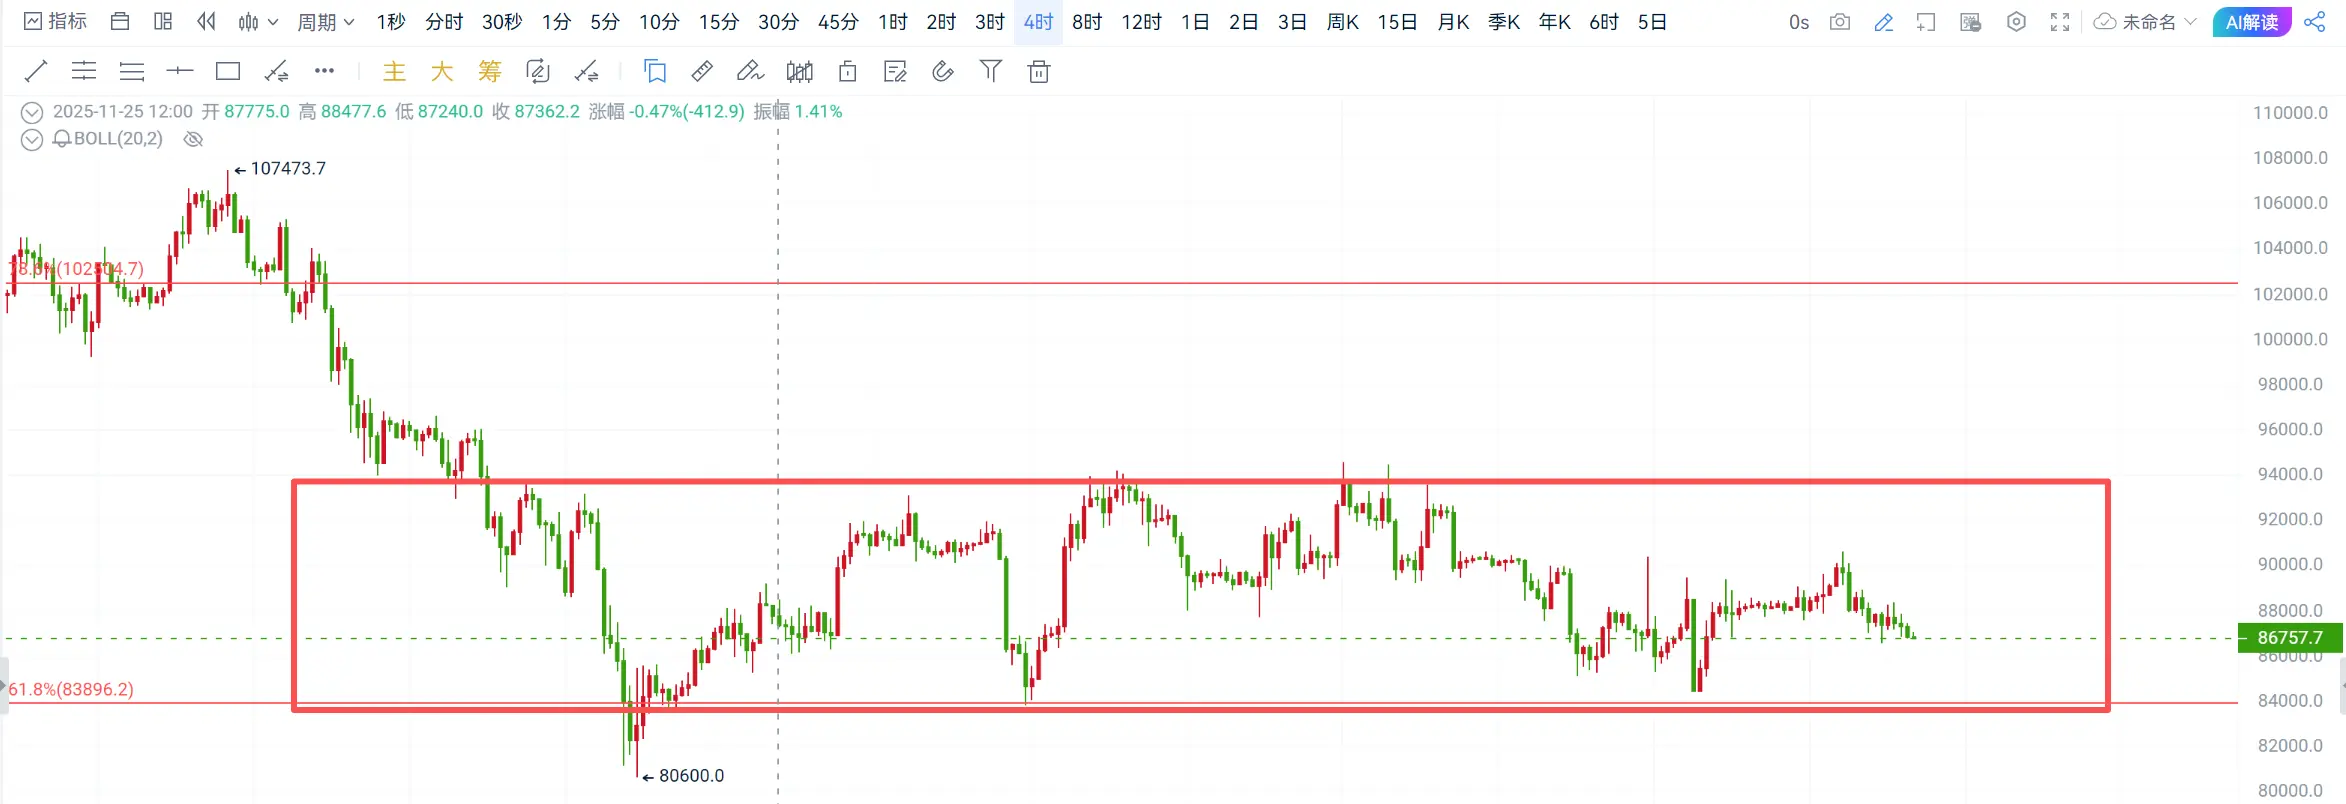
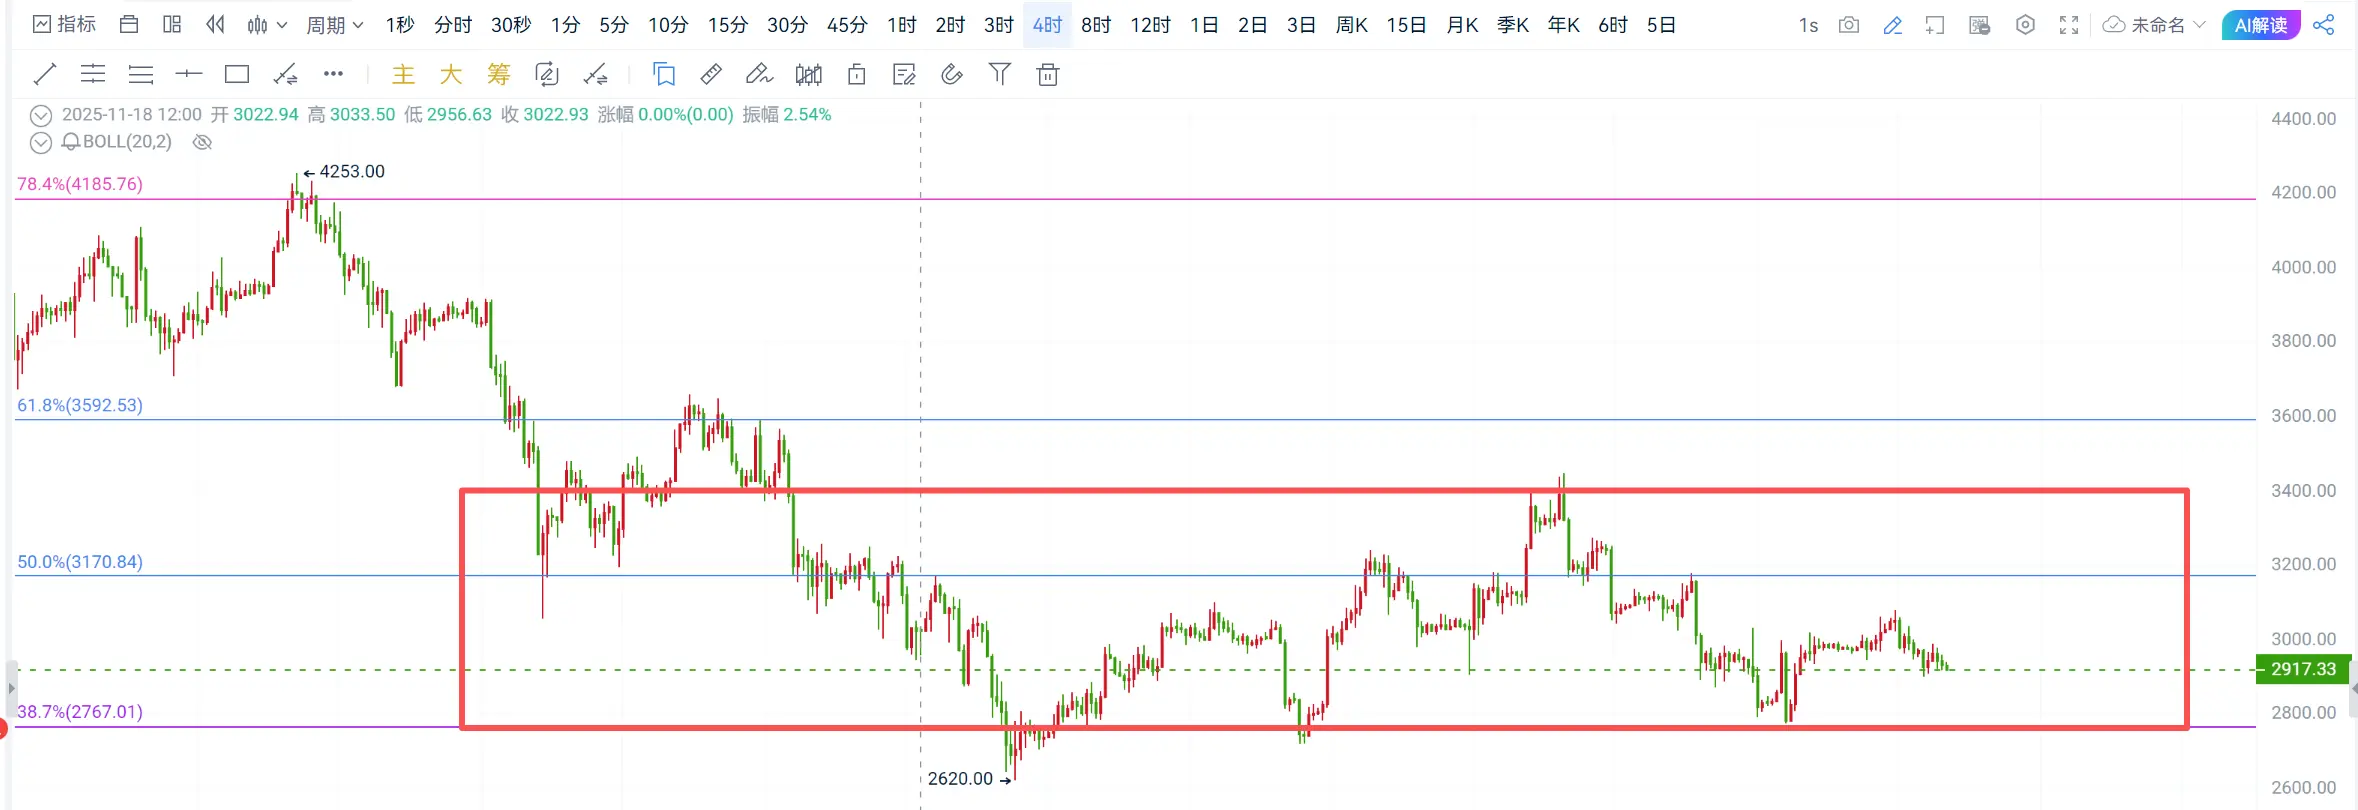
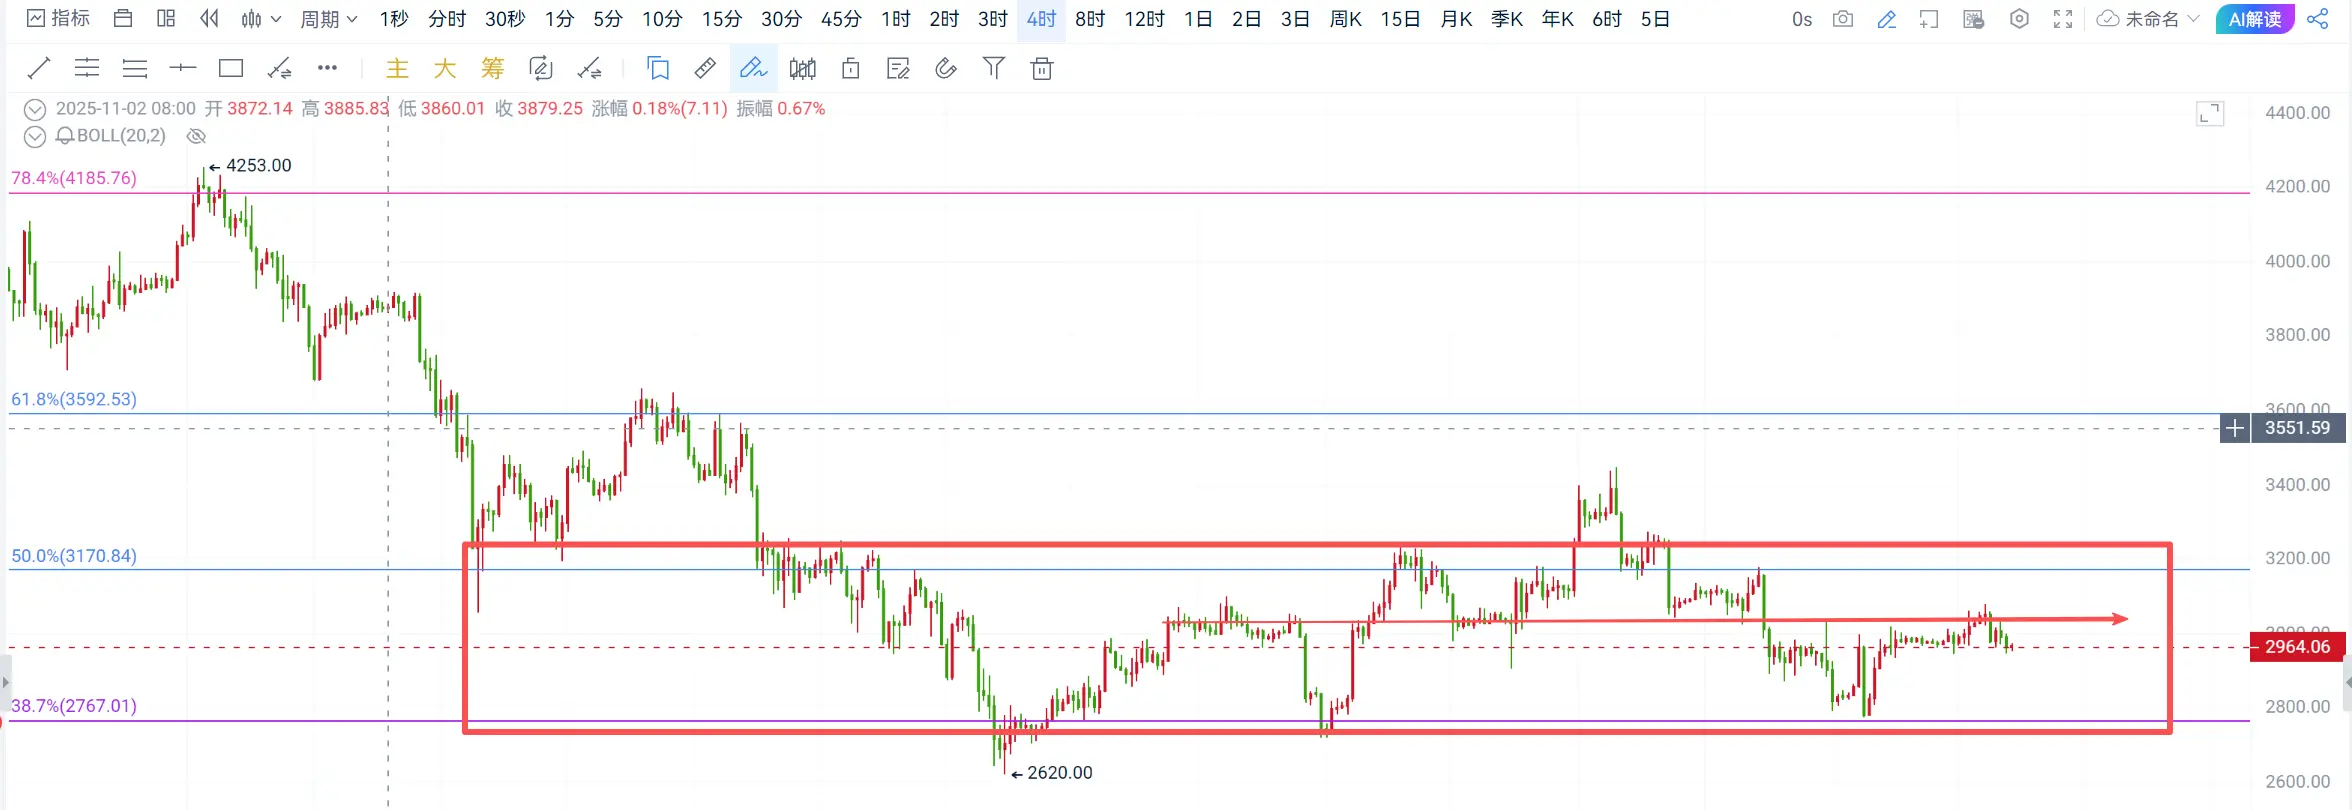
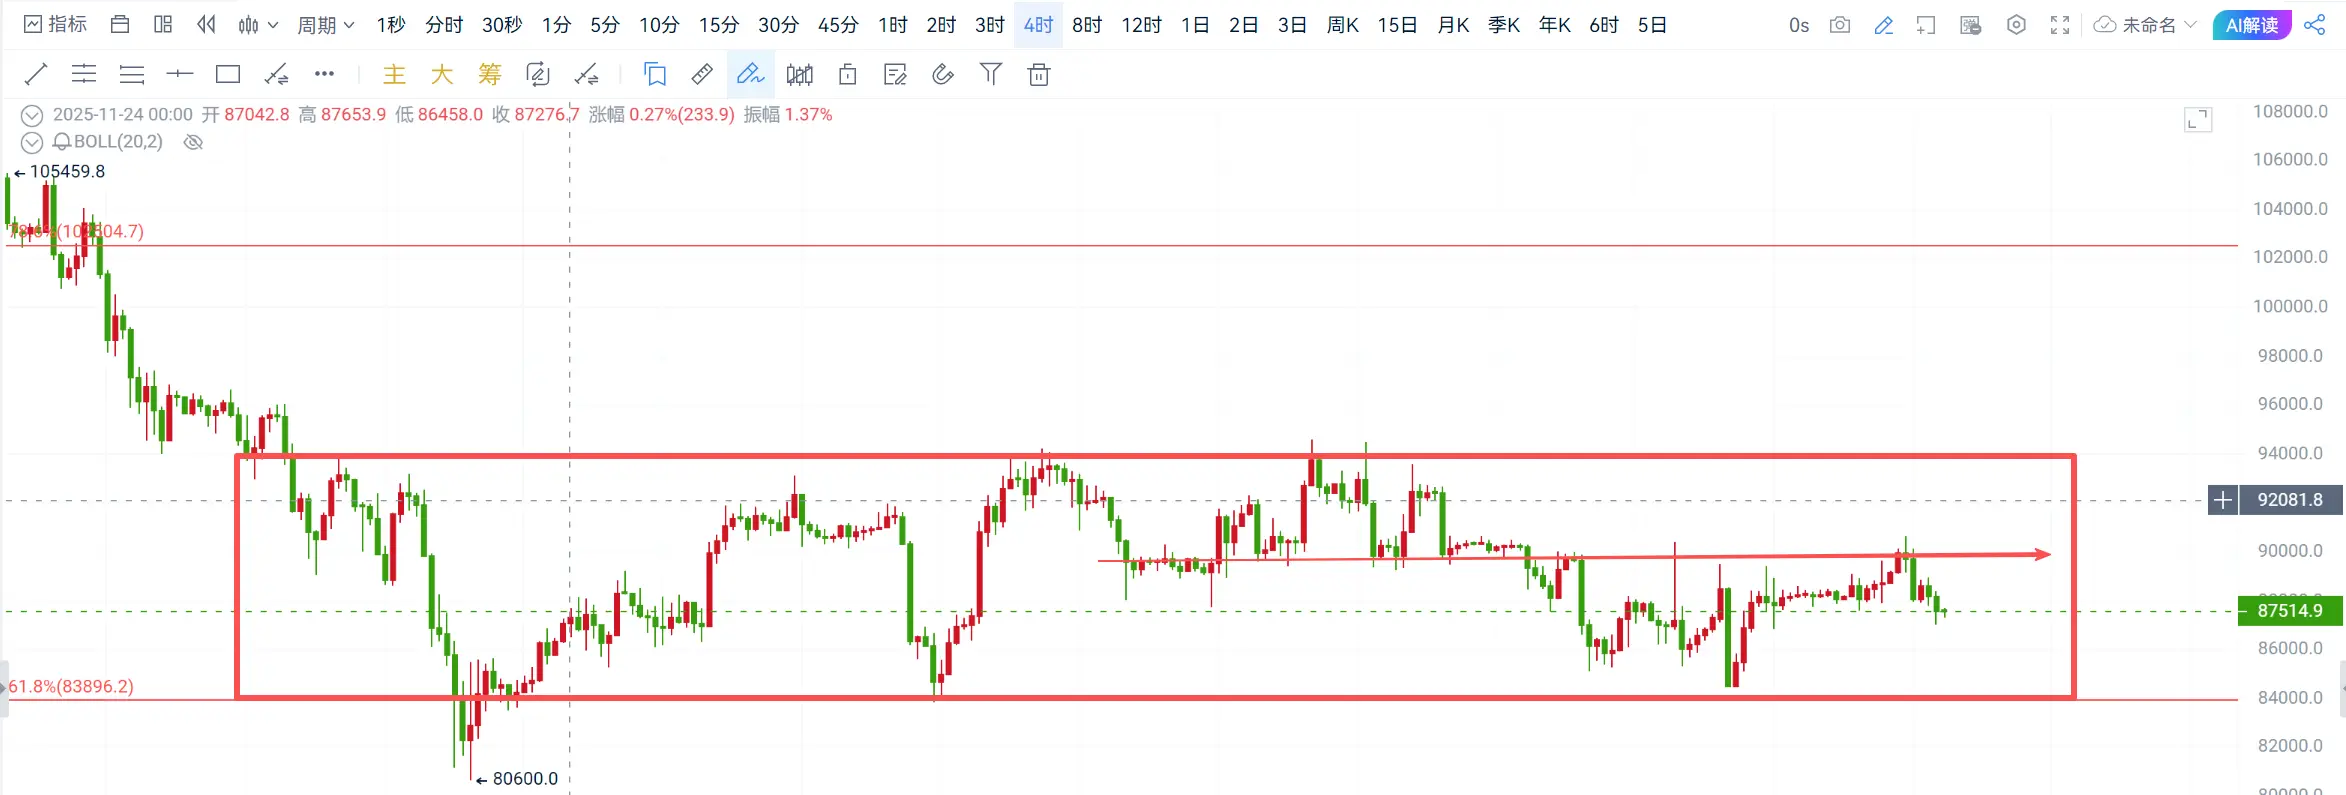
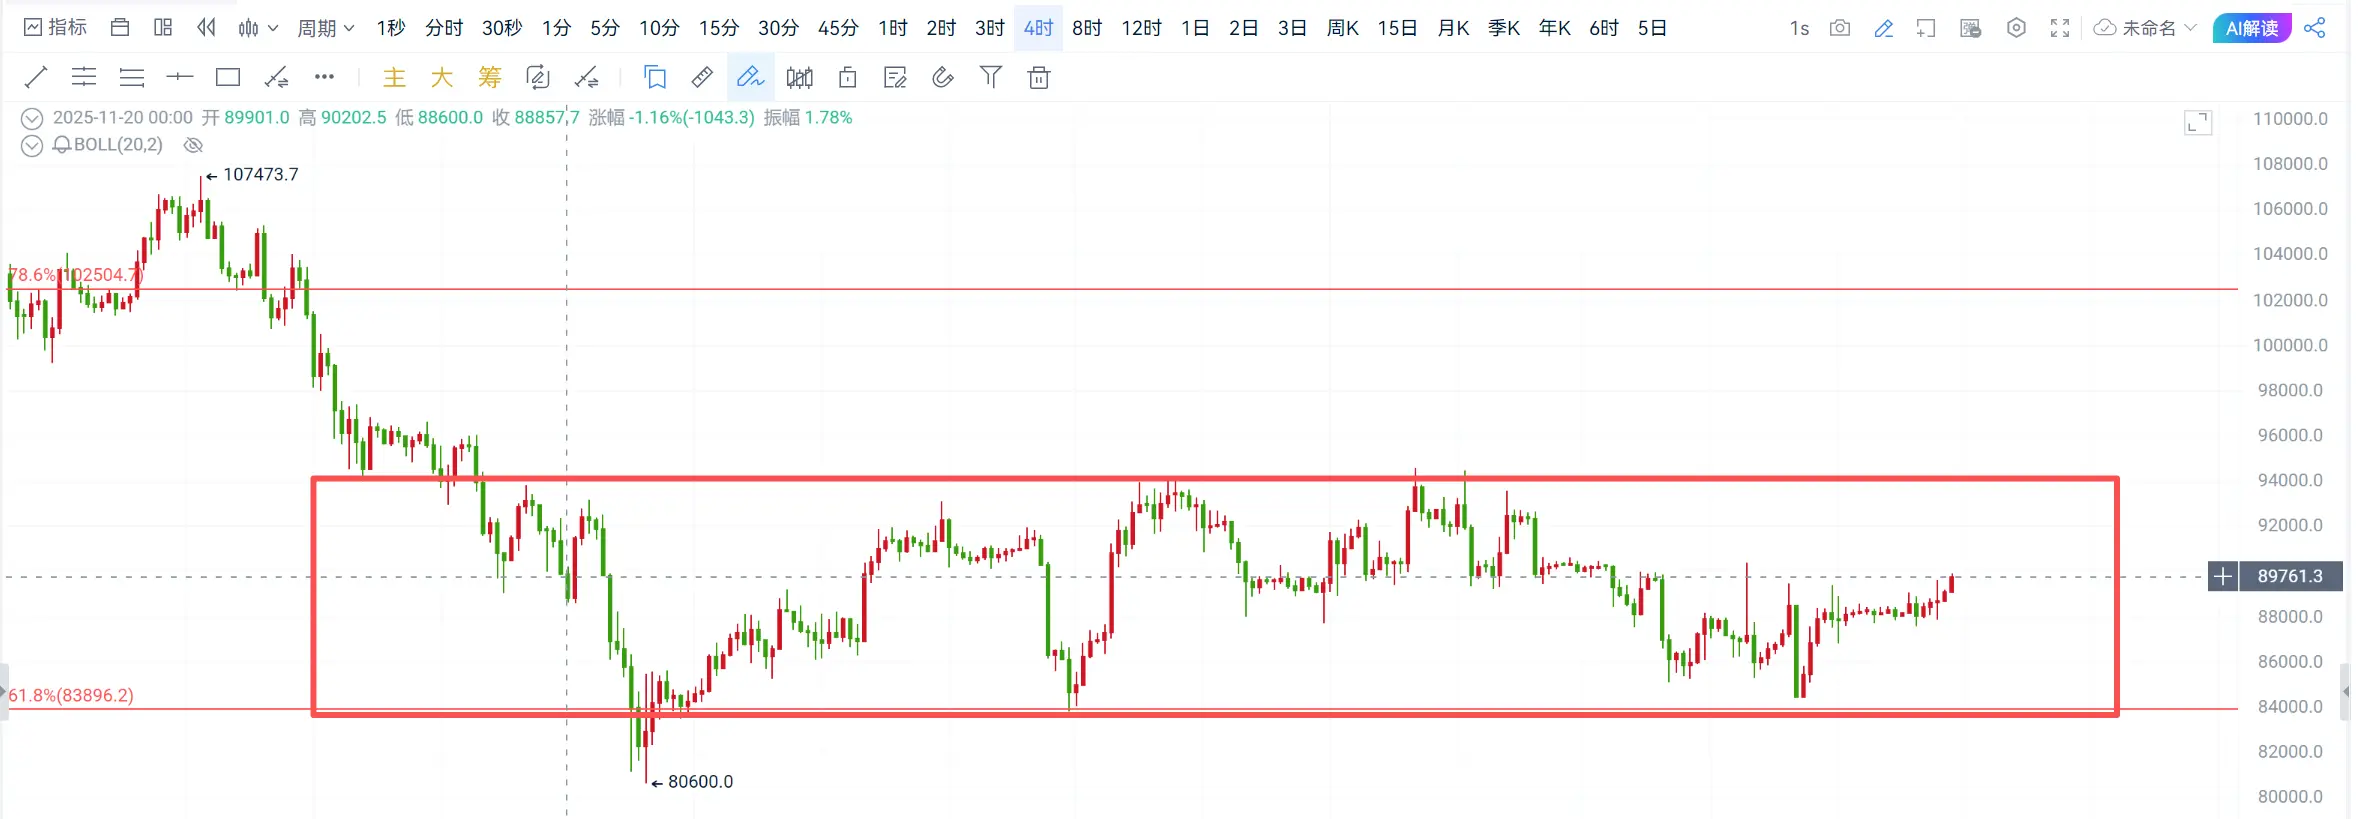
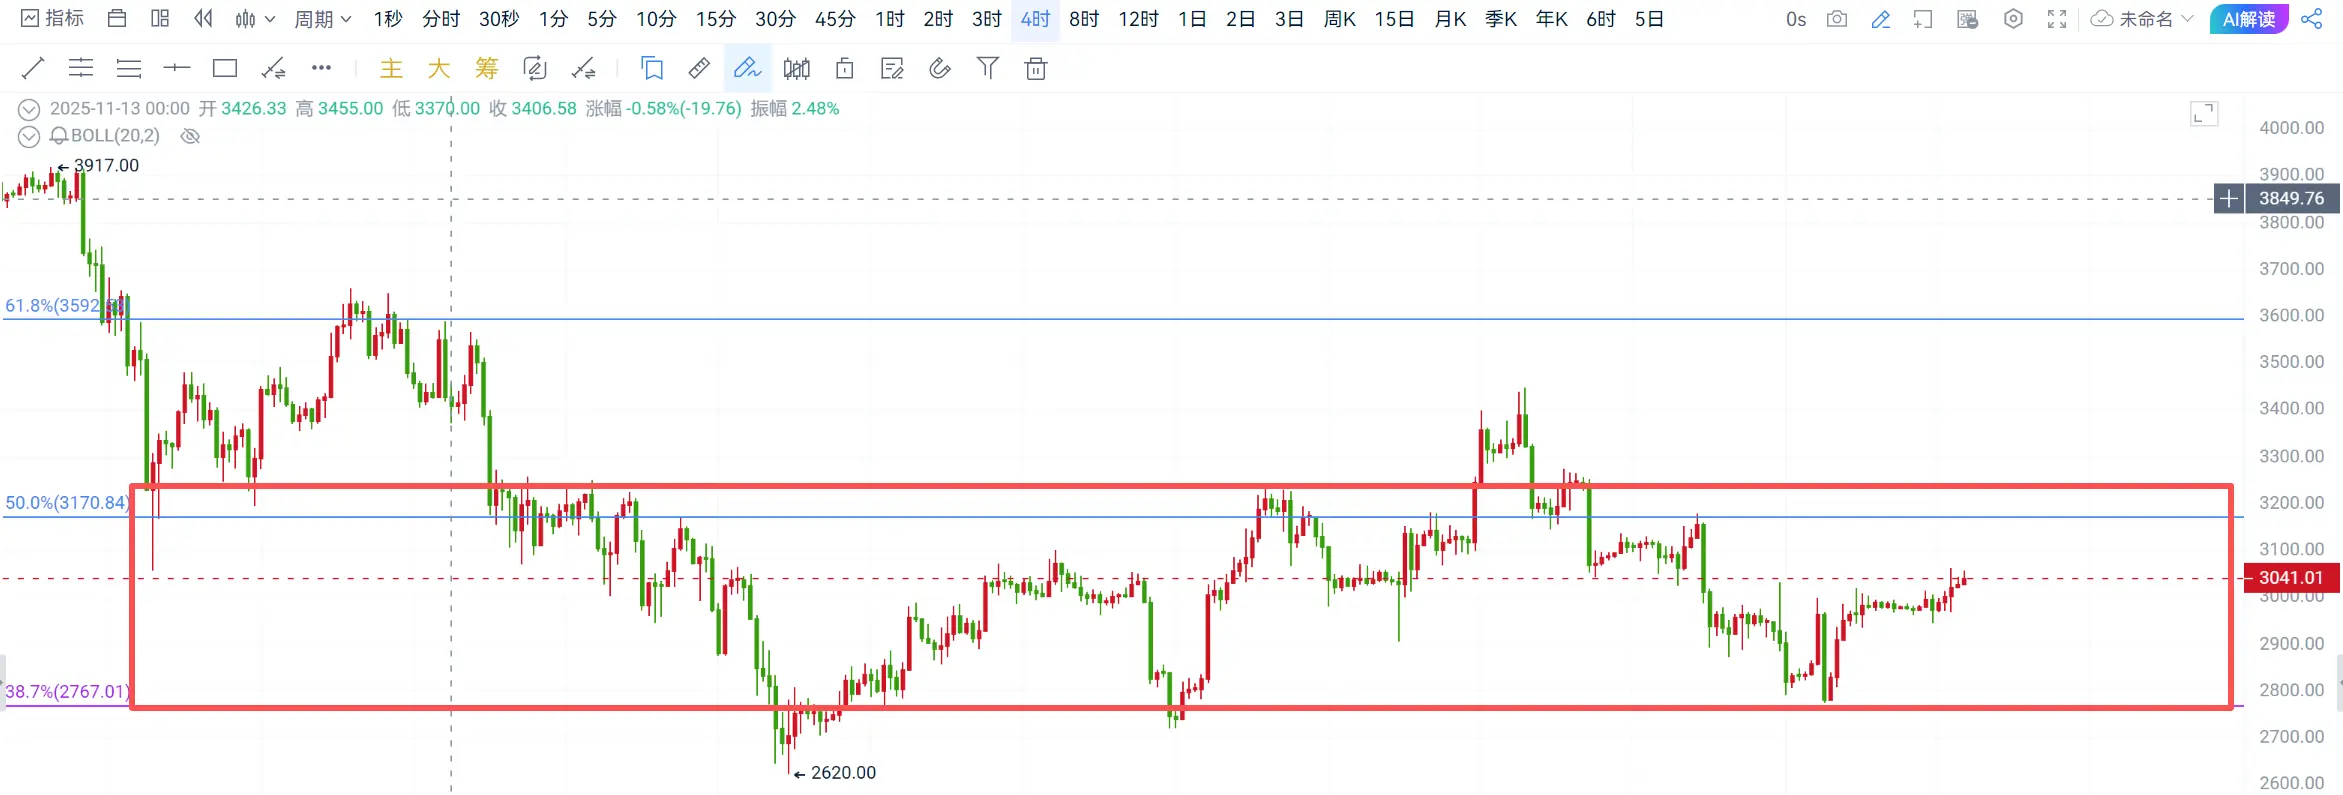
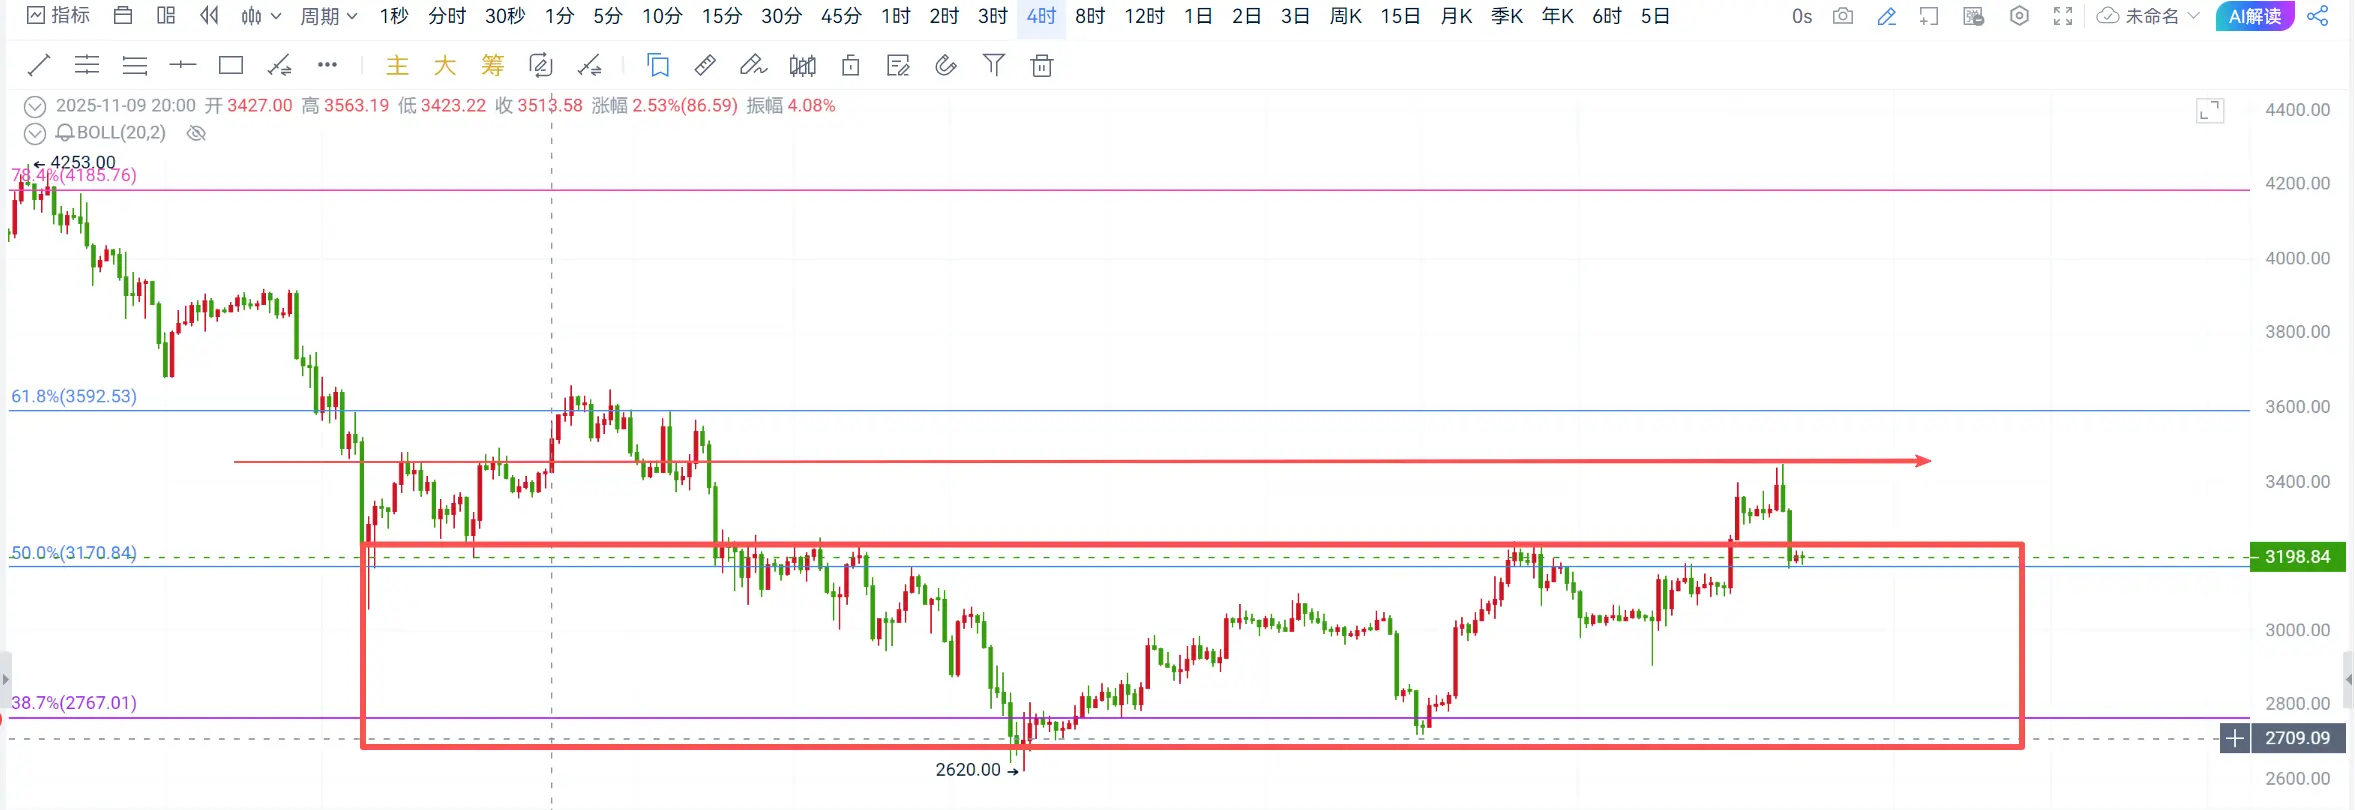
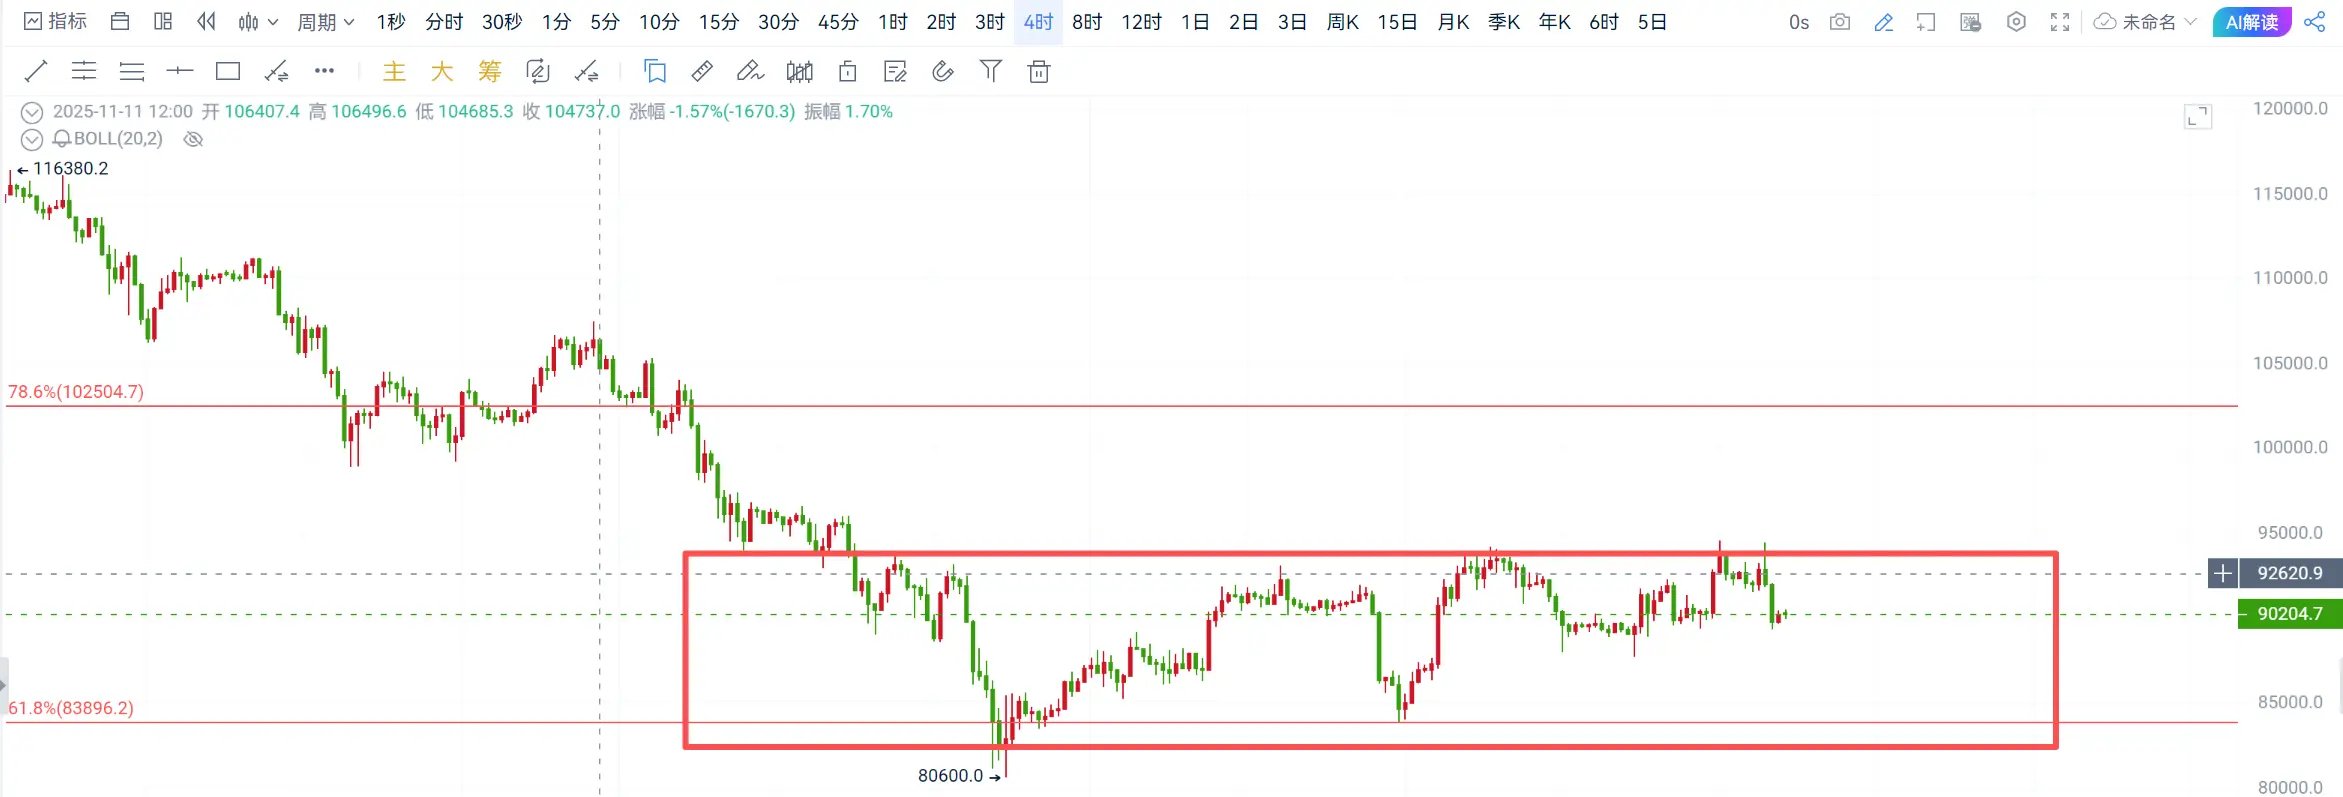
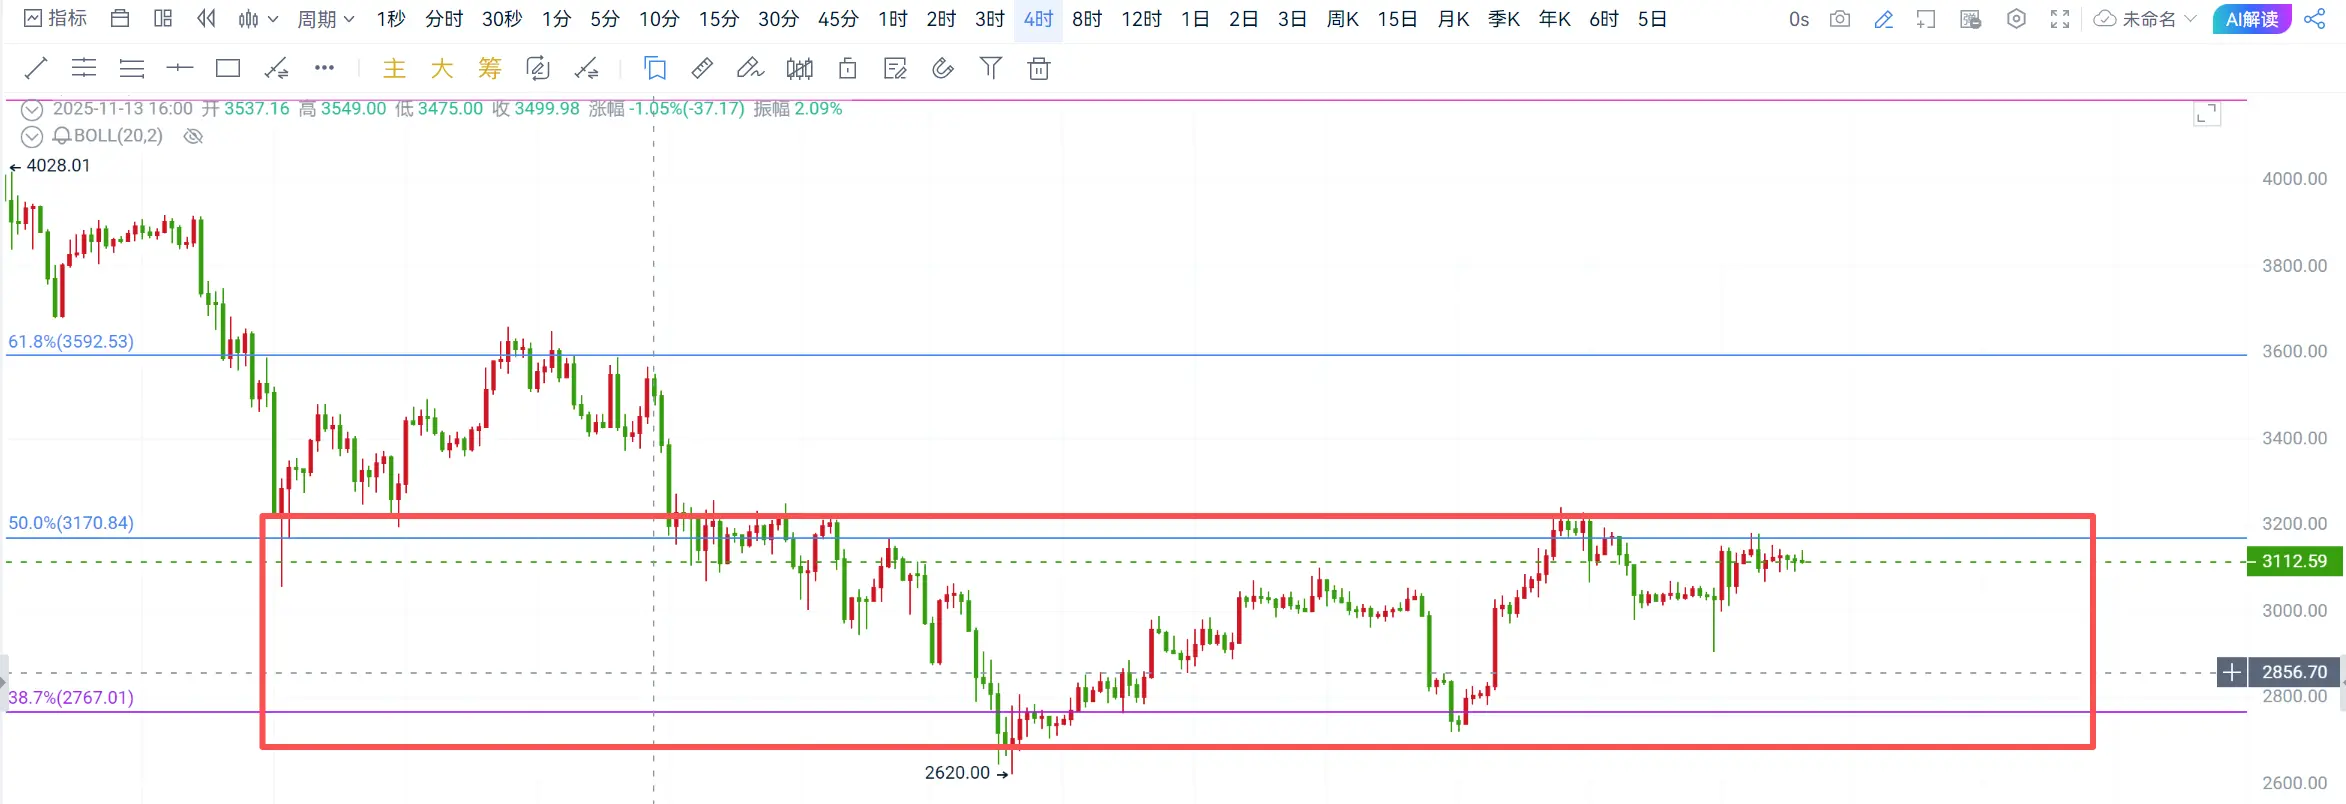
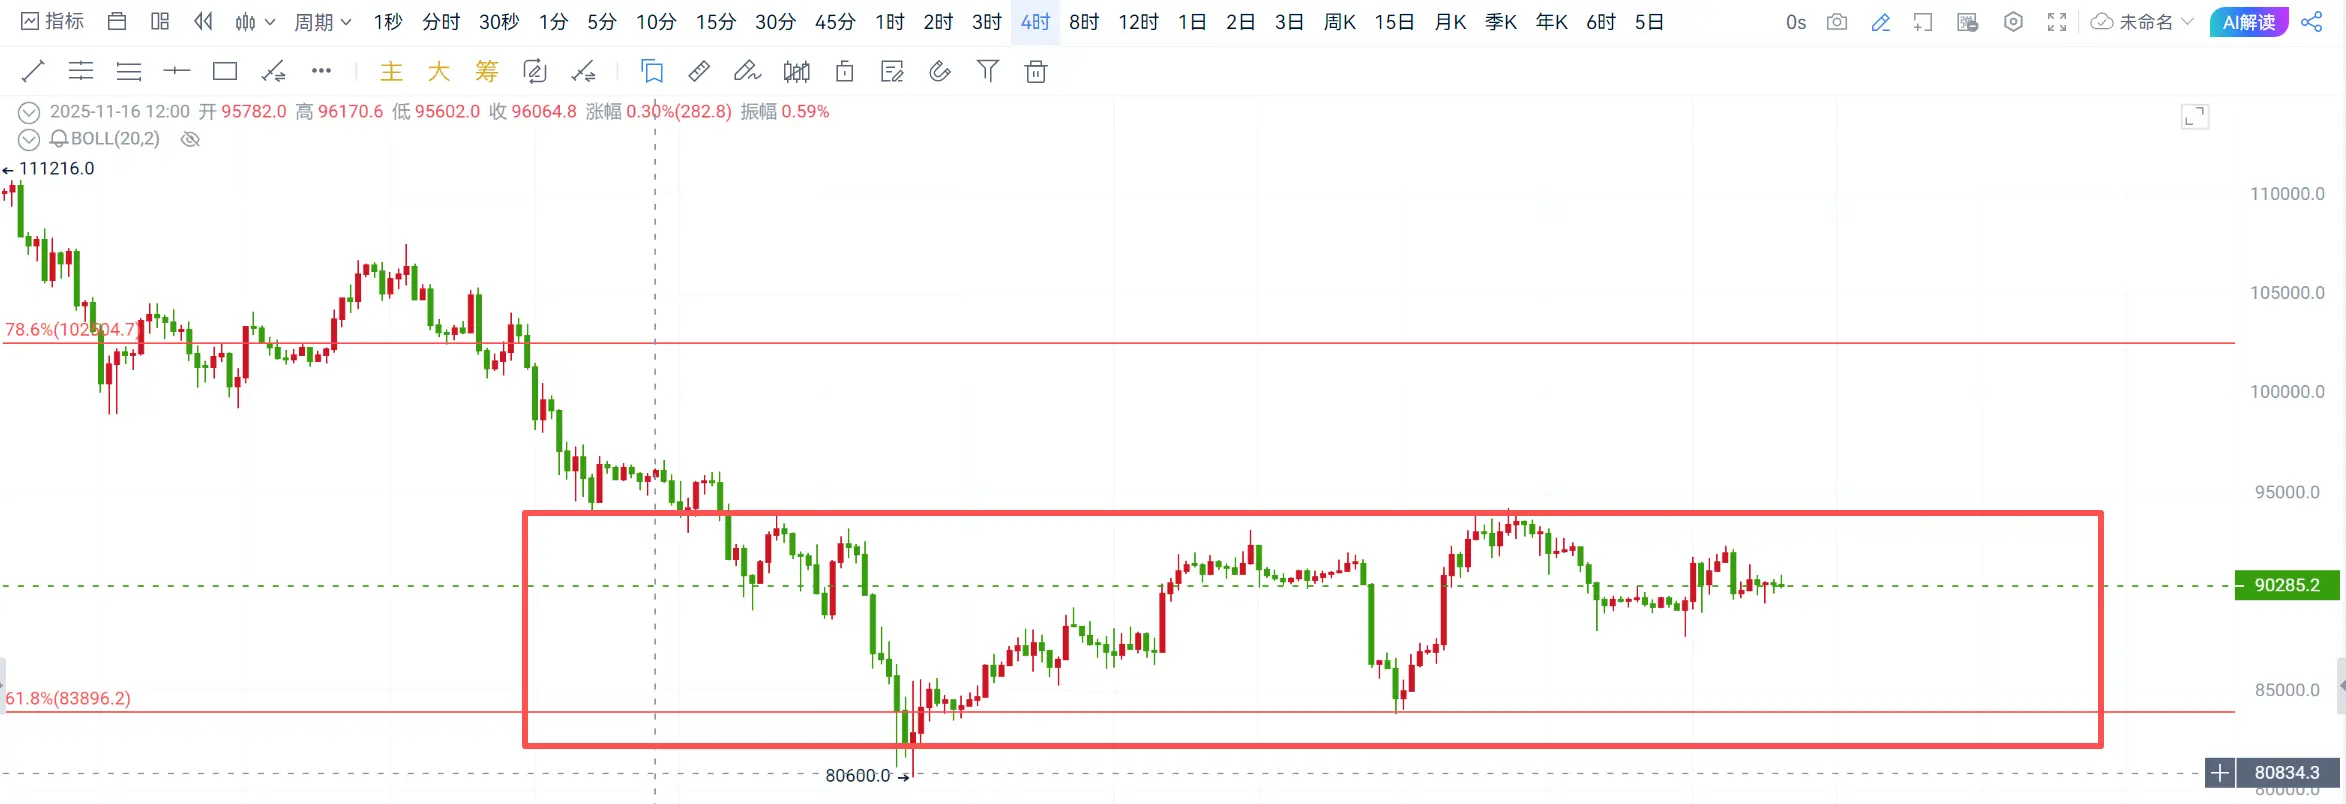
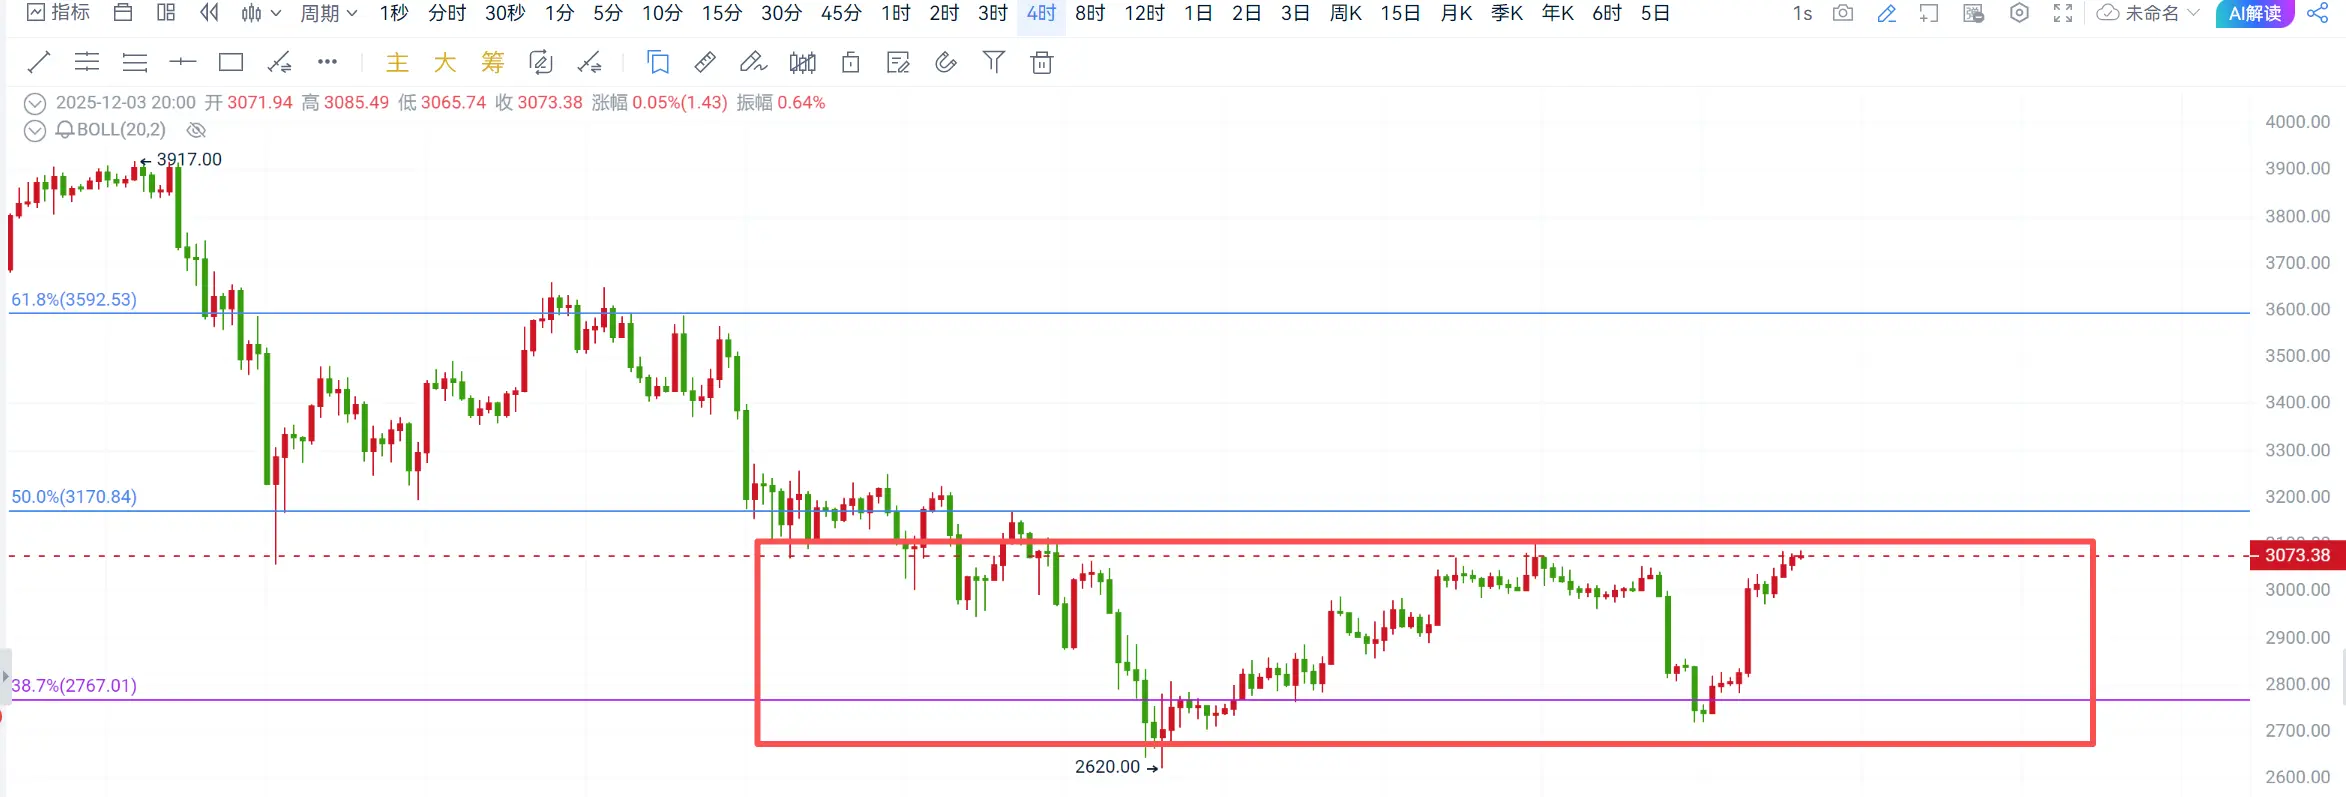
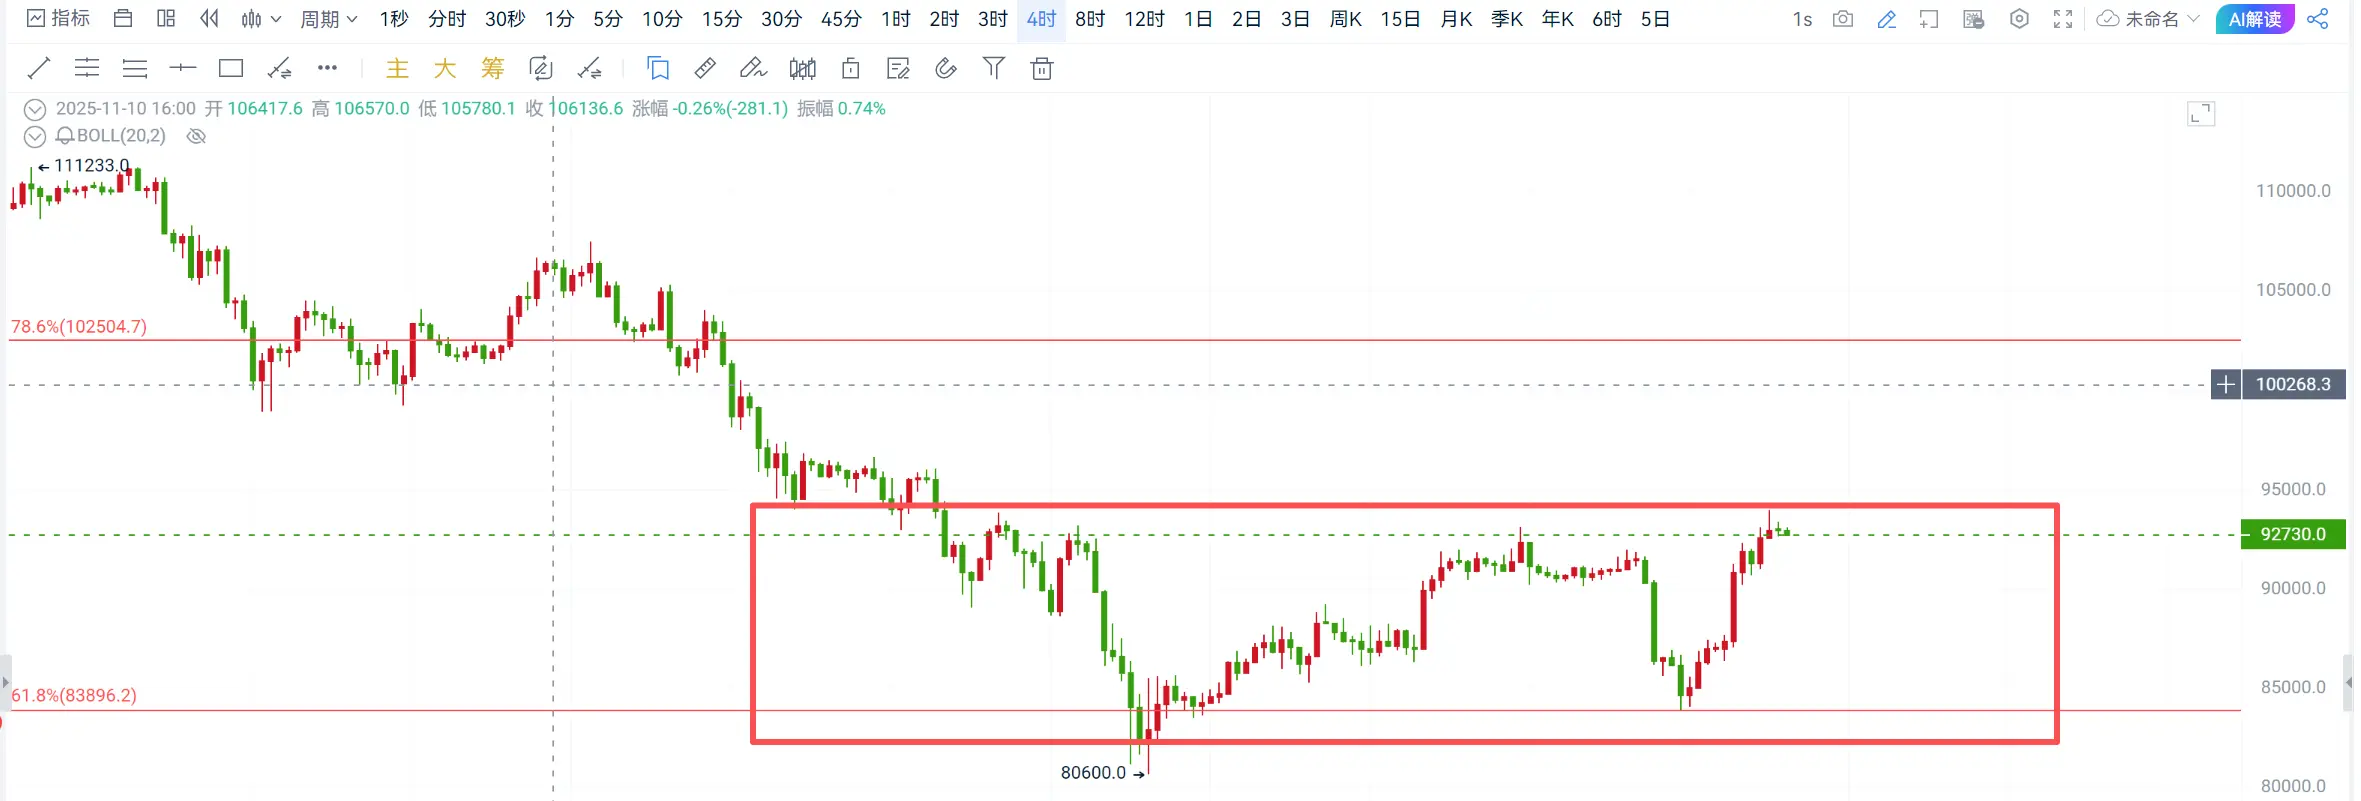
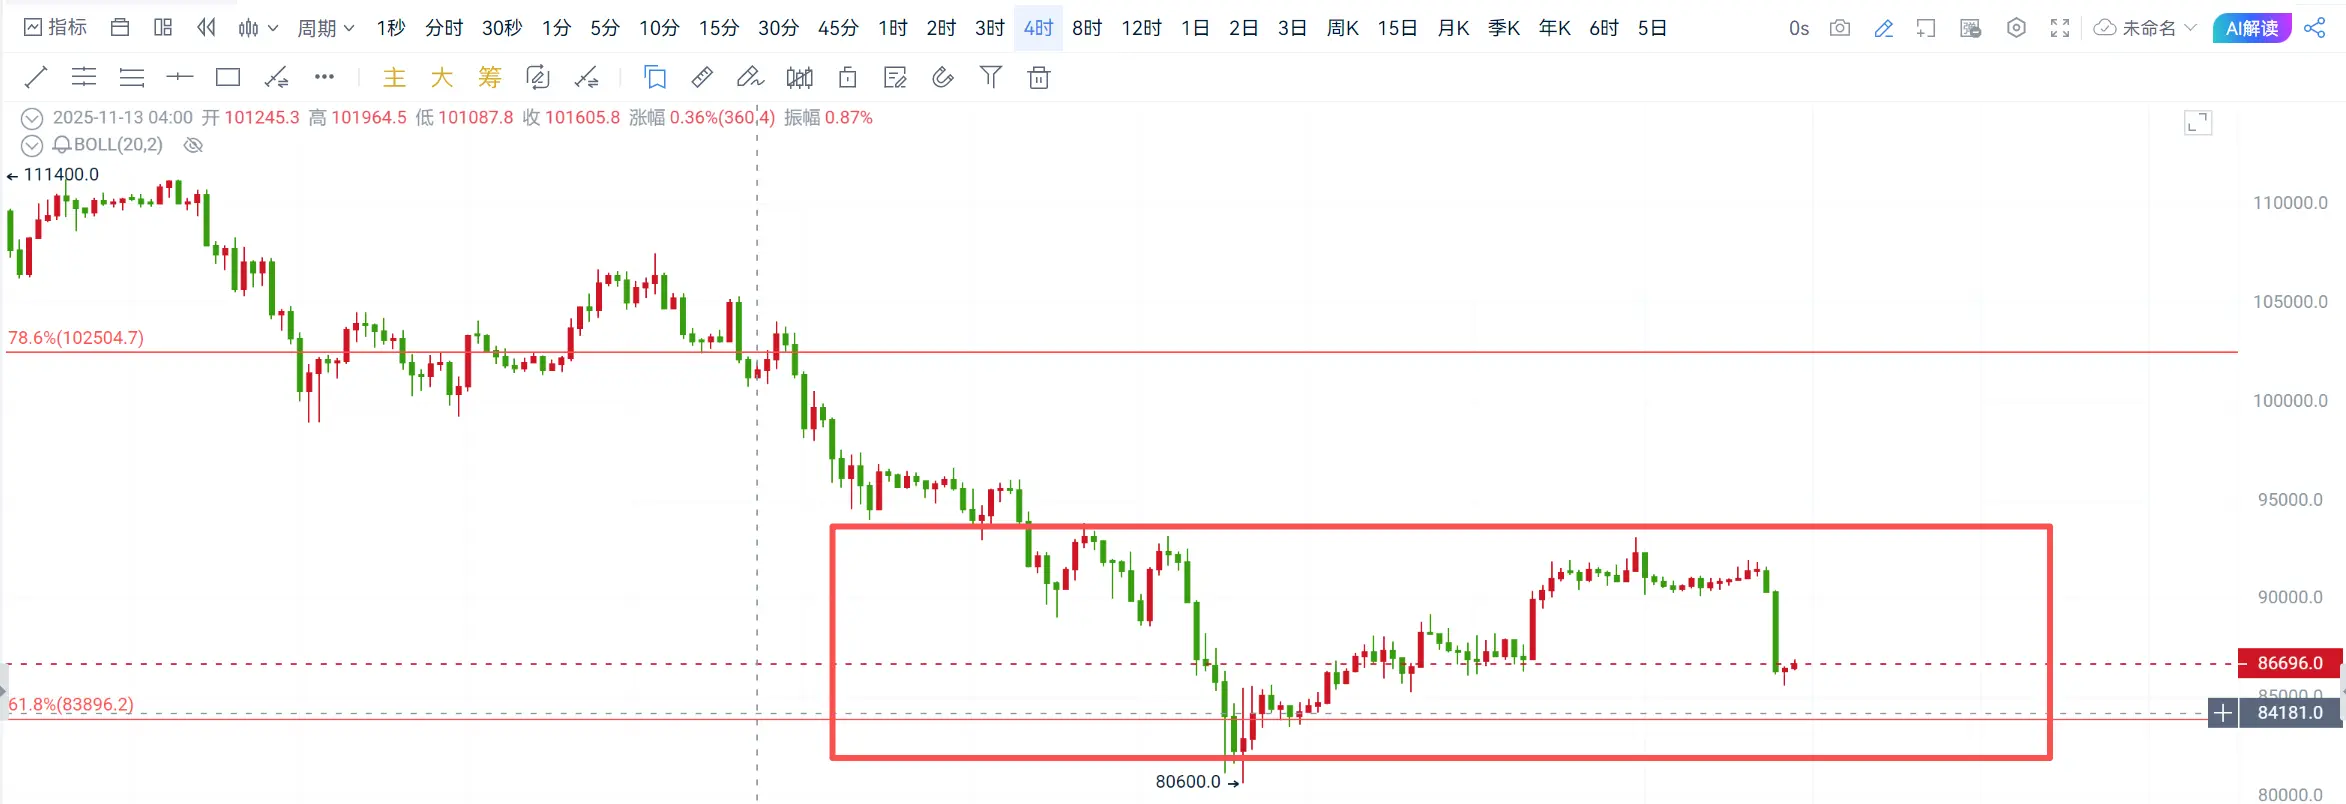
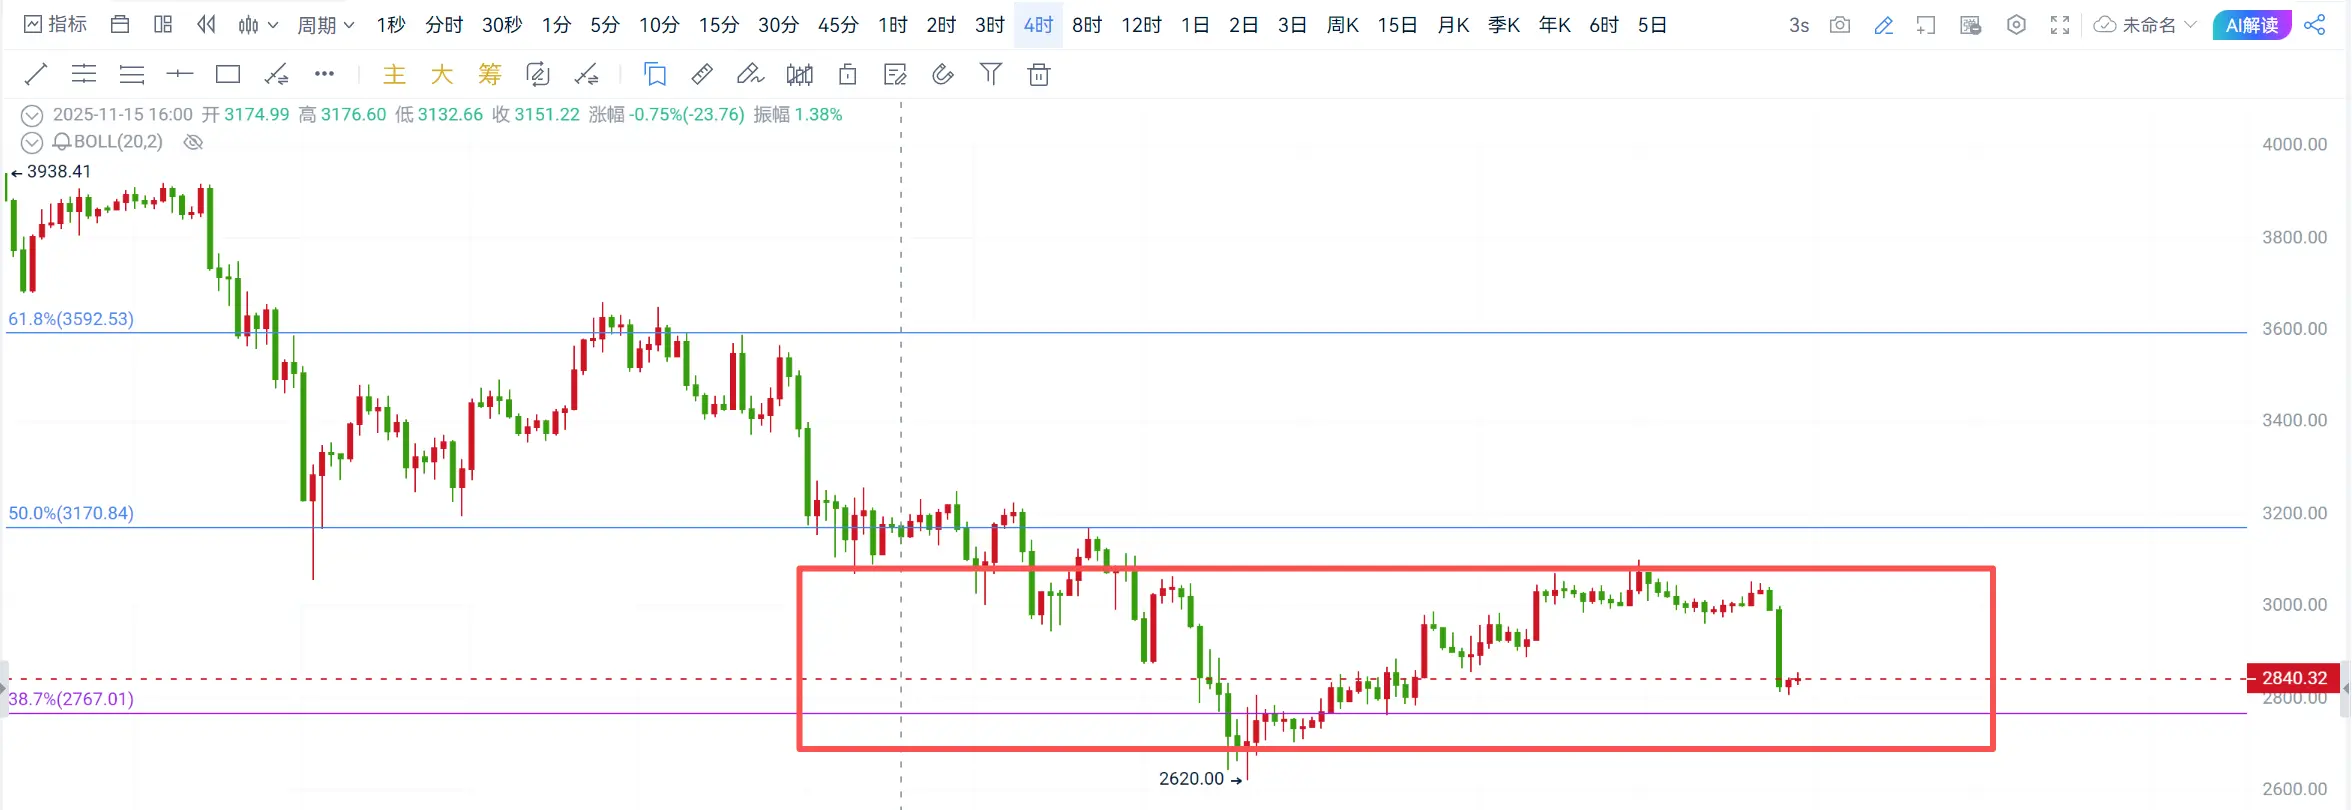
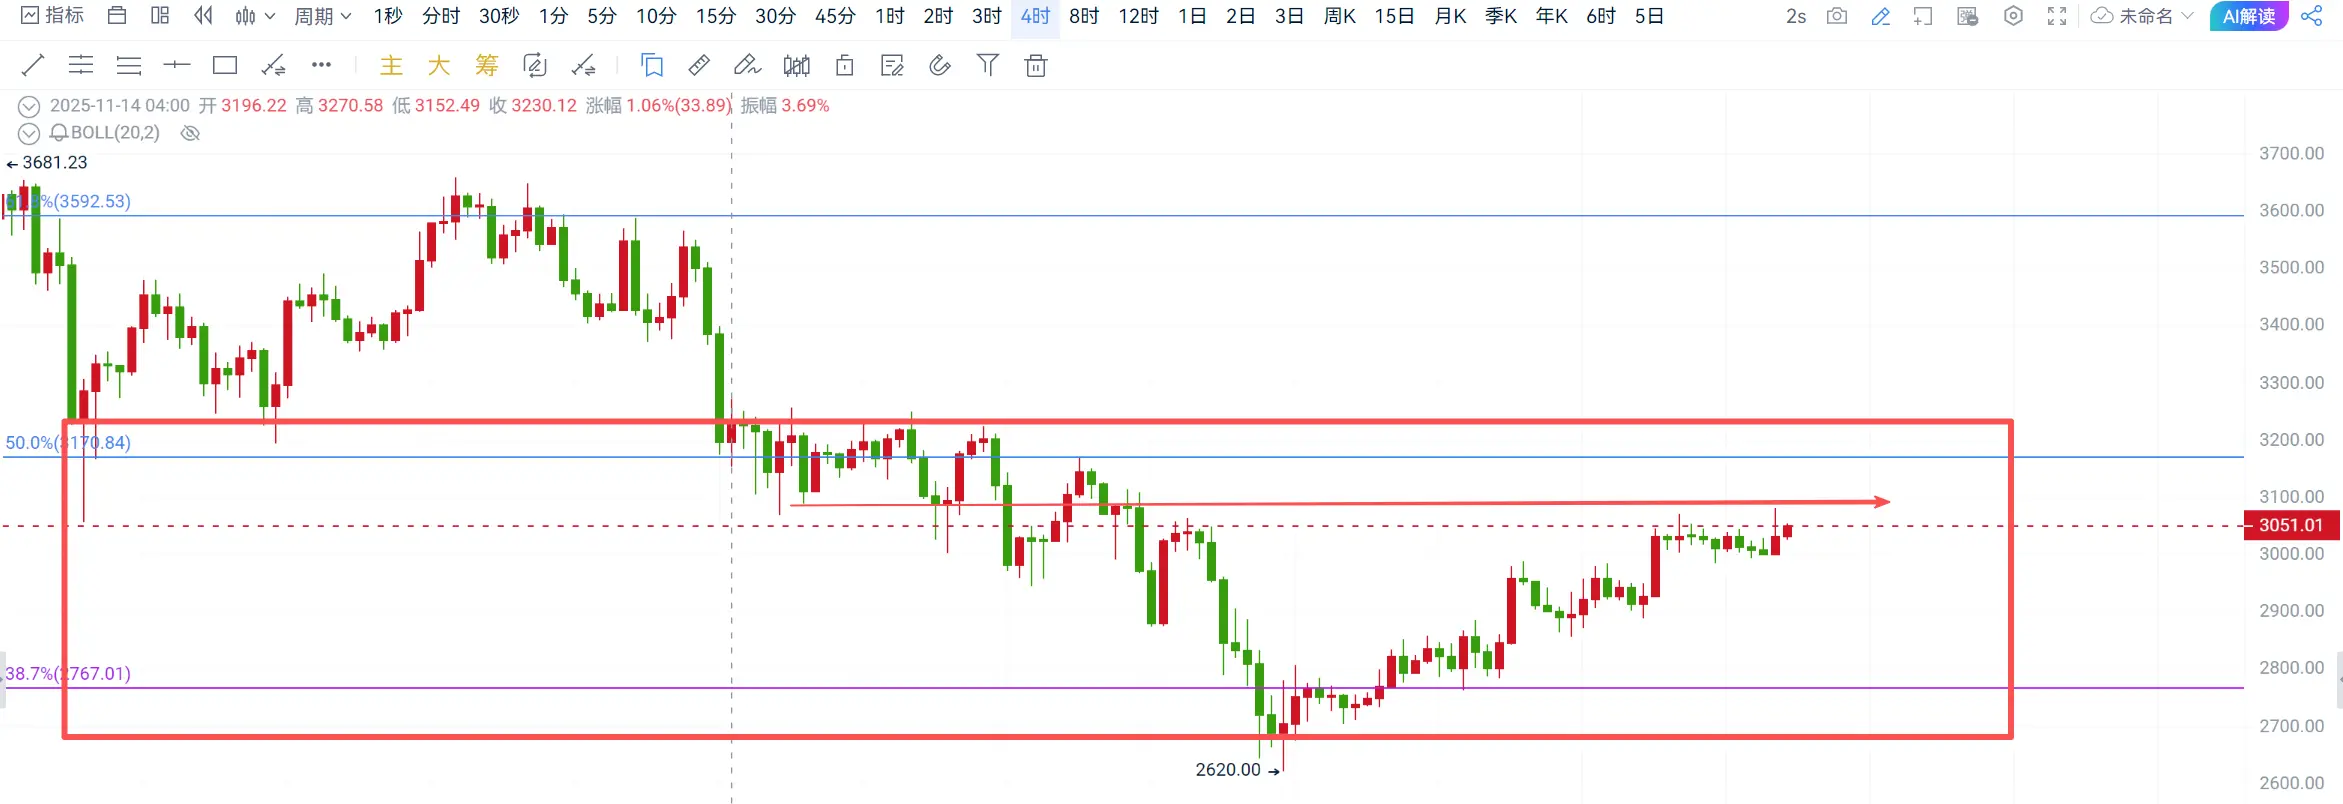
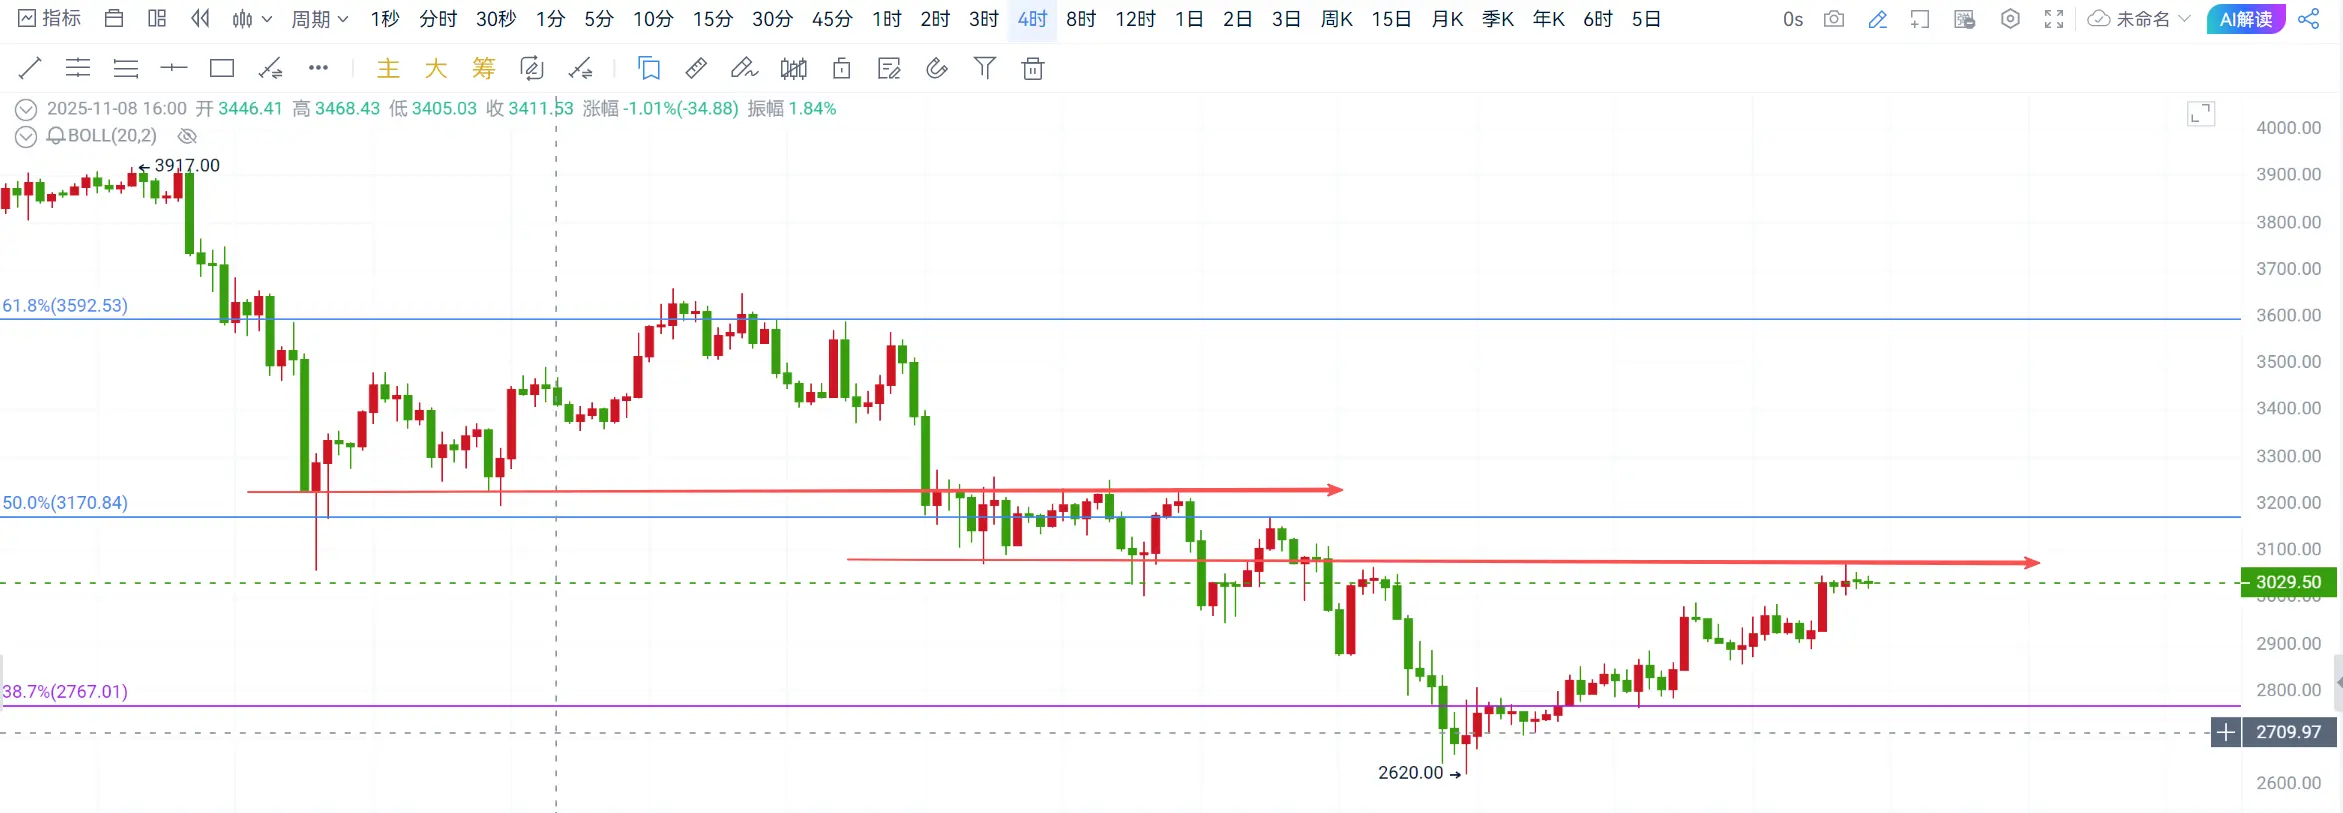
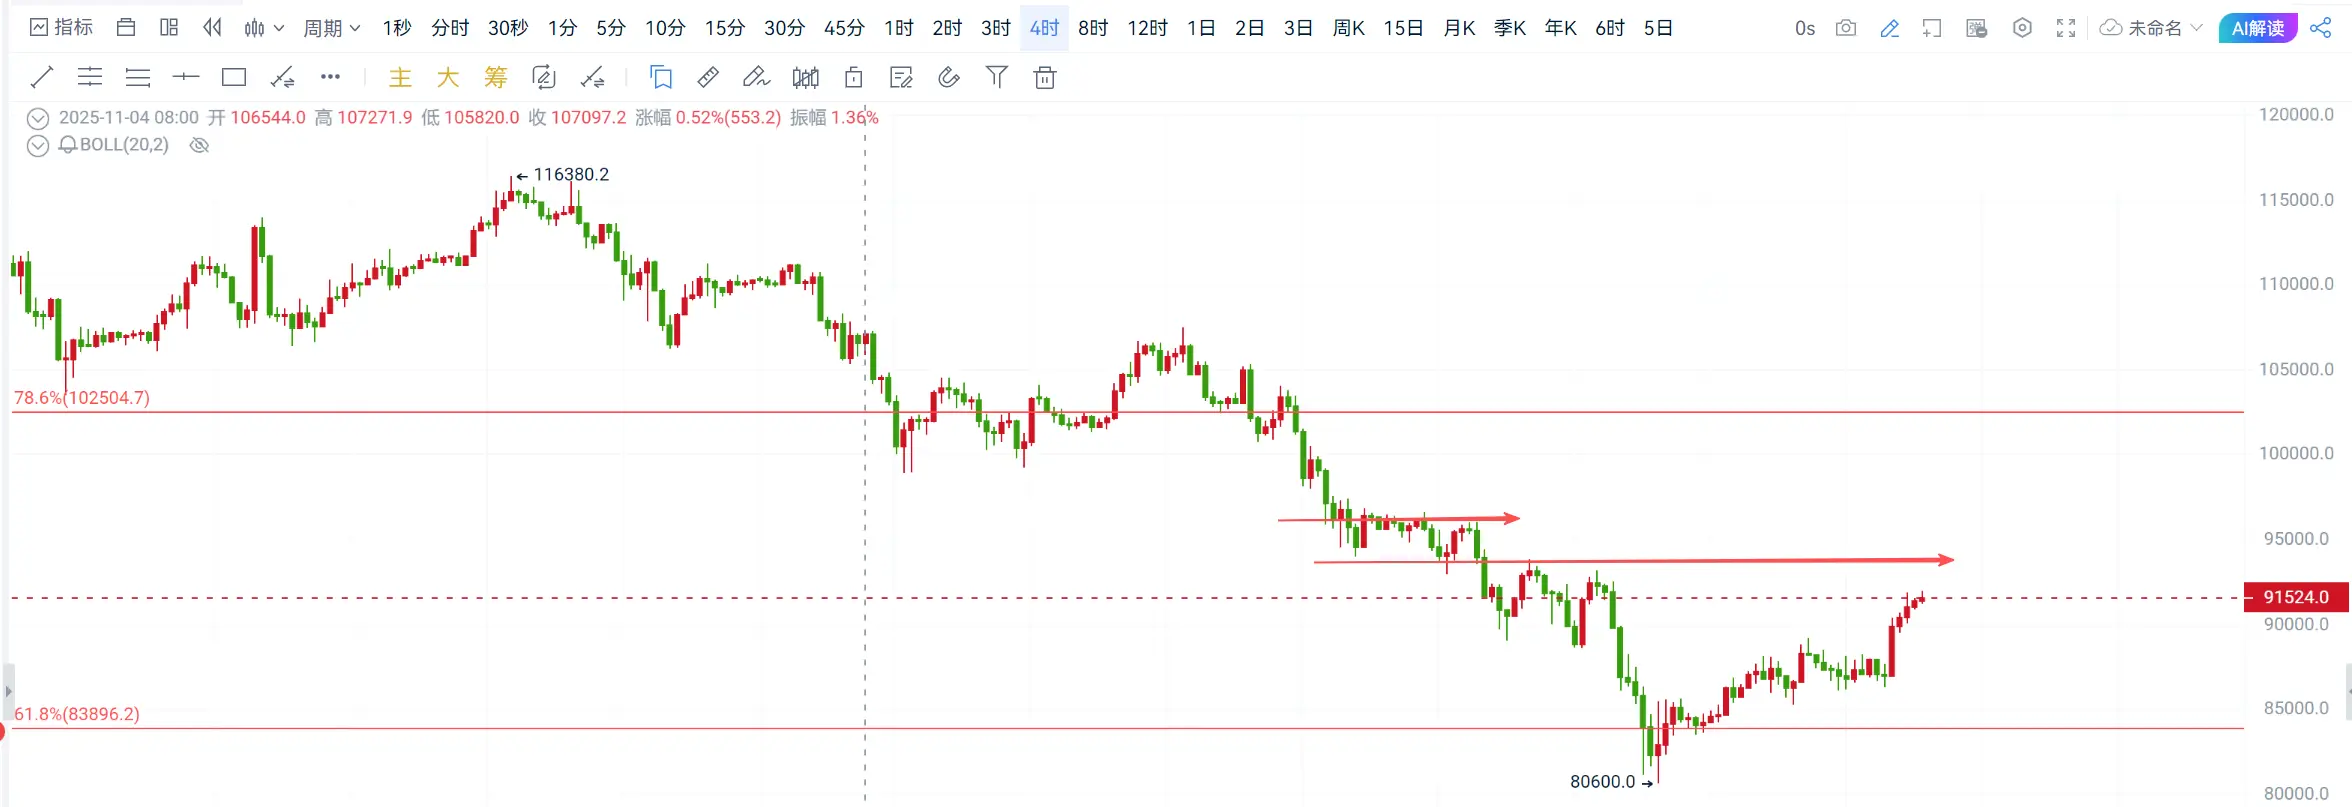
Daily chart: Bitcoin has two consecutive bullish days, rising to the 90,000 level. It is still in the lower half of the box structure, with the top at 94,500 and the bottom at 84,500. Currently, it is testing the middle resistance level, showing signs of continuing upward breakout! Ethereum also has two consecutive bullish days, rising to around 3,130. It has broken below the lower half of the box, with the top at 3,320 and the bottom at 2,770. The middle resistance is around 3,030. As previously mentioned, a breakout could lead to a rally towards 3,230!
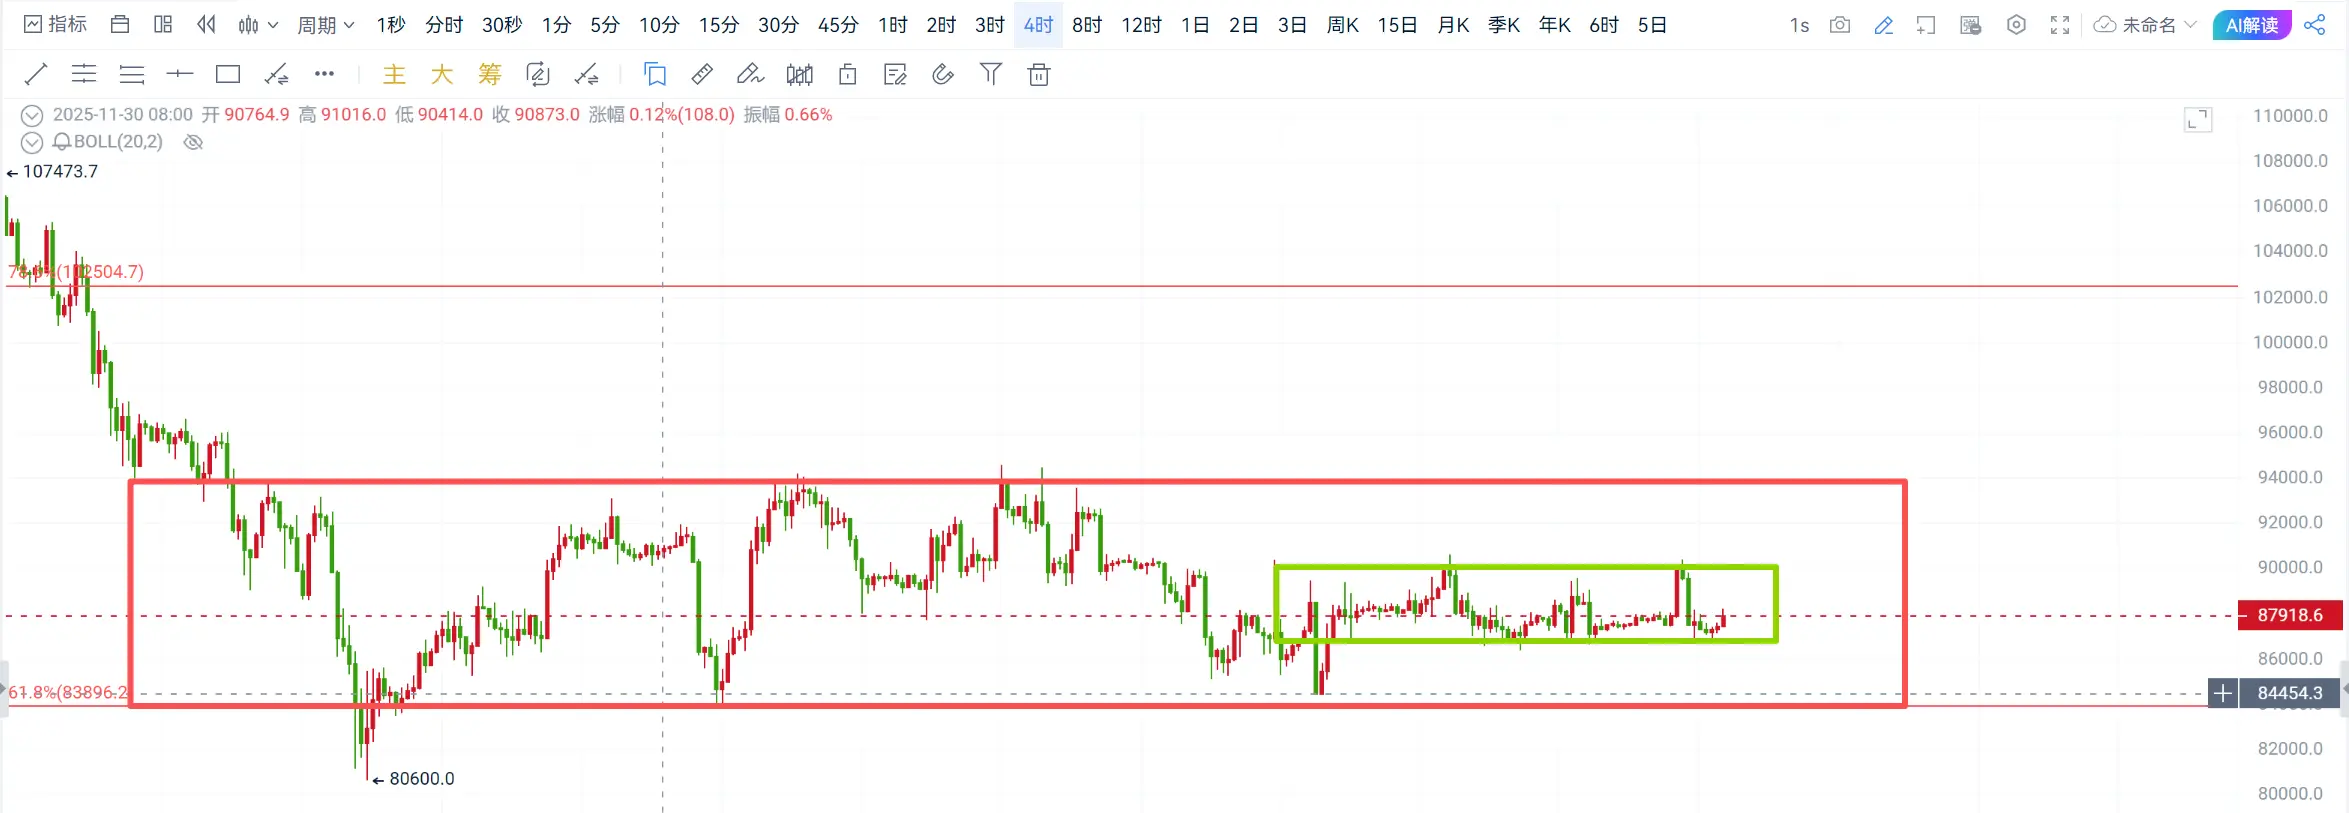
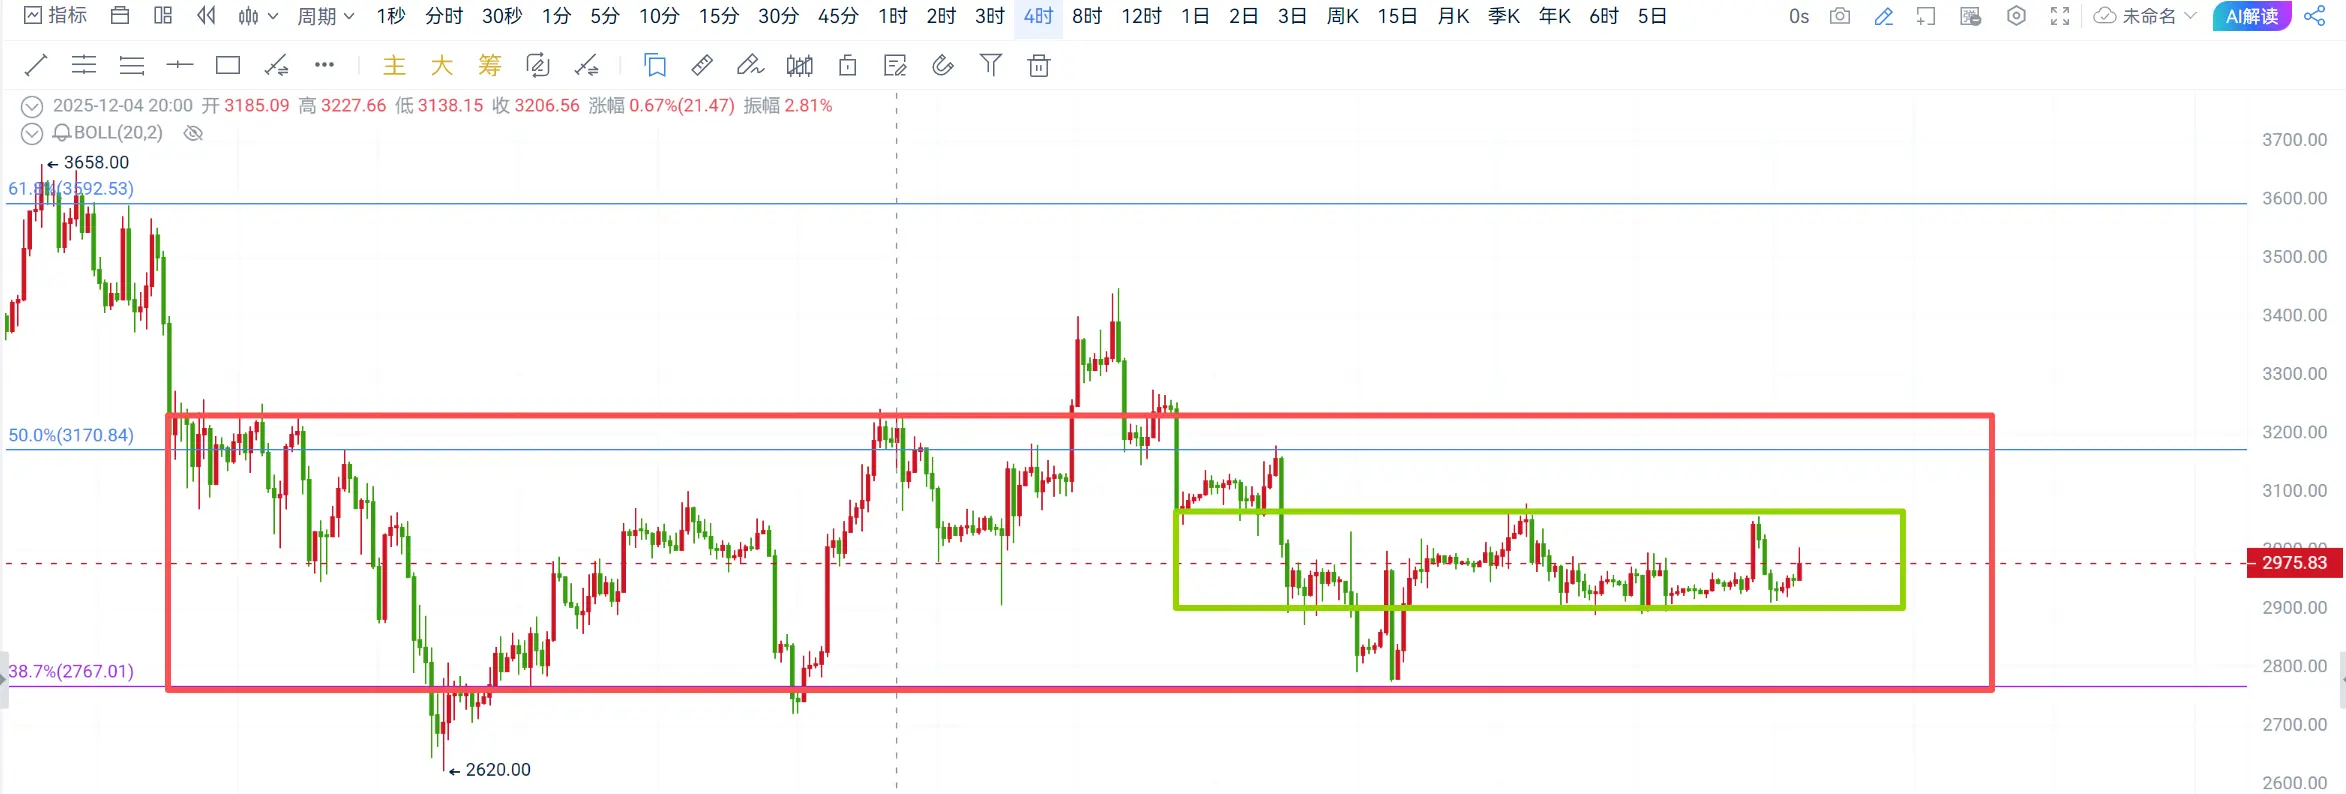
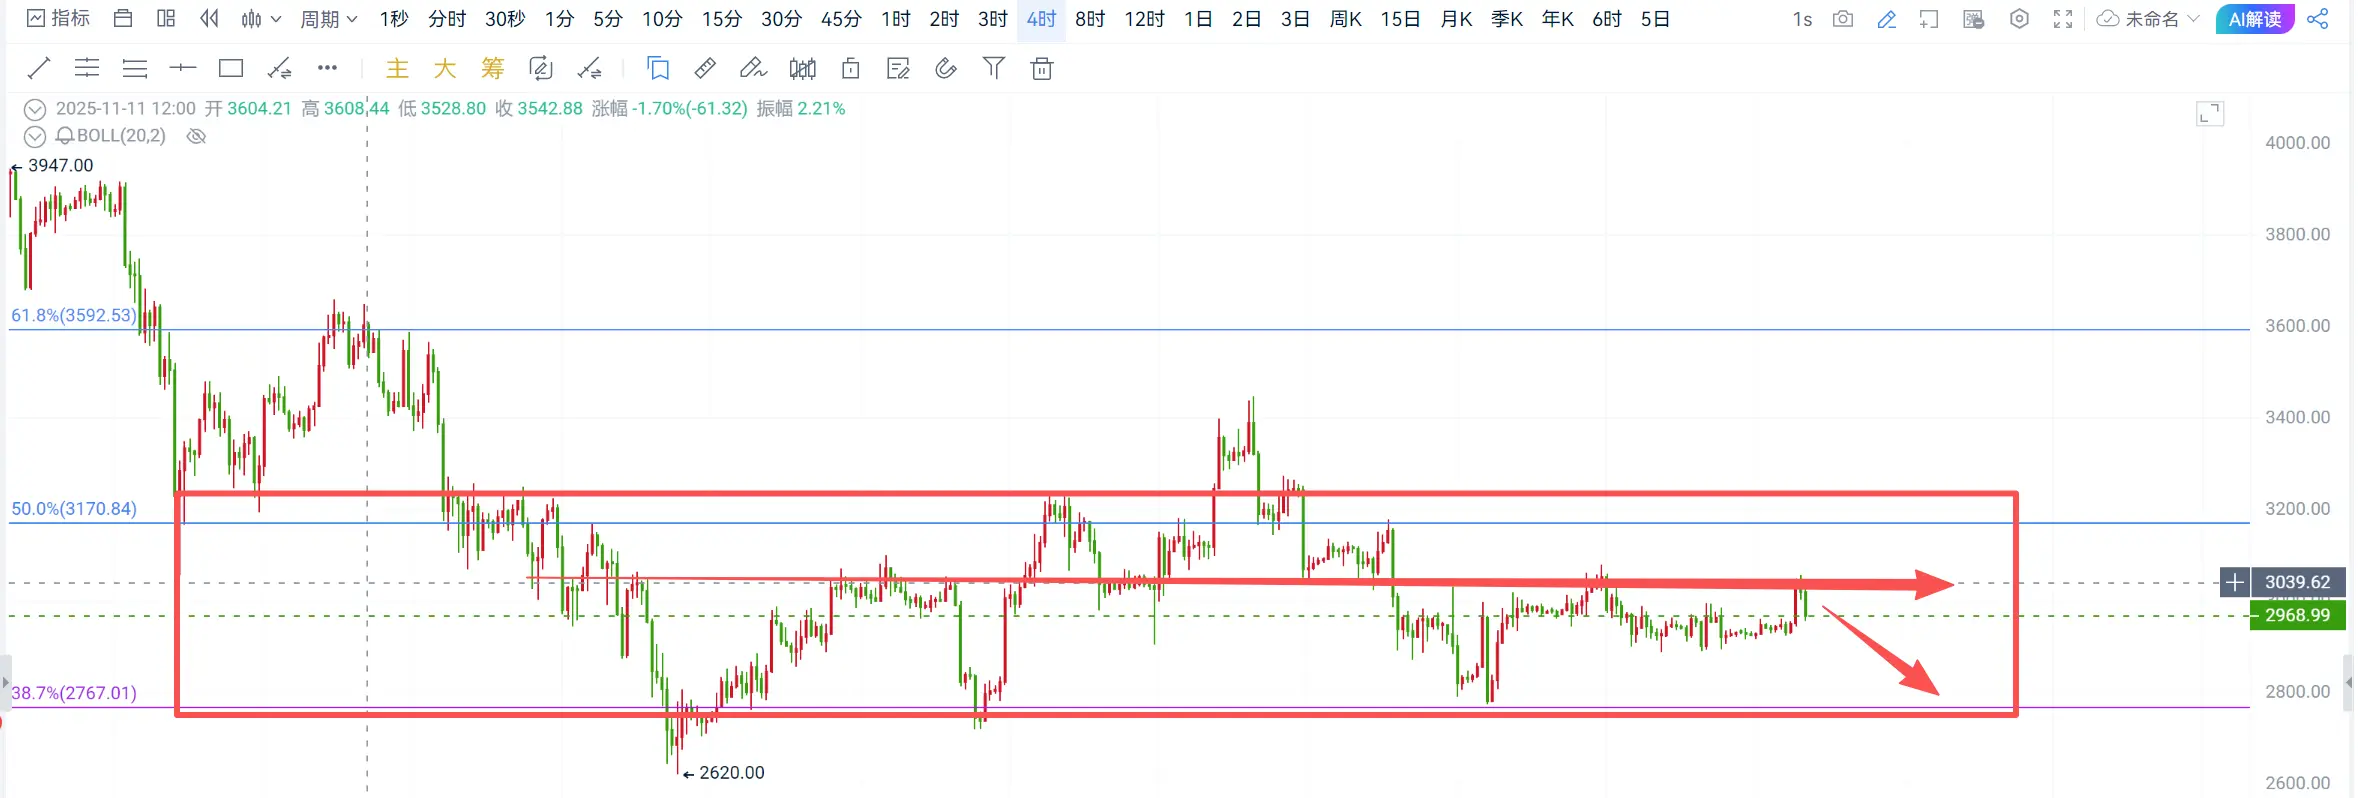
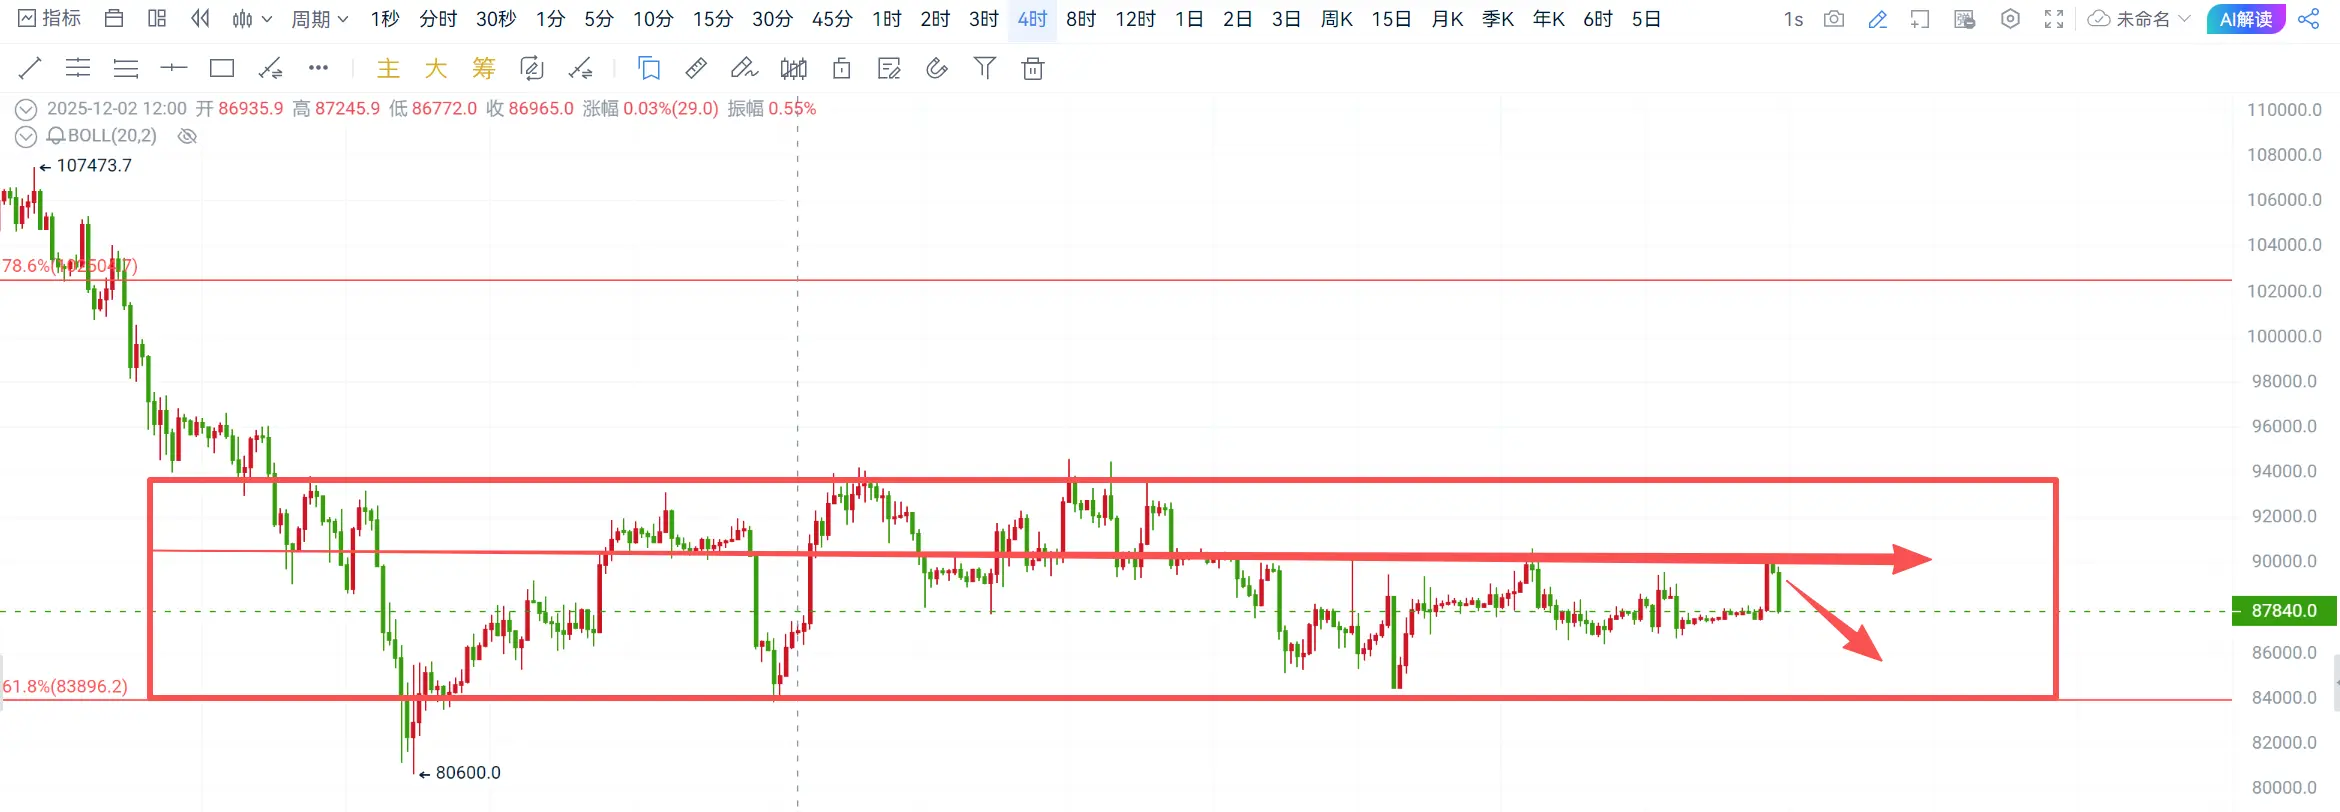
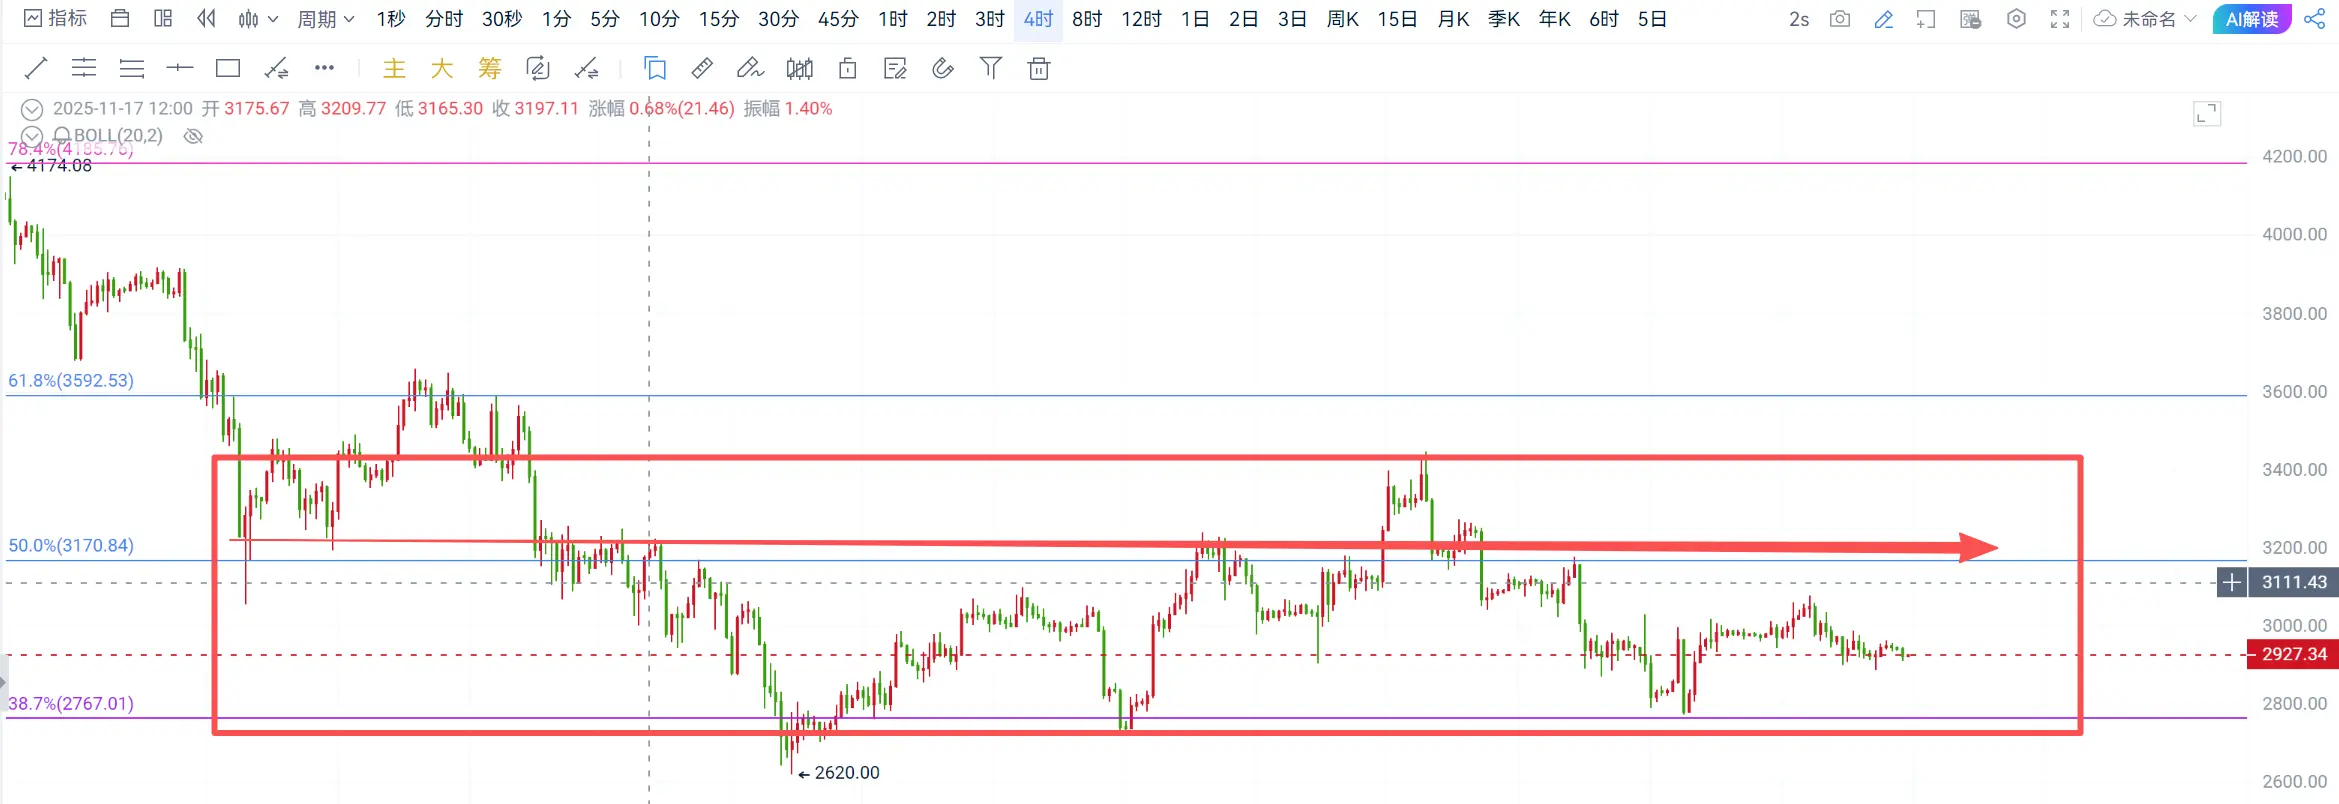
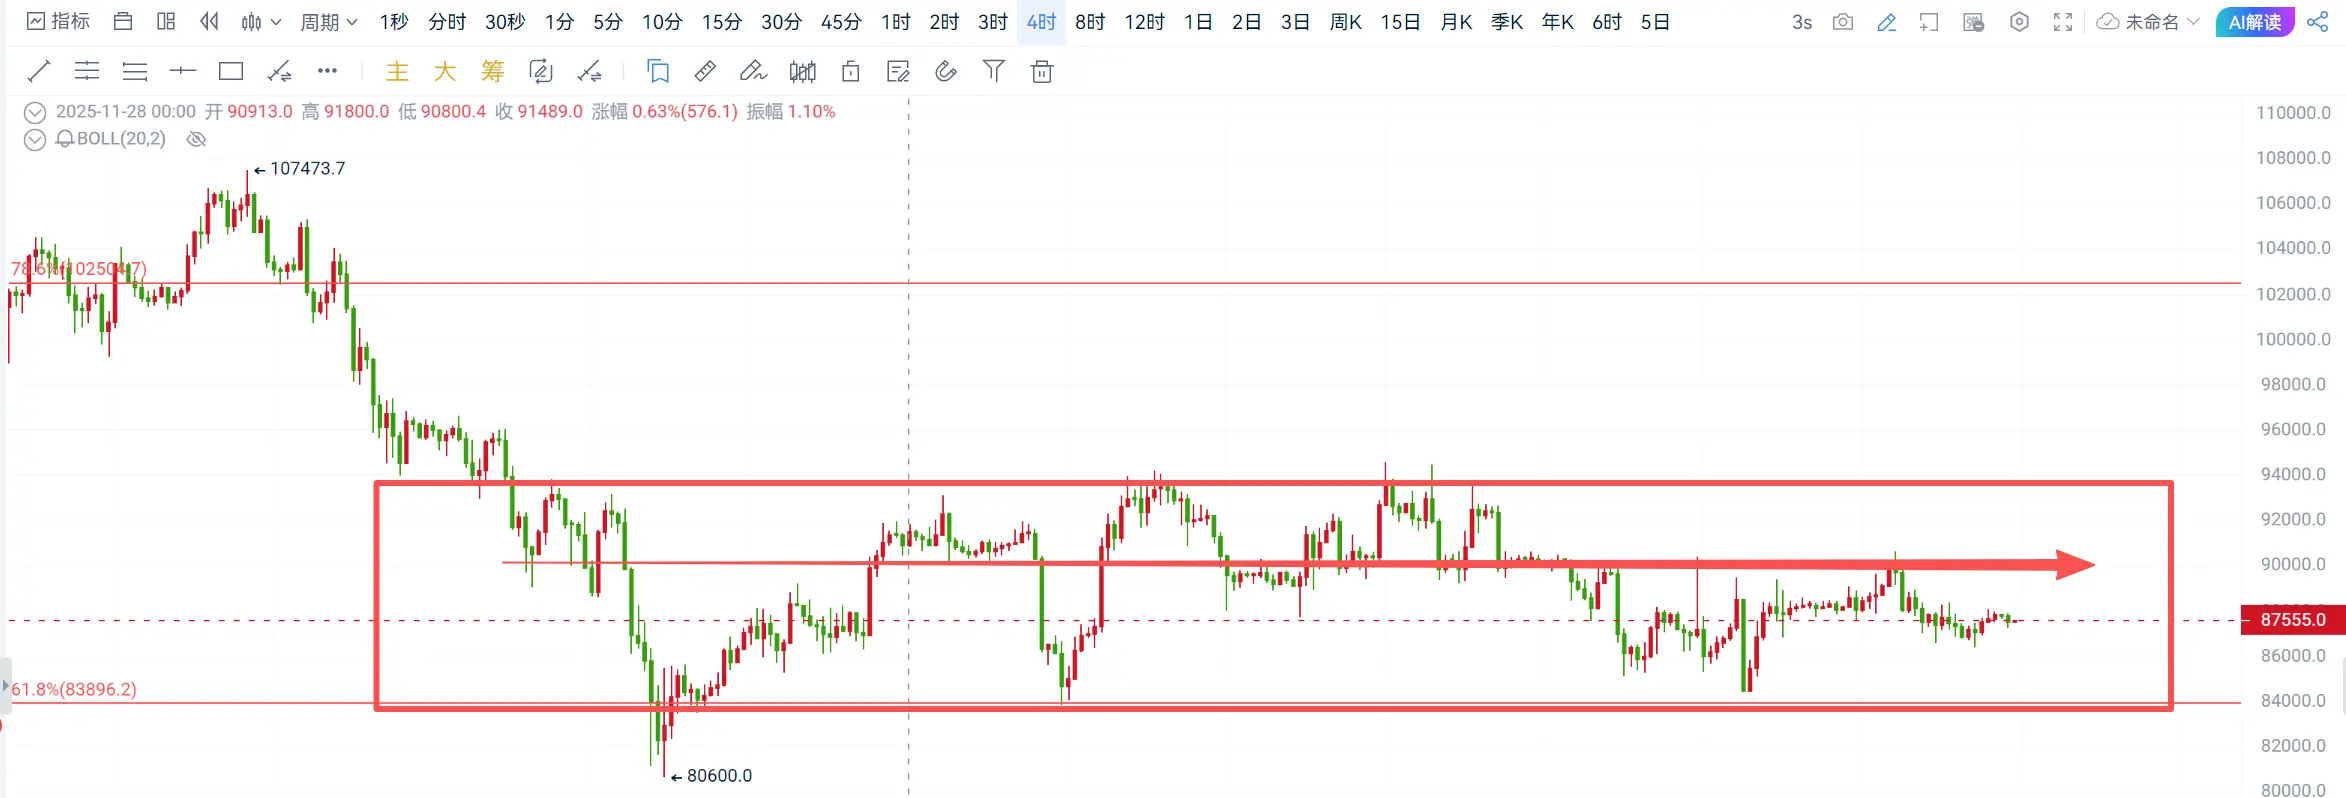
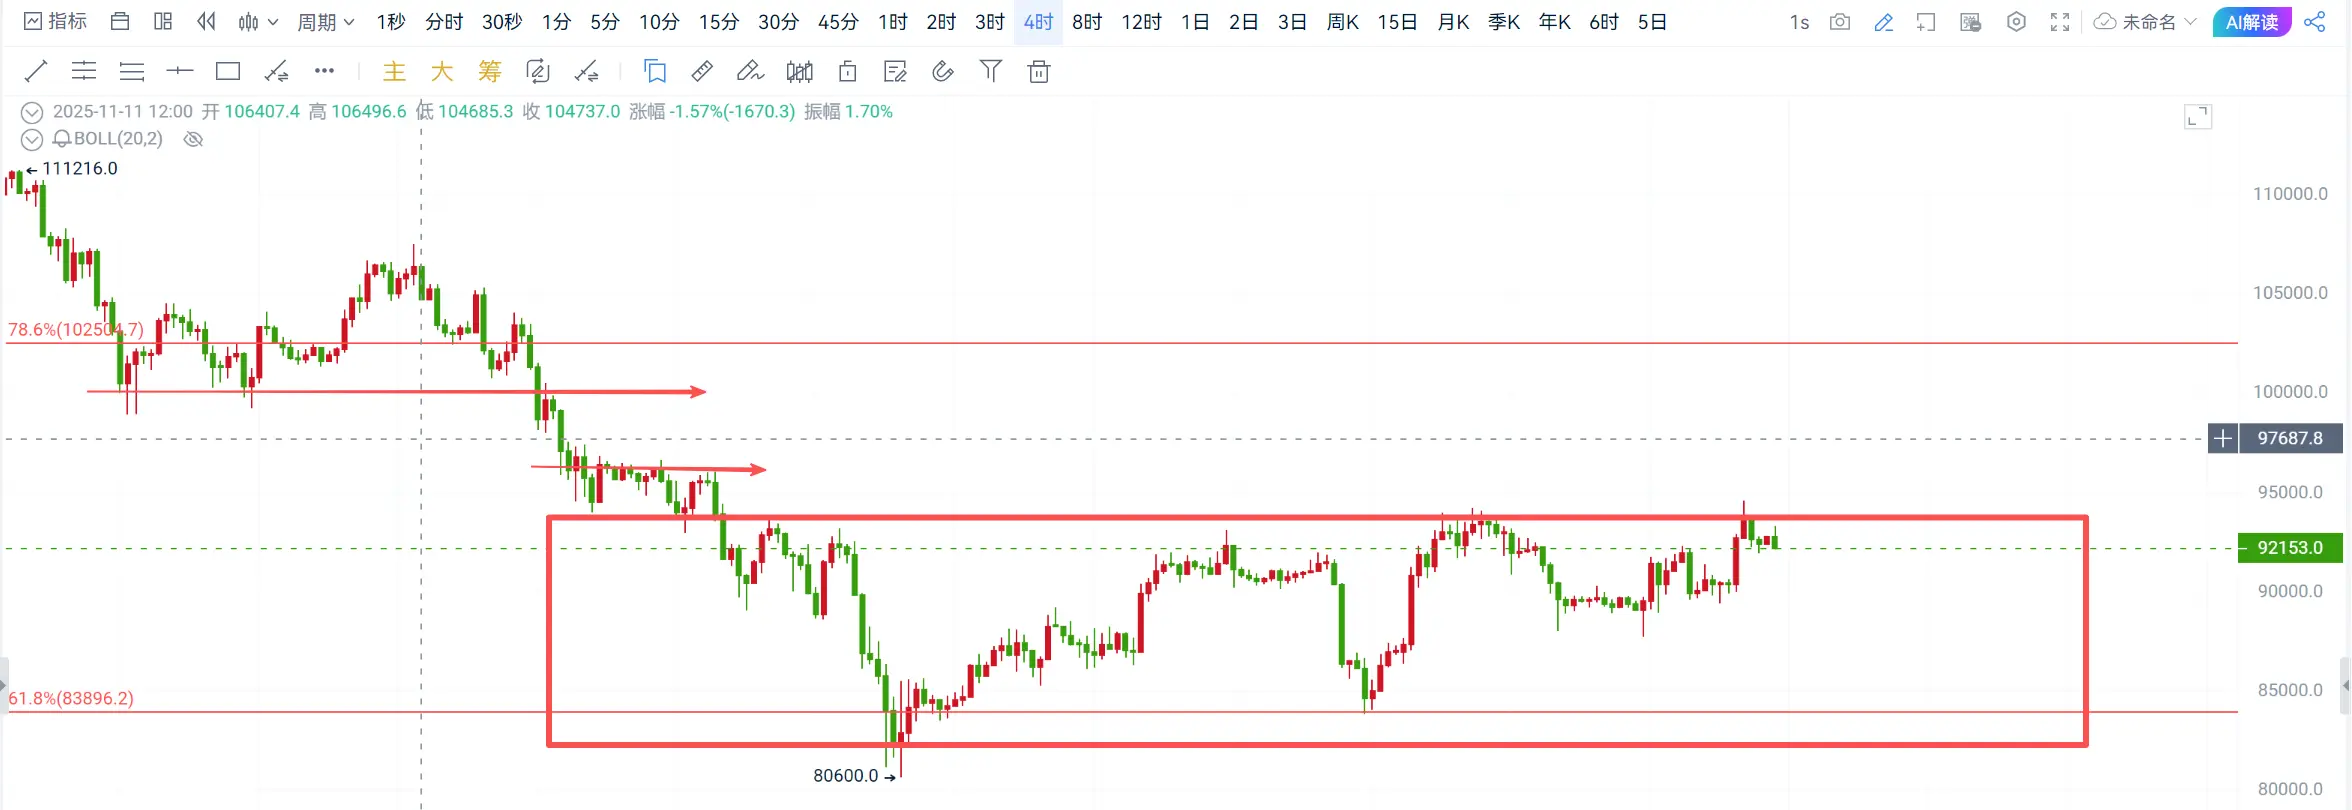
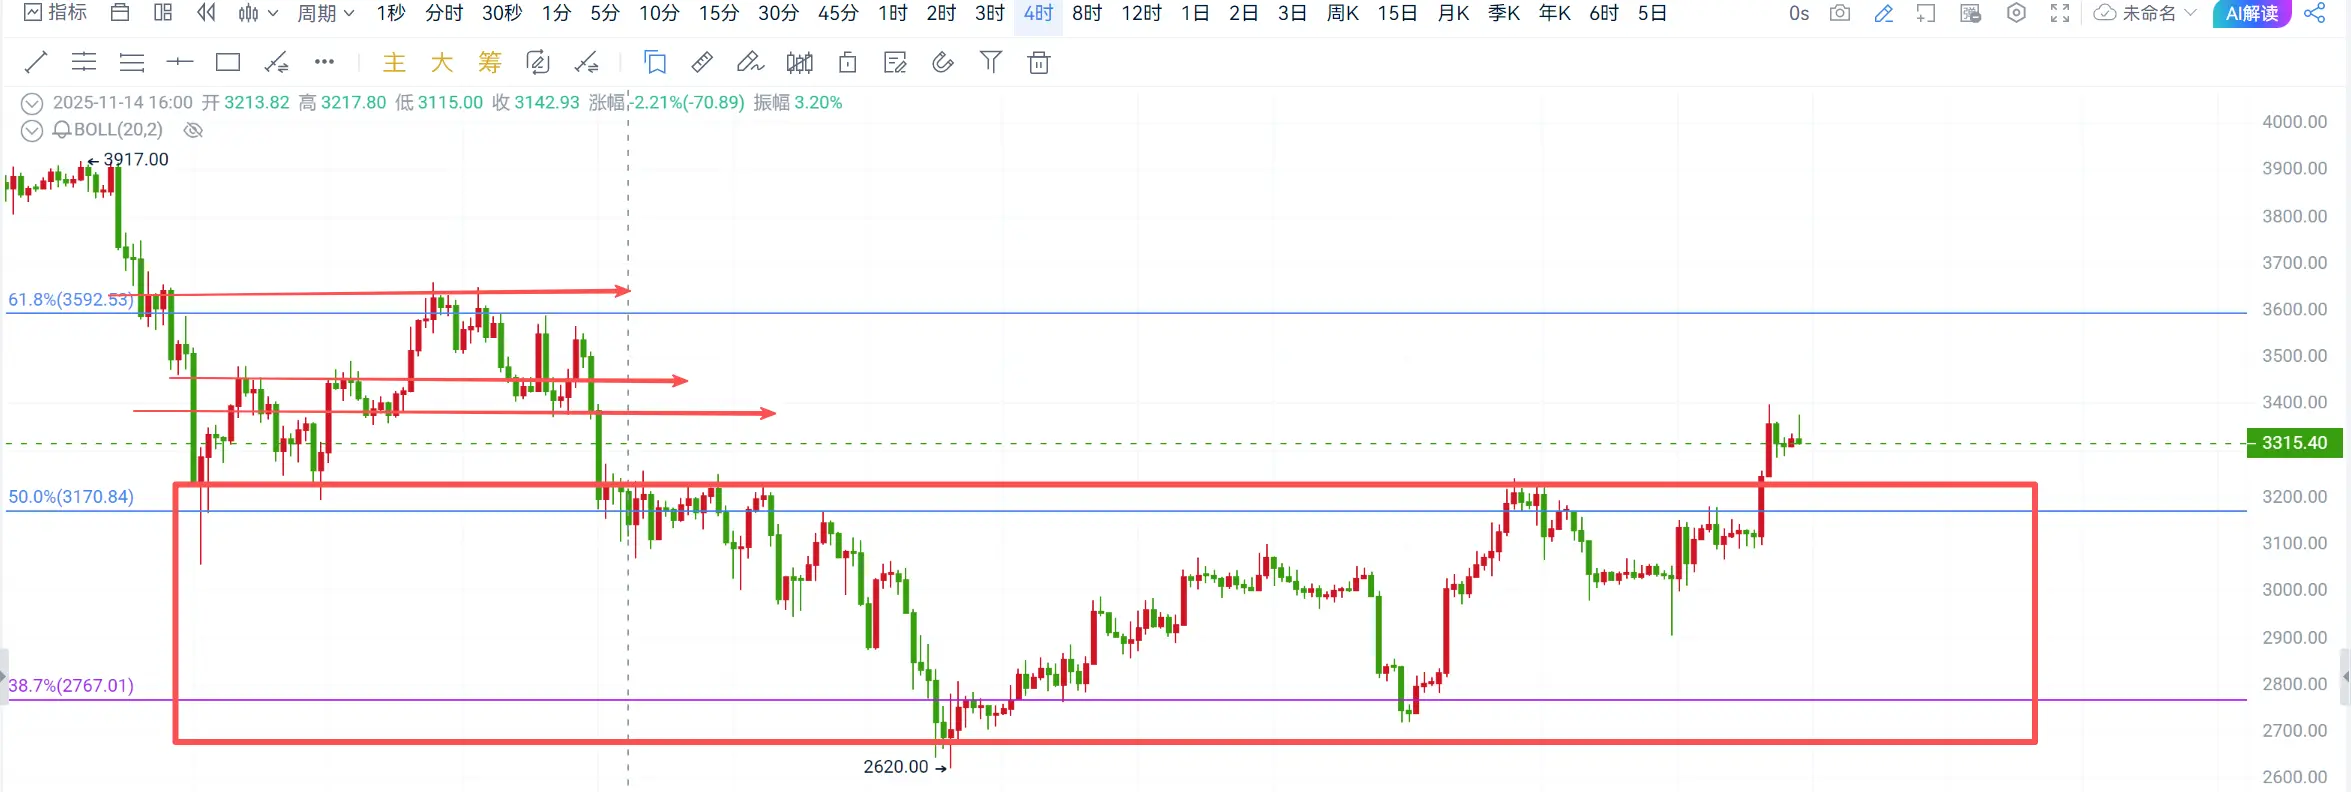
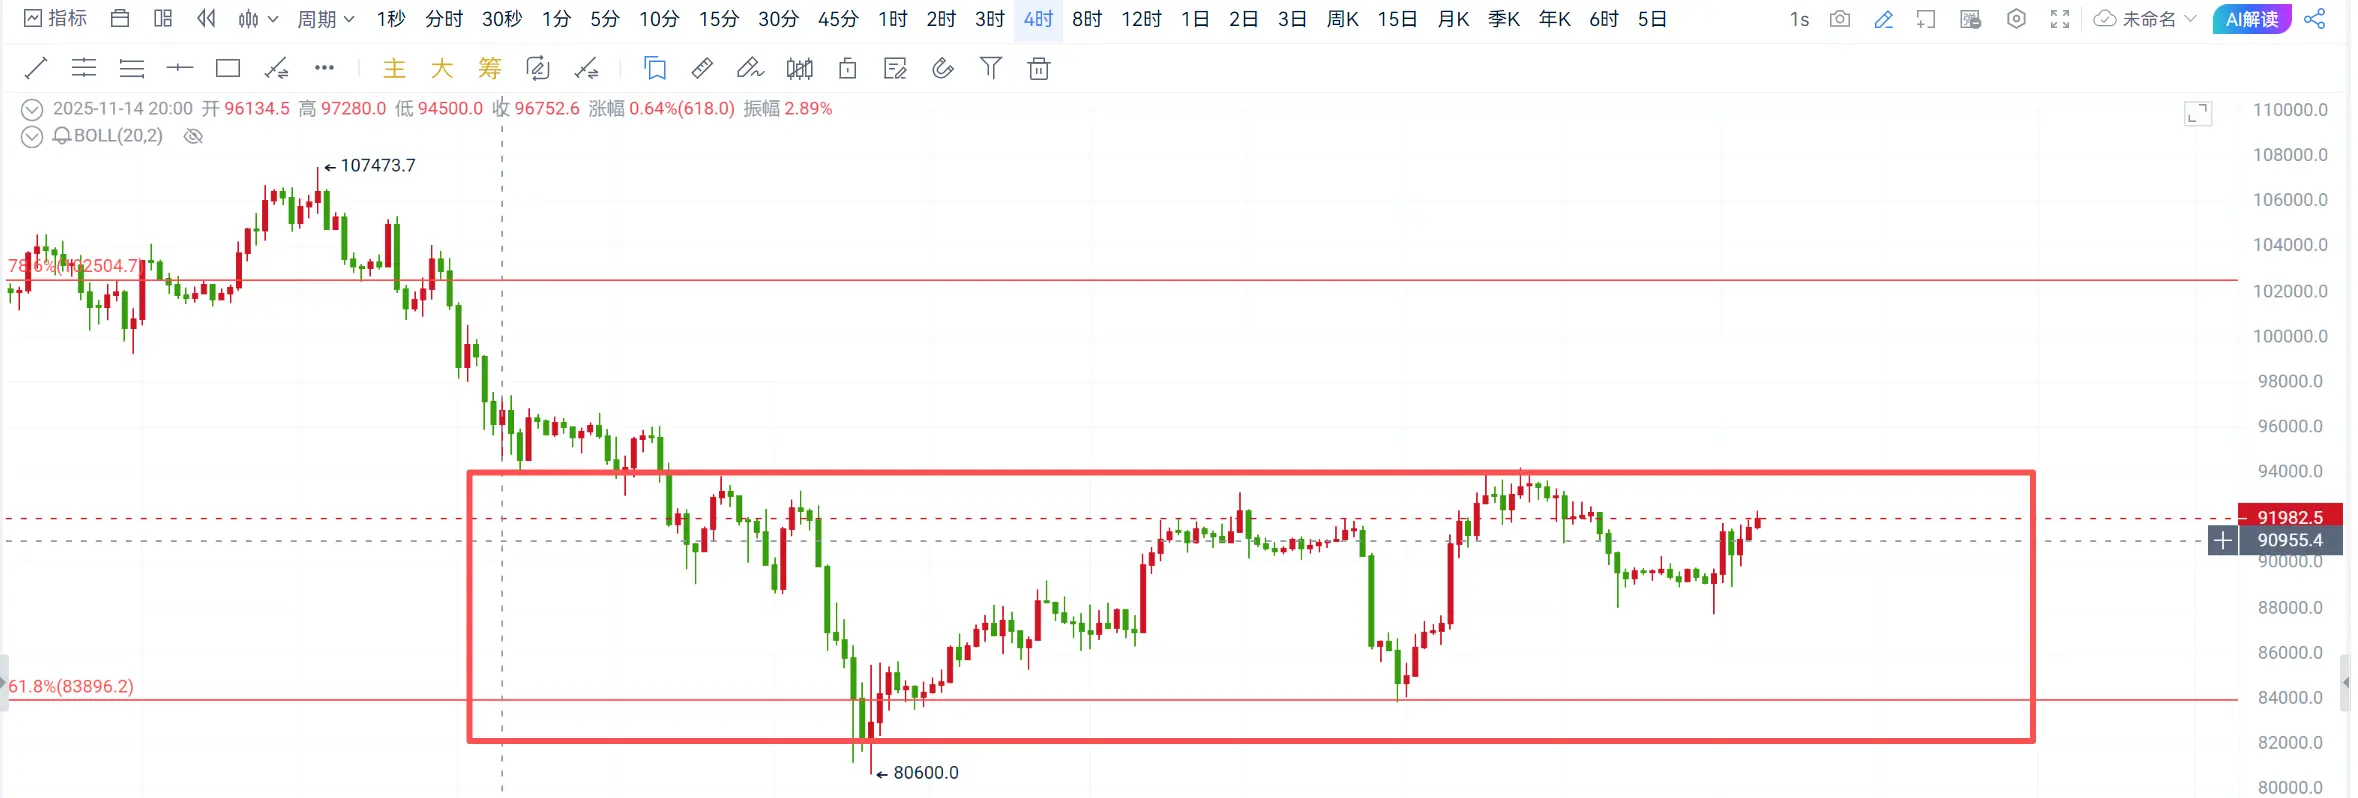
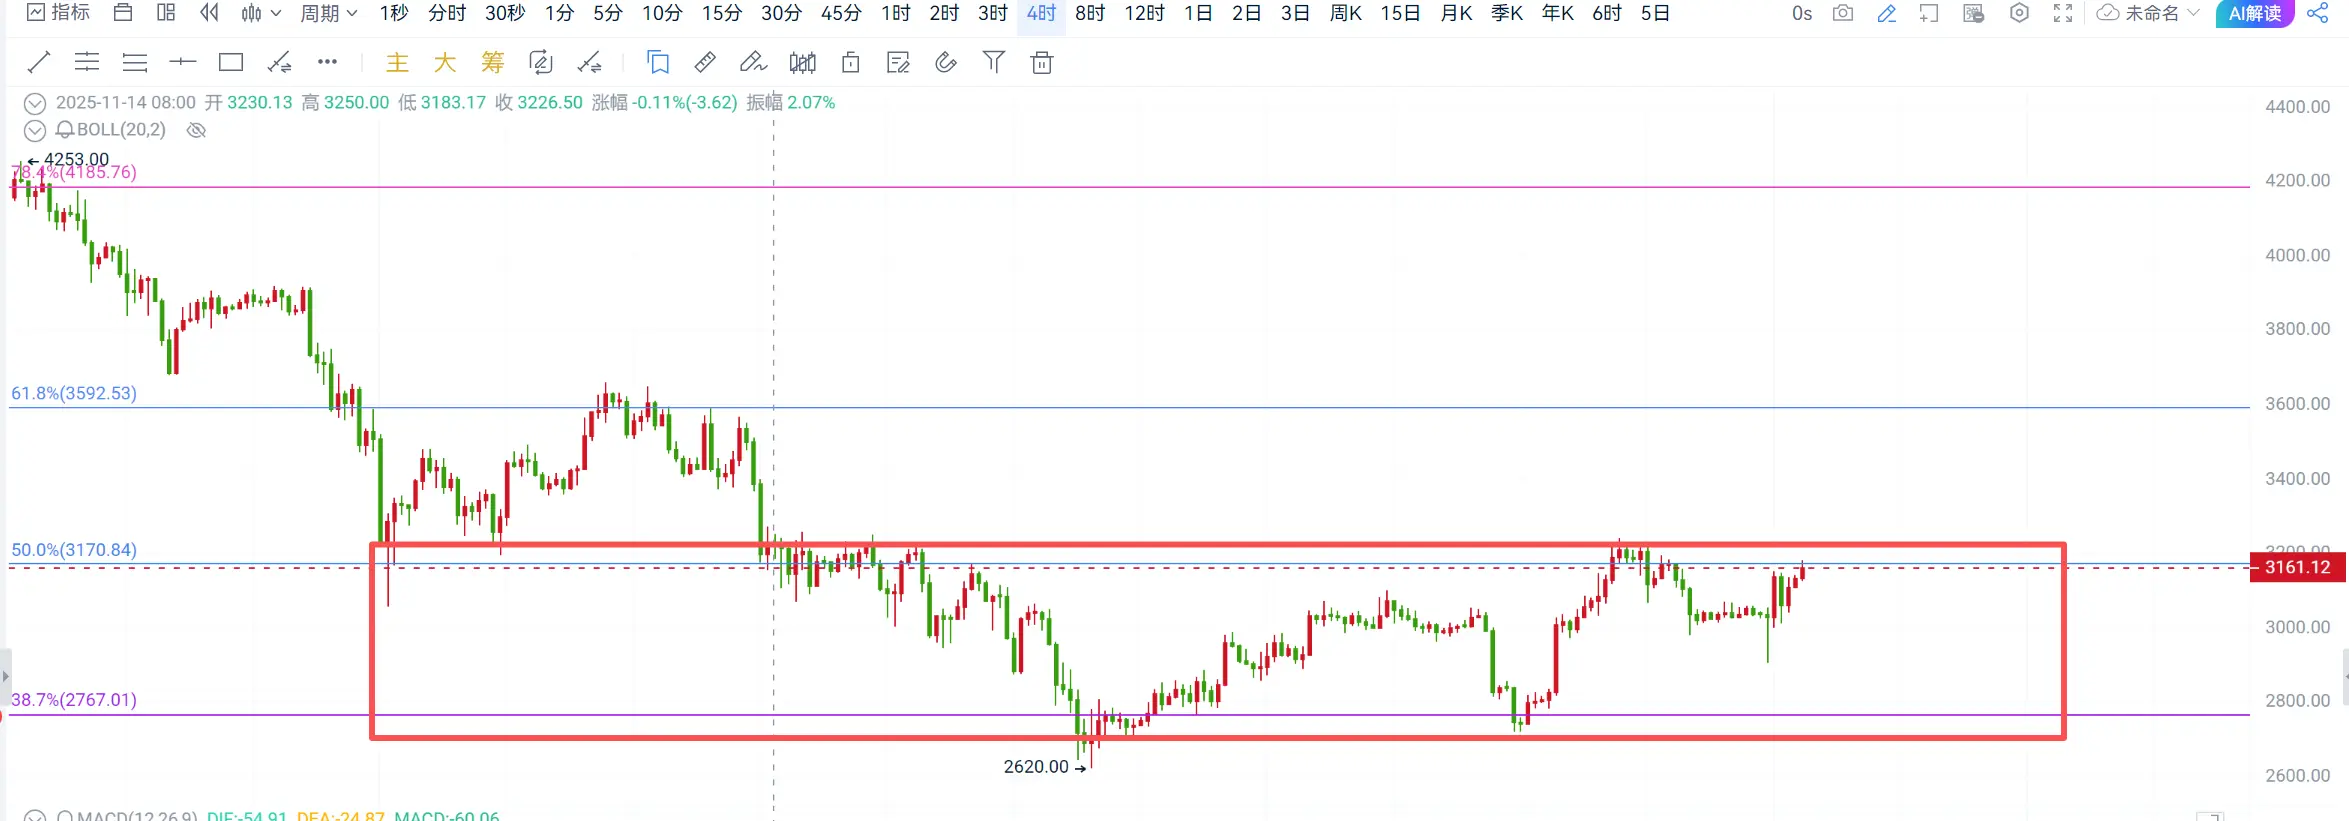
4-hour chart: Bitcoin shows signs of upward movement from the pattern. Breaking below the narrow range consolidation resistance at 90,000 could target 94,500. Ethereum has already broken above the narrow range consolidation resistance at 3,030 and can now aim for 3,230-3,400!
The current trend indicates a breakout. A pullback for long positions is possible afterward!
Trading ideas:
Buy Bitcoin at 89,000-89,500, target 90,500-92,000, stop below 88,000;
Buy Ethereum at 3,080-3,100, target 3,150-3,250, stop below 3,030;
Strategies are time-sensitive; specific guidance will be provided privately in real-time!