Trade
Basic
Futures
Futures
Hundreds of contracts settled in USDT or BTC
TradFi
Gold
Trade global traditional assets with USDT in one place
Options
Hot
Trade European-style vanilla options
Unified Account
Maximize your capital efficiency
Demo Trading
Futures Kickoff
Get prepared for your futures trading
Futures Events
Participate in events to win generous rewards
Demo Trading
Use virtual funds to experience risk-free trading
Earn
Launch
CandyDrop
Collect candies to earn airdrops
Launchpool
Quick staking, earn potential new tokens
HODLer Airdrop
Hold GT and get massive airdrops for free
Launchpad
Be early to the next big token project
Alpha Points
Trade on-chain assets and enjoy airdrop rewards!
Futures Points
Earn futures points and claim airdrop rewards
Investment
Simple Earn
Earn interests with idle tokens
Auto-Invest
Auto-invest on a regular basis
Dual Investment
Buy low and sell high to take profits from price fluctuations
Soft Staking
Earn rewards with flexible staking
Crypto Loan
0 Fees
Pledge one crypto to borrow another
Lending Center
One-stop lending hub
VIP Wealth Hub
Customized wealth management empowers your assets growth
Private Wealth Management
Customized asset management to grow your digital assets
Quant Fund
Top asset management team helps you profit without hassle
Staking
Stake cryptos to earn in PoS products
Smart Leverage
New
No forced liquidation before maturity, worry-free leveraged gains
GUSD Minting
Use USDT/USDC to mint GUSD for treasury-level yields
More
ASTROLABE
No content yet
ASTROLABE
【2026.02.04 #ETH Daily Market Research Report】
1️⃣ Key Support and Resistance
Upper focus area: Resistance Zone 1
Lower focus area: Support Zone 1
The above zones are current structural focus points used to observe the price stage but do not constitute specific trading points.
2️⃣ Intraday Trading Direction Observation
Based on the current ETH range structure, the following directional logic can be observed:
1. If ETH price continues to fluctuate within Resistance Zone 1 and Support Zone 1, the current oscillation logic may persist;
2. If the price breaks above around 2460 and is accompanied
ETH-5,2%
- Reward
- 1
- Comment
- Repost
- Share
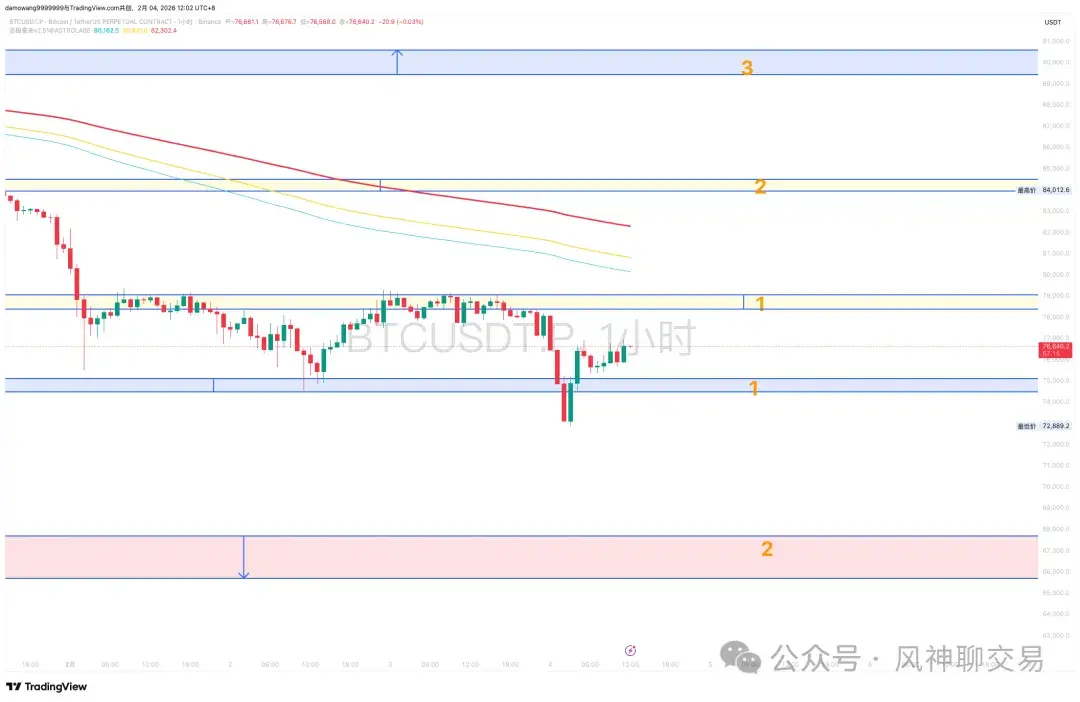
【2026.02.04 #BTC Daily Market Analysis Report】
1️⃣ Key Support and Resistance
Upper focus area: Short-term resistance zones 1 and 2. Important resistance zone 3.
Lower focus area: Important support zone 1, Resonance support zone 2. The above zones are current structural focus areas used to observe the stage of price movement; they do not represent specific trading points.
2️⃣ Intraday Trading Direction Observation
In the current BTC structural environment, the following directional logic can be observed:
1. If BTC continues to operate within support zone 1 and resistance zone 1, the oscillati
BTC-3,89%
- Reward
- 1
- Comment
- Repost
- Share
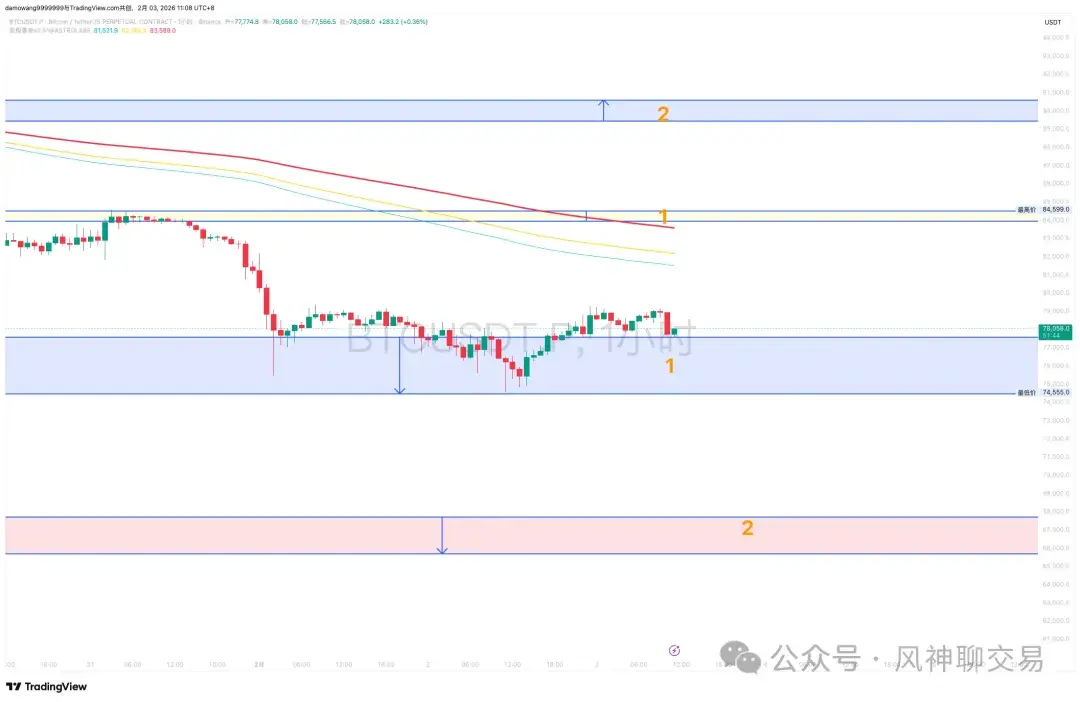
【2026.02.03 #BTC Daily Market Analysis Report】
1️⃣ Key Support and Resistance
Upper focus area: Zone 1 Resistance
Lower focus area: Zone 1 Support, with particular attention to Zone 2 Support.
The above zones are current structural focus areas, useful for observing the position and structural tightness of the price, but do not constitute any trading signals.
2️⃣ Intraday Trading Direction Observation
In the current BTC structural environment, the following directional logic can be observed:
1. If BTC continues to operate within Support Zone 1 and Resistance Zone 1, the oscillation structure m
BTC-3,89%
- Reward
- 1
- Comment
- Repost
- Share
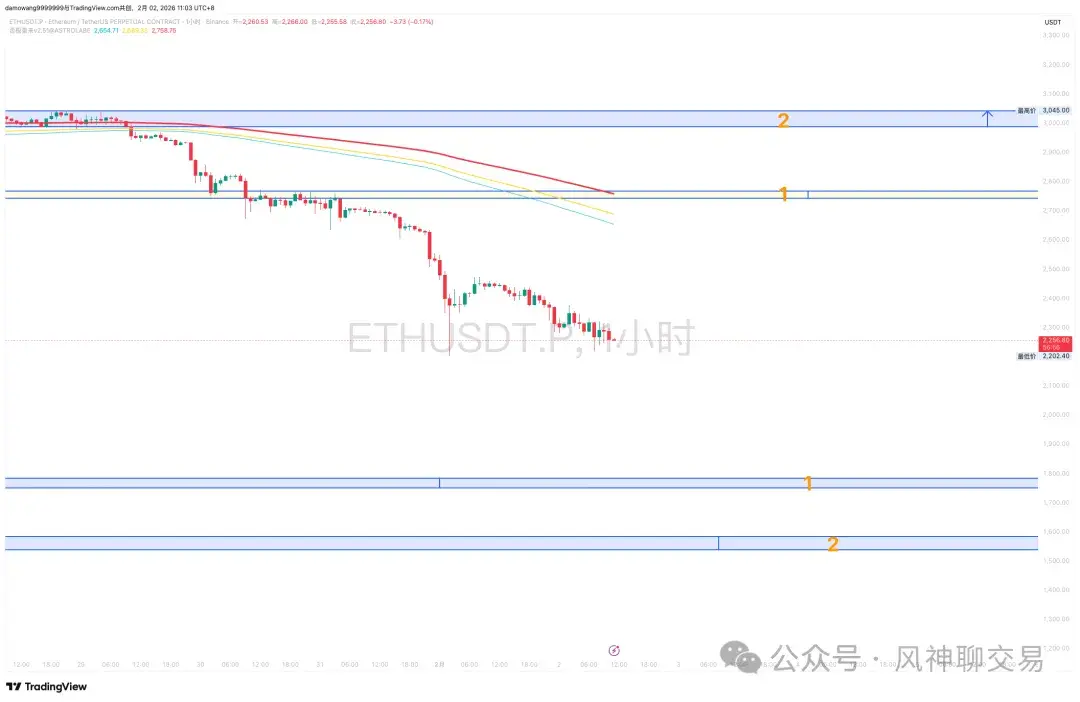
【2026.02.02 #ETH Daily Market Research Report】
1️⃣ Key Support and Resistance
Upper focus area: Resistance Zone 1
Lower focus area: Support Zone 1
The above zones are current structural focus points used to observe the price stage but do not constitute specific trading points.
2️⃣ Intraday Trading Direction Observation
Under the current ETH range structure, the following directional logic can be observed:
1. If ETH price continues to fluctuate within Resistance Zone 1 and Support Zone 1, the current oscillation logic may persist;
2. If the price breaks above around 2460 and is accompanied by
ETH-5,2%
- Reward
- 2
- 1
- Repost
- Share
GateUser-95194dd2:
Paying Close Attention🔍【2026.02.02 #BTC Daily Market Research Report】
1️⃣ Key Support and Resistance
Upper focus area: Resistance Zone 1
Lower focus area: Support Zone 1, with particular attention to Support Zone 2.
The above zones are current structural focus areas, useful for observing the position and structural tightness of the price, but do not constitute any trading signals.
2️⃣ Intraday Trading Direction Observation
Under the current BTC structural environment, the following directional logic can be observed:
1. If BTC continues to operate within Support Zone 1 and Resistance Zone 1, the oscillation structur
BTC-3,89%
- Reward
- 1
- Comment
- Repost
- Share
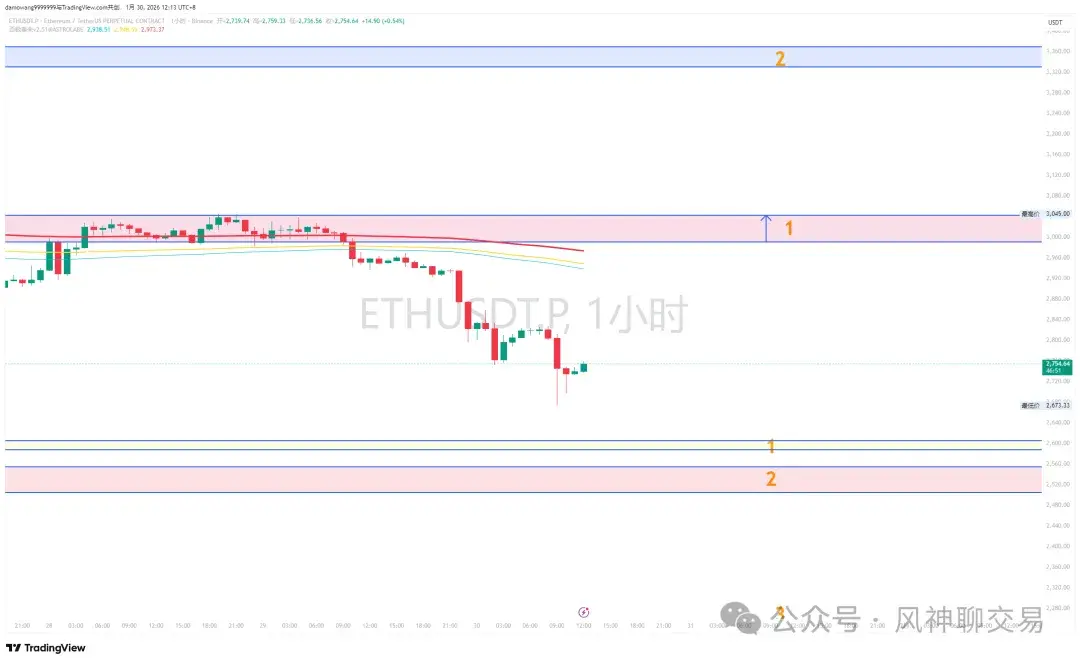
#ETH Daily Market Research Report
1️⃣ Key Support and Resistance
Upper focus area: Zone 1 Resistance (Resonance Resistance)
Lower focus areas: Zone 1 Support (Short-term Support), Zone 2 Support (Resonance Support)
The above zones are current structural focus points used to observe the price's structural range; they do not represent specific trading points.
2️⃣ Intraday Trading Direction Observation
Within the current ETH range structure, the following directional logic can be observed:
1. If ETH continues to hold Zone 2 Support and Zone 1 Resistance, the range logic may persist;
2. If the pr
ETH-5,2%
- Reward
- 1
- Comment
- Repost
- Share
#BTC Daily Intraday Market Research Report
1️⃣ Key Support and Resistance
Upper focus area: Resistance Zone 1 (short-term resistance) and Resistance Zone 2, which is an important resonance resistance zone (.
Lower focus area: Important Support Zone 1
The above zones represent current structural focus points, used to understand the price's structural range, and do not constitute specific trading signals.
2️⃣ Intraday Trading Direction Observation
In the current structural environment, the following directional logic can be observed:
1. If BTC price remains within Resistance Zone 1 and Support
BTC-3,89%
- Reward
- 1
- Comment
- Repost
- Share
#ETH Daily Market Analysis Report
1️⃣ Key Support and Resistance
ETH today’s main price probabilities are concentrated in the support zone 1 and resistance zone 1, indicating a high market consensus on this broad range of oscillation.
Upper focus area: Resistance zone 1
Lower focus area: Support zone 1
The above ranges are current structural reference zones, used to understand the position of the price and do not constitute trading points.
2️⃣ Intraday Trading Direction Observation
Within the current ETH range structure, the following directional logic can be observed: if ETH price continues
ETH-5,2%
- Reward
- 1
- 2
- Repost
- Share
已亏9320UIHaveLost9,320UsdSo :
:
Who doesn't know how to fart?View More
#BTC Daily Market Analysis Report
1️⃣ Key Support and Resistance
Based on the market-provided interval probability distribution data, BTC price is mainly concentrated within the support zone 2 and resistance zone 1, with the middle interval showing a relatively higher concentration. Currently, it remains in this zone oscillation pattern.
Upper focus area: Resistance zone 1
Lower focus area: Support zone 1
The above zones are current structural focus areas used to observe price position and zone behavior, and do not represent any specific trading signals.
2️⃣ Intraday Trading Direction Observa
BTC-3,89%
- Reward
- 1
- Comment
- Repost
- Share
Intraday Analysis
1️⃣ Current Market Status
The current rapid shakeout movements are quite frequent. Therefore, the opportunity to jump in is fleeting. Based on the overall trend, I still lean towards my initial trading plan.
2️⃣ Key Levels
1. Major Support: Support Zone 1 and Support Zone 3 are the primary support levels.
2. Major Resistance: Resistance Zone 2 and Resistance Zone 3 are the key failure points for resistance.
3. Bullish Failure Level: Break below Support Zone 1.
4. Bearish Failure Level: Break above Resistance Zone 1.
3️⃣ Daily Directional Strategy
Bearish Strategy
1. Condition
ETH-5,2%
- Reward
- 1
- Comment
- Repost
- Share
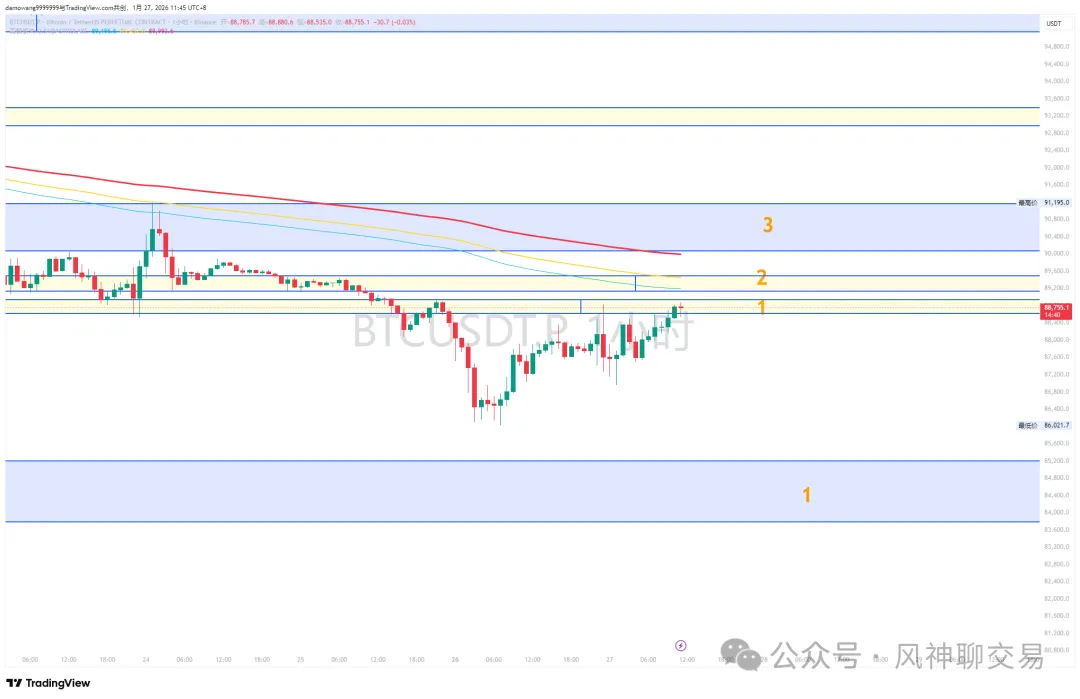
#BTC Intraday Analysis
1️⃣ The current market condition shows that BTC's overall structure remains weak recently. The price has not been able to effectively stabilize above 91,500, continuing the recent oscillating downward trend. However, caution is advised for a potential bullish rebound.
2️⃣ Key support levels and main resistance zones: Support Zone 1; Short-term resistance zones: Zone 1 and Zone 2; Major resistance zone: Zone 3. Critical failure points: Bearish invalidation occurs if the price breaks below Support Zone 1; Bullish invalidation occurs if the price breaks above Resistance Zo
BTC-3,89%
- Reward
- 1
- Comment
- Repost
- Share
#ETH Intraday Analysis
1️⃣ Structure Interpretation
ETH today shows a sideways trend with slight weakness, following BTC's synchronized decline. During significant BTC pullbacks, ETH mostly does not demonstrate independent rebound strength. For the bulls' counterattack, patience is required.
2️⃣ Capital Flow & On-Chain & Exchange Dynamics Observation
1. Based on available on-chain and exchange data:
2. No extreme capital outflows (such as large transfers to exchanges) or concentrated inflows have been observed in the past 24 hours for ETH;
3. No publicly verifiable data indicates large-scale
View Original1️⃣ Structure Interpretation
ETH today shows a sideways trend with slight weakness, following BTC's synchronized decline. During significant BTC pullbacks, ETH mostly does not demonstrate independent rebound strength. For the bulls' counterattack, patience is required.
2️⃣ Capital Flow & On-Chain & Exchange Dynamics Observation
1. Based on available on-chain and exchange data:
2. No extreme capital outflows (such as large transfers to exchanges) or concentrated inflows have been observed in the past 24 hours for ETH;
3. No publicly verifiable data indicates large-scale
- Reward
- 1
- Comment
- Repost
- Share
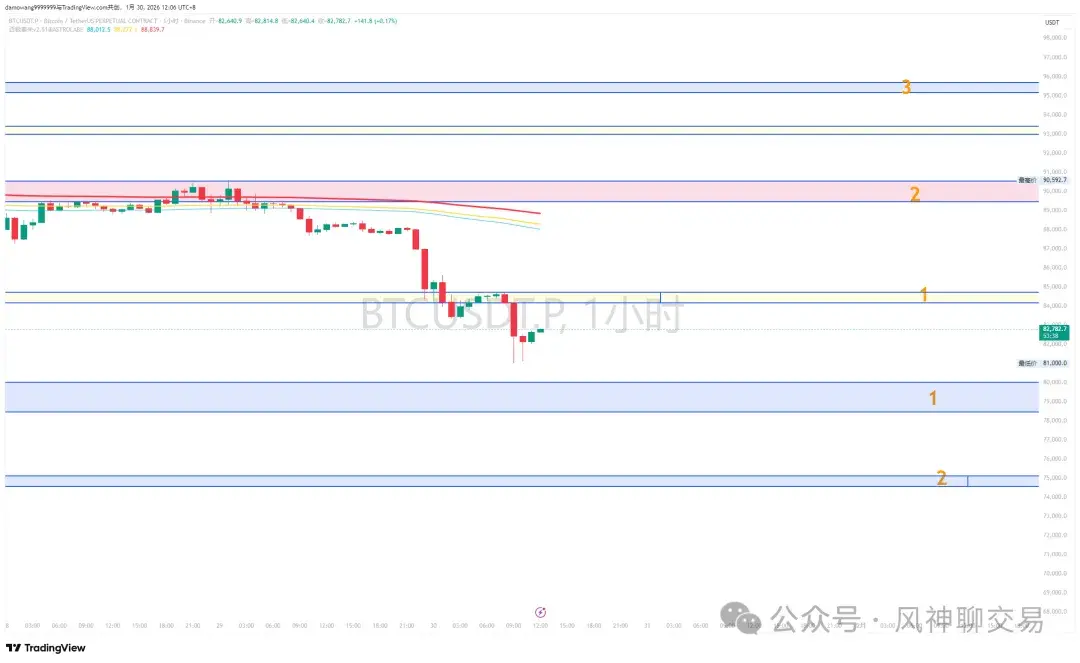
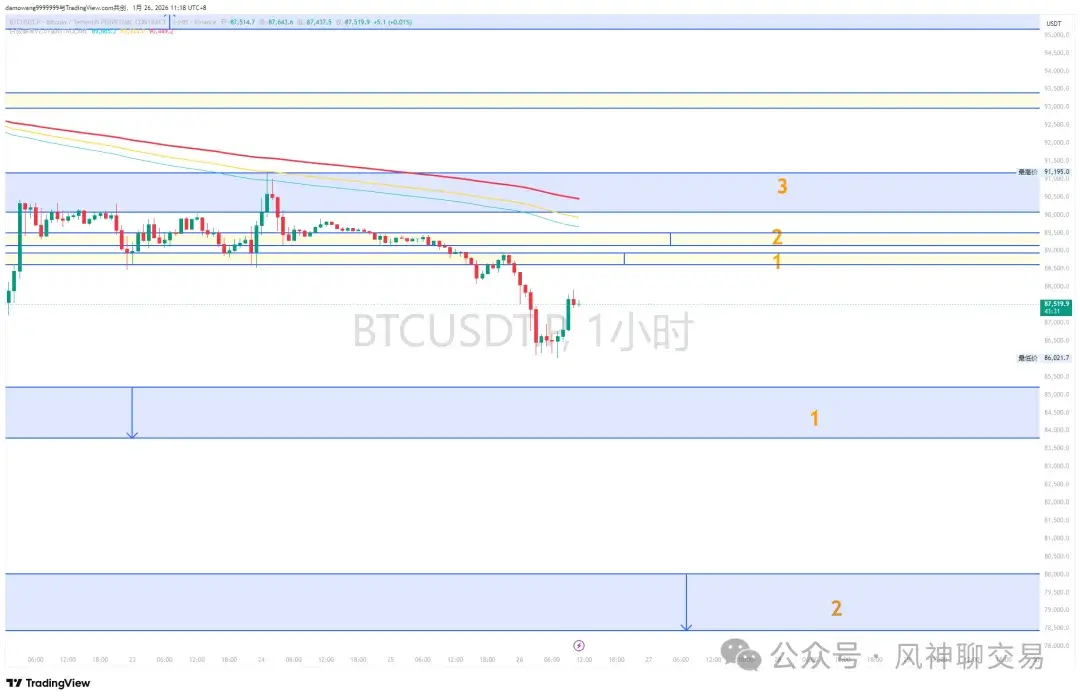
#BTC Intraday Analysis
1️⃣ Structural Interpretation
BTC once dropped to around 86,000, then showed signs of rebound, but the overall short-term structure remains significantly weak. According to historical market statistics, BTC recently touched a low of approximately 86,003 USD, while recent highs approached around 98,000. This indicates that the price fluctuation range has changed.
From the current market structure:
- Resistance is clearly located at the 3rd resistance zone, with multiple upward tests failing to establish a solid footing;
- Support is around the 1st support zone;
- The pri
BTC-3,89%
- Reward
- 1
- Comment
- Repost
- Share
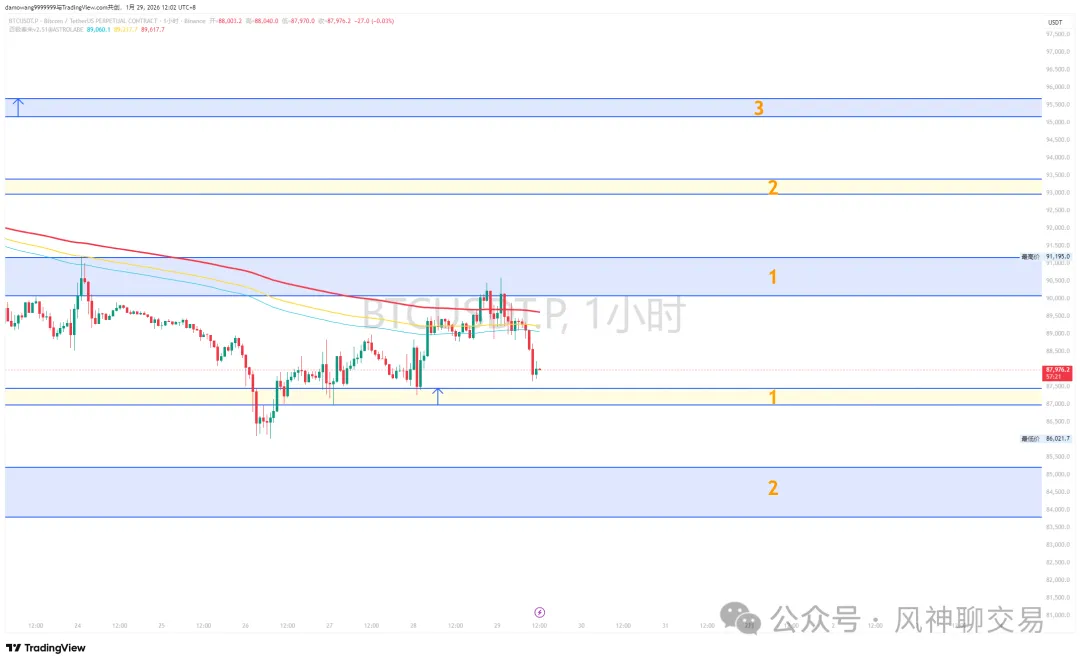
#BTC Intraday Analysis
1️⃣ Structure Interpretation
Bitcoin's current price fluctuates around $89,700, maintaining mostly near $90,000 throughout the day. Overall, it appears slightly pressured compared to previous days. Recent market sentiment is related to political risk events, while the rise of safe-haven assets like gold and silver also exerts pressure on BTC. Current price action characteristics: BTC consolidates in the $88,000–$90,000 range, unable to clearly break above resistance; after a previous pullback, short-term bullish and bearish forces are testing the structure repeatedly, r
BTC-3,89%
- Reward
- 1
- Comment
- Repost
- Share
#ETH Intraday Analysis
1️⃣ Structure Interpretation
Last night, Ethereum experienced a rapid decline followed by a V-shaped rebound. Although the current price has not yielded significant profits for us, the upward momentum is relatively active. Regarding the current intraday trend, my personal view leans towards continuing to watch for a rebound. We all understand one thing clearly: we are operating against the trend, so our position management should be cautious rather than heavily leveraged.
2️⃣ Capital Flow & On-Chain & Exchange Dynamics Observation
Similar to BTC, ETH has not shown clear
View Original1️⃣ Structure Interpretation
Last night, Ethereum experienced a rapid decline followed by a V-shaped rebound. Although the current price has not yielded significant profits for us, the upward momentum is relatively active. Regarding the current intraday trend, my personal view leans towards continuing to watch for a rebound. We all understand one thing clearly: we are operating against the trend, so our position management should be cautious rather than heavily leveraged.
2️⃣ Capital Flow & On-Chain & Exchange Dynamics Observation
Similar to BTC, ETH has not shown clear
- Reward
- 1
- Comment
- Repost
- Share
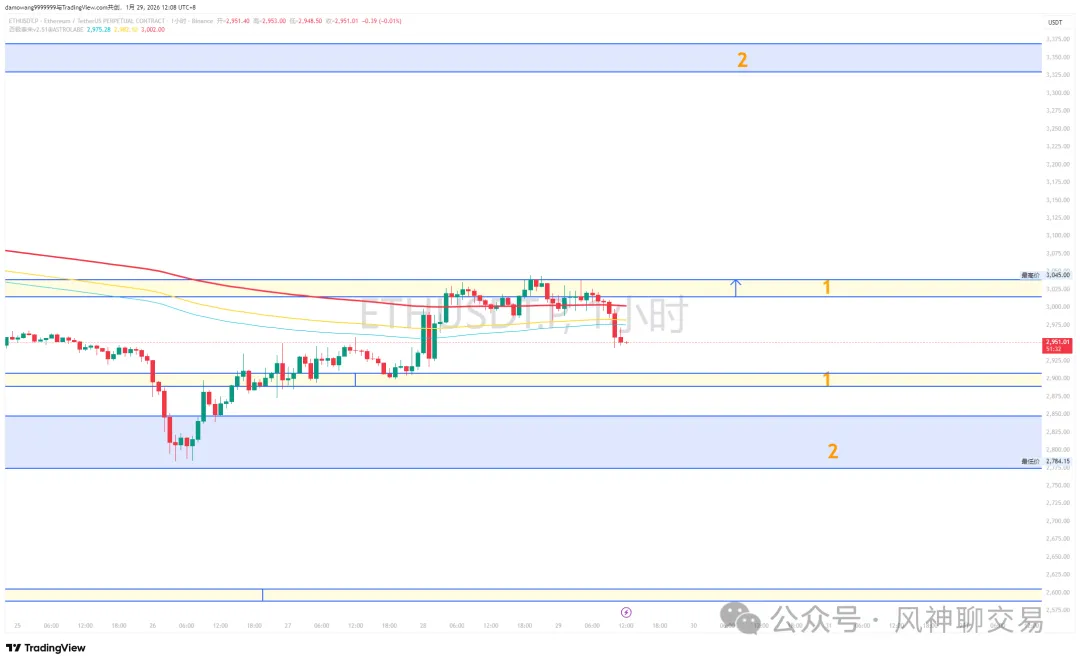
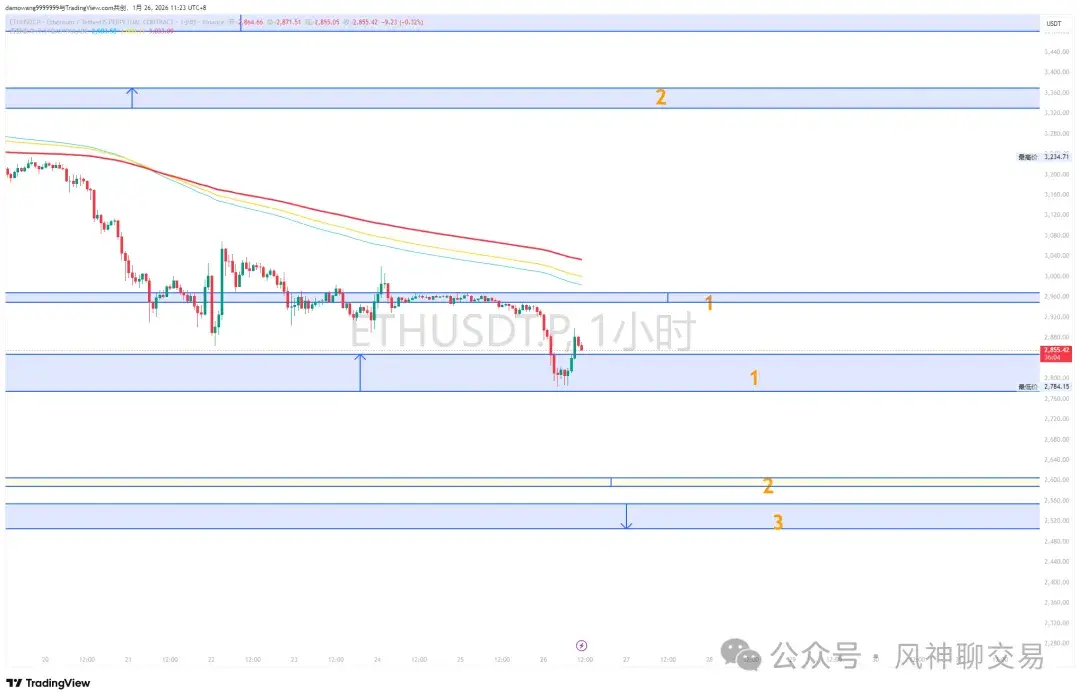
#ETH Intraday Analysis
1️⃣ Structural Interpretation
ETH current price is around 3000, with recent price movements oscillating in the same direction as BTC under pressure. ETH broke below 3120 and remained below, indicating continued short-term weakness. My personal view is that for those holding long positions with poor entry points, the aggressive moves we discussed in the live broadcast can gradually lower the cost basis. I have been emphasizing this week that current operations should be contrarian and avoid heavy positions. Those who have made mistakes in this regard should reflect on th
View Original1️⃣ Structural Interpretation
ETH current price is around 3000, with recent price movements oscillating in the same direction as BTC under pressure. ETH broke below 3120 and remained below, indicating continued short-term weakness. My personal view is that for those holding long positions with poor entry points, the aggressive moves we discussed in the live broadcast can gradually lower the cost basis. I have been emphasizing this week that current operations should be contrarian and avoid heavy positions. Those who have made mistakes in this regard should reflect on th
- Reward
- 1
- Comment
- Repost
- Share
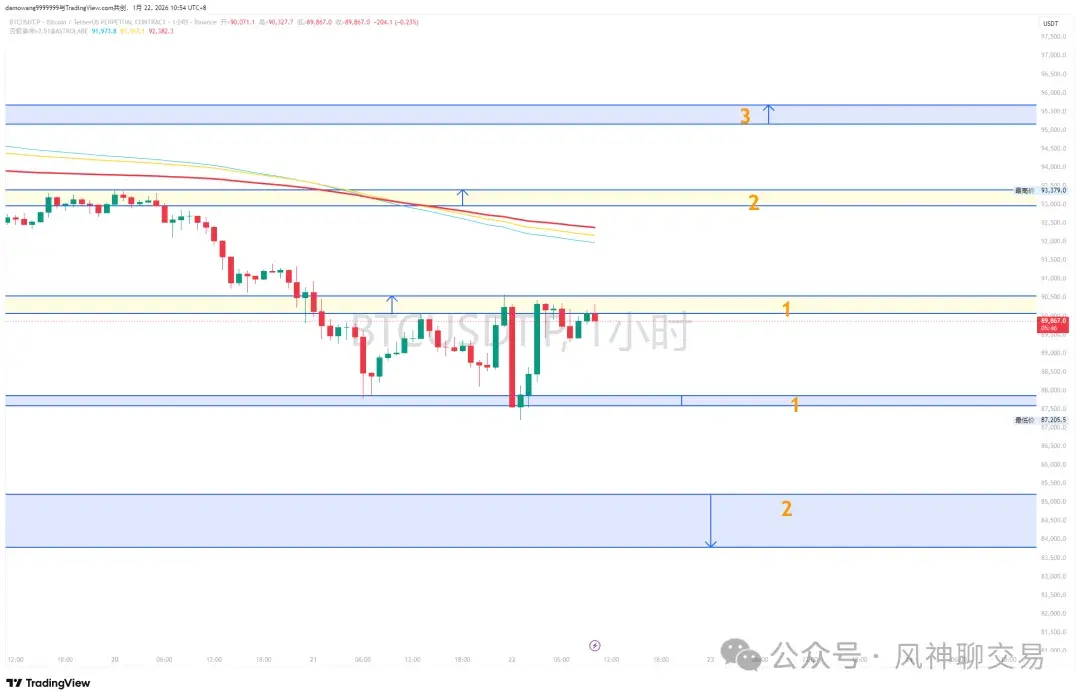
#BTC Intraday Analysis
1️⃣ Structural Interpretation
Currently, Bitcoin's price is around 90,000 USD. Recently, the overall trend has been weak, but it remains above 90,000. Meanwhile, a clear reversal by the bulls still requires confirmation of stronger momentum.
From a structural perspective:
Short-term weak consolidation: Bitcoin continues to face downside pressure before establishing above 90,000;
Obvious resistance above: The nearby resistance is around the 1st pressure zone, and breaking through this level requires volume support;
Multiple support tests below: Testing the lower range wi
BTC-3,89%
- Reward
- 1
- Comment
- Repost
- Share
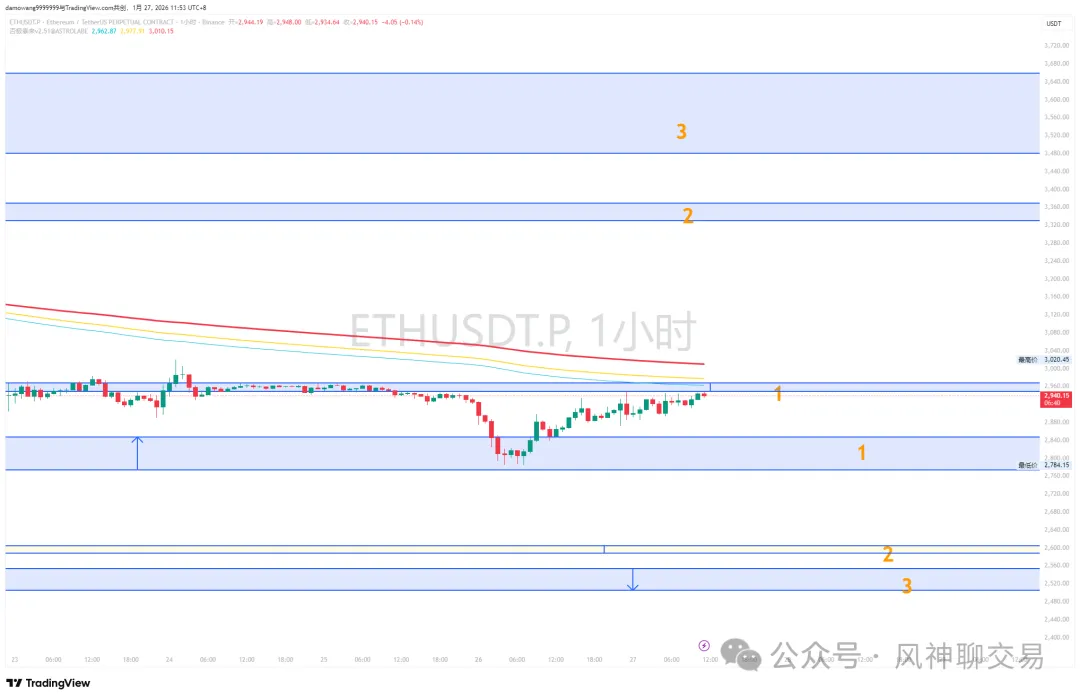
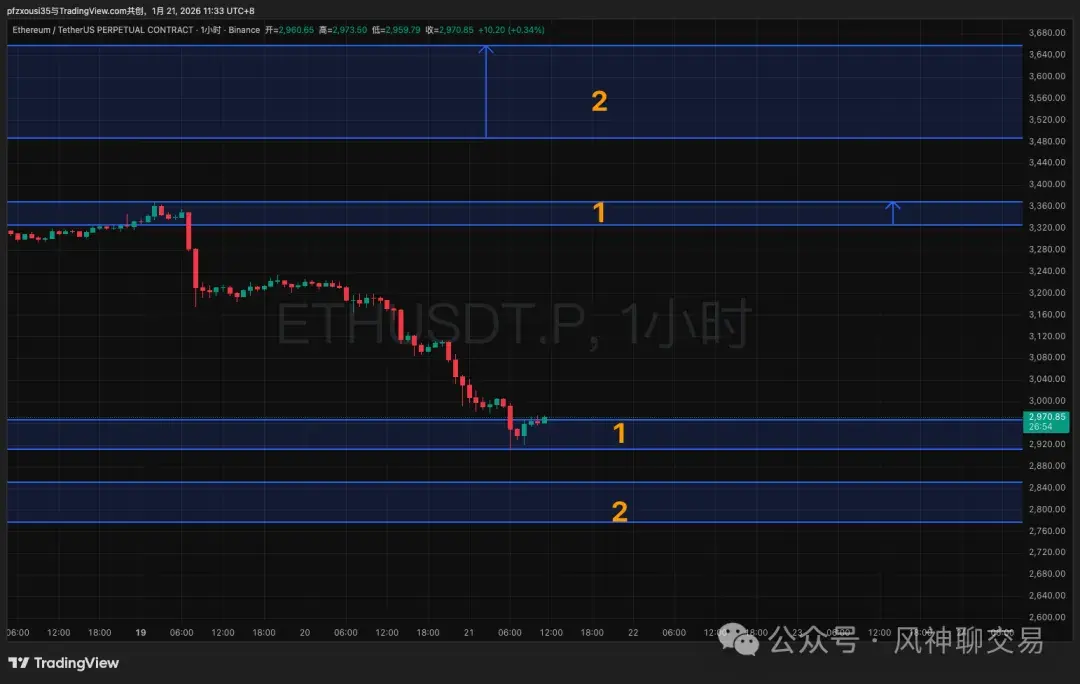
#ETH Intraday Analysis
1️⃣ Structure Interpretation
Ethereum ultimately reached the support zone 2 that we referenced yesterday and rebounded from there. Currently, the price is around 2970. For this kind of decline, our plan indicates that there was some expectation here. Unfortunately, we were sleeping during the decline and did not add to our position at the lowest point. Let’s see if today can provide two entry opportunities. To clarify again, the current market is a bearish market, and our attempt to go long is a contrarian move. Therefore, our position size should not be heavy.
2️⃣ Capi
View Original1️⃣ Structure Interpretation
Ethereum ultimately reached the support zone 2 that we referenced yesterday and rebounded from there. Currently, the price is around 2970. For this kind of decline, our plan indicates that there was some expectation here. Unfortunately, we were sleeping during the decline and did not add to our position at the lowest point. Let’s see if today can provide two entry opportunities. To clarify again, the current market is a bearish market, and our attempt to go long is a contrarian move. Therefore, our position size should not be heavy.
2️⃣ Capi
- Reward
- 1
- Comment
- Repost
- Share
#BTC Intraday Analysis
1️⃣ Structural Interpretation
Bitcoin's price today clearly weakened, briefly approaching around 95,000, then sharply falling back and dropping to approximately 88,000. It later experienced a slight rebound, with the current price around 89,000. From a structural perspective:
• Strong resistance above: encountering heavy selling pressure near the 90,000 level;
• Weak support below: rapid decline to around 88,000, short-term support is unstable;
• The overall daily rhythm leans towards a retracement and consolidation: reflecting increased short-term bearish momentum, lea
BTC-3,89%

- Reward
- 2
- Comment
- Repost
- Share
Trending Topics
View More20.88K Popularity
12.22K Popularity
11.78K Popularity
3.74K Popularity
7.32K Popularity
Pin