Trade
Basic
Futures
Futures
Hundreds of contracts settled in USDT or BTC
Options
HOT
Trade European-style vanilla options
Unified Account
Maximize your capital efficiency
Demo Trading
Futures Kickoff
Get prepared for your futures trading
Futures Events
Participate in events to win generous rewards
Demo Trading
Use virtual funds to experience risk-free trading
Earn
Launch
CandyDrop
Collect candies to earn airdrops
Launchpool
Quick staking, earn potential new tokens
HODLer Airdrop
Hold GT and get massive airdrops for free
Launchpad
Be early to the next big token project
Alpha Points
NEW
Trade on-chain assets and enjoy airdrop rewards!
Futures Points
NEW
Earn futures points and claim airdrop rewards
Investment
Simple Earn
Earn interests with idle tokens
Auto-Invest
Auto-invest on a regular basis
Dual Investment
Buy low and sell high to take profits from price fluctuations
Soft Staking
Earn rewards with flexible staking
Crypto Loan
0 Fees
Pledge one crypto to borrow another
Lending Center
One-stop lending hub
VIP Wealth Hub
Customized wealth management empowers your assets growth
Private Wealth Management
Customized asset management to grow your digital assets
Quant Fund
Top asset management team helps you profit without hassle
Staking
Stake cryptos to earn in PoS products
Smart Leverage
NEW
No forced liquidation before maturity, worry-free leveraged gains
GUSD Minting
Use USDT/USDC to mint GUSD for treasury-level yields
More
HuXijin
No content yet
HuXijin
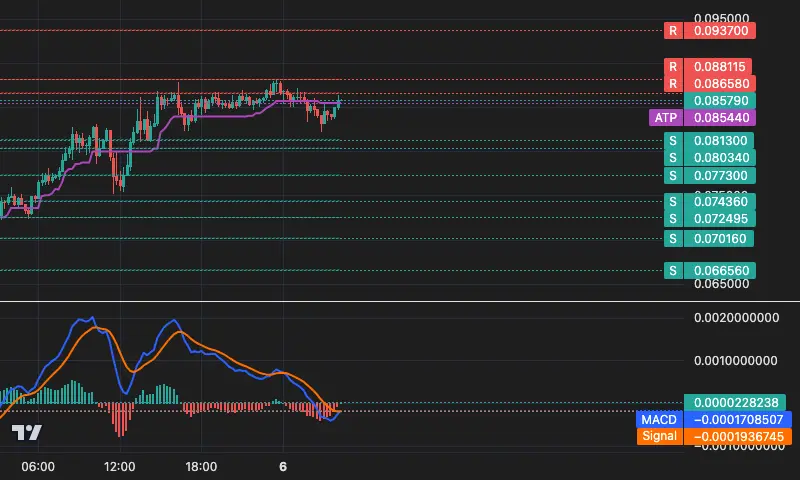
📊 COLLECT/USDT 15m Technical Overview
💰 Current Price: 0.08579 ( Trend initiation +3.17%)
📈 Trend: **Suspected trend reversal** | 6 K-lines in operation
🎯 Tracking line: 0.08544 ( Dynamic support/stop-loss reference )
Key levels:
Support 0.08130 / 0.08034
Resistance 0.08658 / 0.08811
Strategy: The price has rebounded above the dynamic stop-loss line, and the bearish trend faces a severe test. If it stabilizes above 0.08544, it may challenge the resistance at 0.08658.
Risk: The price is still below the key resistance. If it cannot break through effectively, the bearish trend may continue.
View Original
- Reward
- 1
- Comment
- Repost
- Share
📊 STORJ 15-Minute Technical Overview
💰 Current Price: 0.1465 ( No Change )
📈 Trend: Bullish trend initiated | 1K candles completed
🎯 Tracking Line: 0.1450 ( Dynamic Stop-Loss Reference )
Key Levels:
Support 0.1426 / 0.1341 / 0.1328
Resistance 0.1488 / 0.1616
Strategy: If the price stabilizes above the tracking line, consider entering in the direction of the trend, with stop-loss below 0.1448.
Risk: The trend has just started, momentum needs to be confirmed. If the price falls below the tracking line, the trend may fail.
STORJ13,45%
- Reward
- 1
- Comment
- Repost
- Share
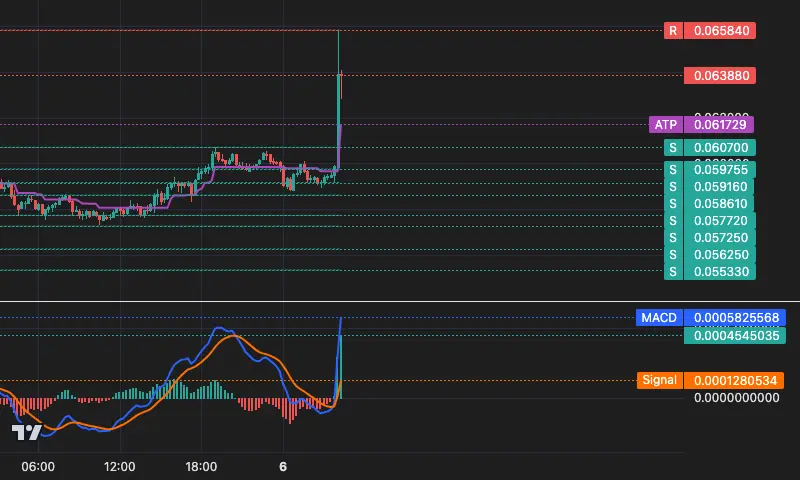
📊 $SYN 15-Minute Technical Overview
💰 Current Price: 0.06388 ( Flat )
📈 Trend: Early Bullish Phase | 1 K-line in operation
🎯 Tracking Line: 0.06173 ( Dynamic Stop-Loss Reference )
Key Levels:
Support 0.05976 / 0.05916 / 0.05861
Resistance 0.06584
Strategy: Price has just stabilized above the new trend line, bullish intraday. If it retraces without breaking below 0.06173, consider it an opportunity.
Risk: The trend is based on only 1 K-line, indicating instability. The current price is very close to the 0.06584 resistance; beware of a quick pullback after a rise. 🔥 A new trend has begun,
SYN2,45%
- Reward
- 1
- 1
- Repost
- Share
EarningsComeFromAllDirections, :
:
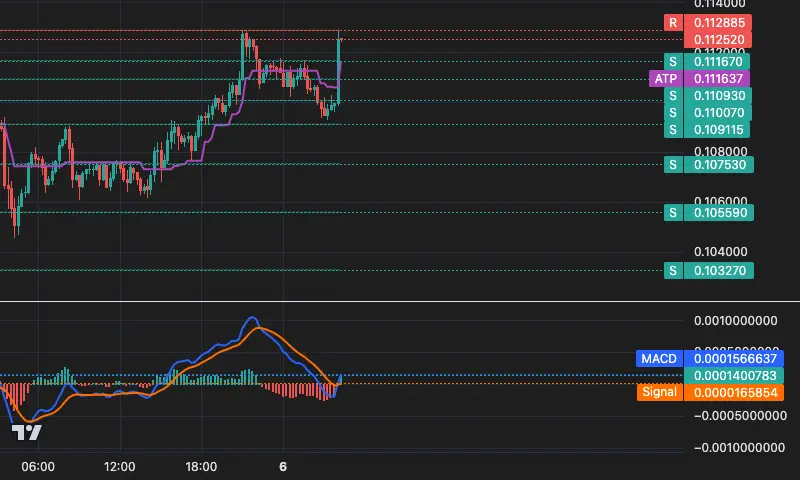
2026 Go Go Go 👊 📊 PARTI 15-Minute Technical Overview
💰 Current Price: 0.11252 ( Not yet突破启动价)
📈 Trend: Bullish trend initiated🟢 | Just crossed 1 candlestick
🎯 Tracking Line: 0.11164 ( Dynamic stop-loss reference)
Key Levels:
Support 0.11288 ( Recently) / 0.11167
Resistance: No nearby resistance
Strategy: Current price closely follows the initiation price, consider a small long position relying on the latest support at 0.11167 to attempt a bullish move and accelerate the trend.
Risk: The trend is very fragile at its inception! Retracement has already exceeded 1x ATR. If the trend line at 0.11164 is broke
PARTI1,59%
- Reward
- like
- Comment
- Repost
- Share
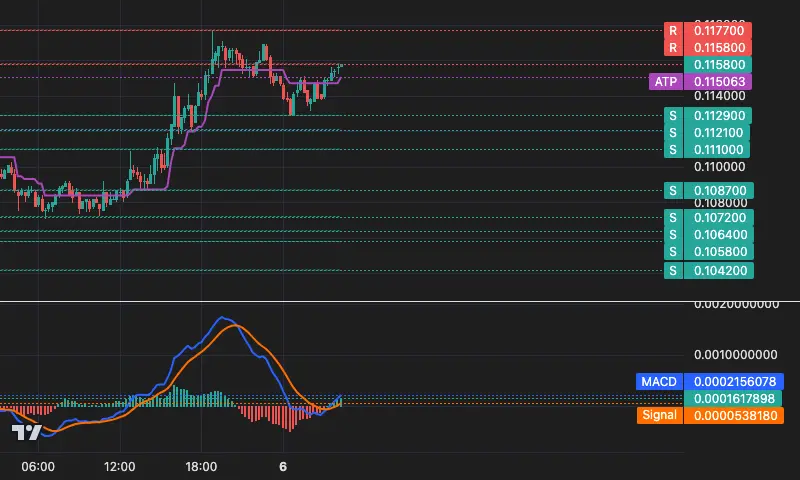
📊 FLUX 15m Technical Overview
💰 Current Price: 0.1158 (0.0%)
📈 Trend: Bullish trend established | Just started
🎯 Dynamic Stop-Loss Line: 0.1151 **Hold steady for a chance!**
Key Levels:
Support 0.1147 / 0.1129 / 0.1121
Resistance 0.1158 (which is current) / 0.1177
Strategy: Recently broke through the sideways trading zone, the current price retesting and confirming support (around 0.1151) can consider entering in the direction of the trend. Target towards 0.1177.
Risk: The market has just started, small fluctuations, closely monitor the 0.1147-0.1151 area. If it breaks below 0.1147, the r
FLUX6,02%
- Reward
- like
- Comment
- Repost
- Share
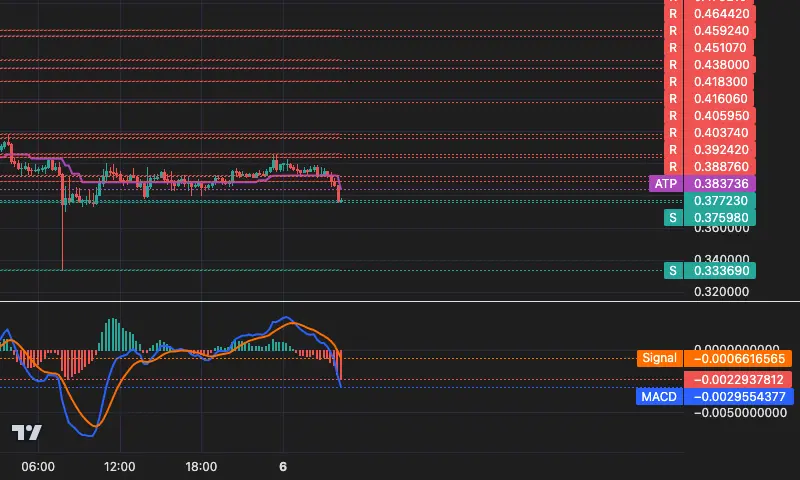
📊 RAVE/USDT 15min Technical Overview
💰 Current Price: 0.37723 (+0.13%)
📈 Trend: Bearish trend continues | 1K candles in operation
🎯 Tracking Line: 0.38374 ( Dynamic Resistance/Stop Loss Reference )
Key Levels:
Support 0.37598 / 0.33369
Resistance 0.38876 / 0.39242 / 0.40374
Strategy: When the price rebounds and encounters resistance below the tracking line, consider shorting on rallies. If it breaks below the previous low of 0.37598, the trend accelerates.
Risk: Currently, the rebound is weak, but it is above the entry price. A strong breakthrough of 0.38374 warrants cautio
RAVE-17,7%
- Reward
- like
- Comment
- Repost
- Share
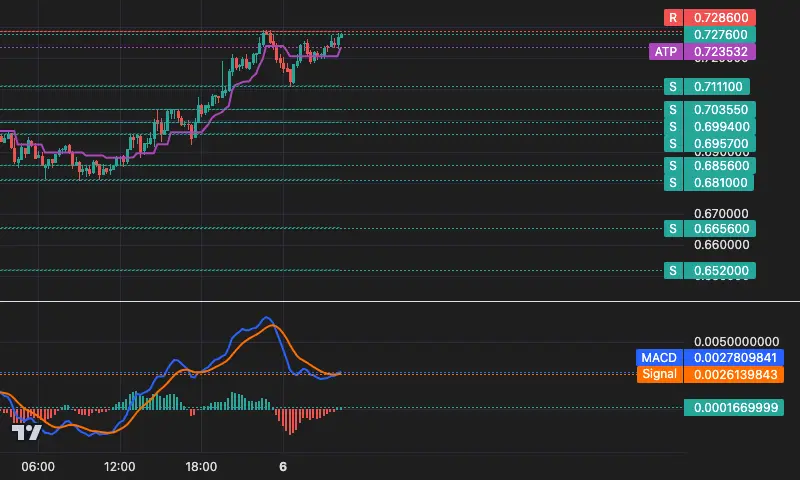
📊 $RLC 15-Minute Technical Overview
💰 Current Price: 0.7276 ( Up +0%)
📈 Trend: **Bullish trend begins** | 1K candles in operation
🎯 Tracking Line: 0.7235 ( Dynamic support/stop-loss reference )
Key levels:
Support 0.7206 / 0.7111 / 0.7036
Resistance 0.7286 ( Immediate resistance! )
Strategy: The trend is just forming, and the price is close to the entry point. Consider using the tracking line as a stop-loss and try a long position with a small amount. The first target is the resistance at 0.7286.
Risk: The trend has just started, and its strength needs to be verified. If it falls below the
RLC5,6%
- Reward
- like
- Comment
- Repost
- Share
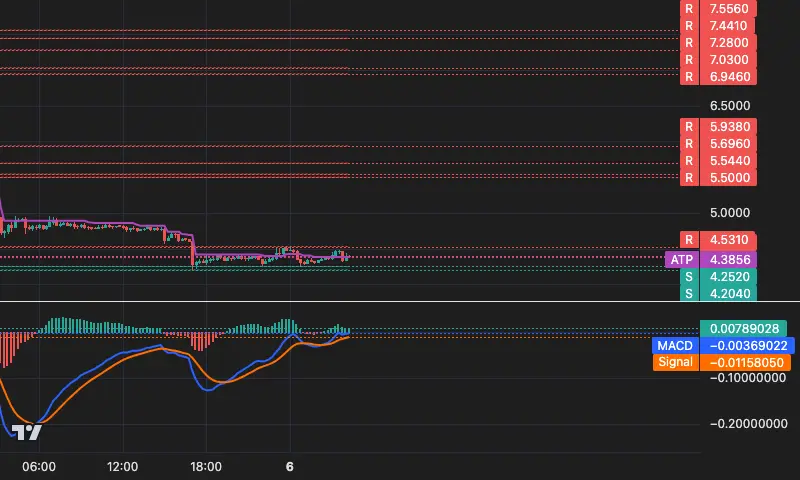
📊 OG 15-Minute Technical Overview
💰 Current Price: 4.398 (+2.30%)
📈 Trend: Bearish trend continues | 13 K-line candles have been formed, but the price has rebounded 🚨
🎯 Tracking Line: 4.386 ( Dynamic Stop Loss Reference )
Key Levels:
Support 4.386 / 4.252 / 4.204
Resistance 4.484 ( High of this rebound) / 4.531
Strategy: Price has broken above the tracking line but remains in an overall downtrend channel. A break below 4.386 could be seen as a return to a bearish trend, while a breakthrough above 4.484 may indicate a trend reversal.
Risk: The price has already risen from the trend initiat
OG-11,62%
- Reward
- like
- Comment
- Repost
- Share
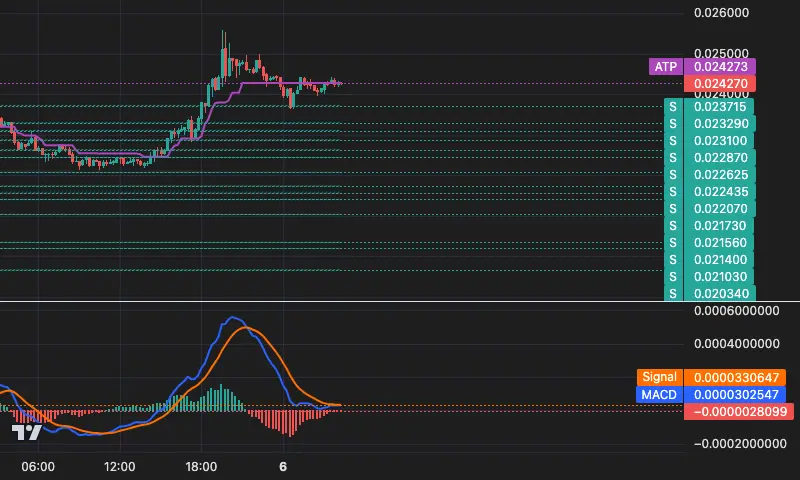
📊 VELODROME 15-Minute Technical Overview
💰 Current Price: 0.02427 (+5.16%)
📈 Trend: Upward trend continues, but touching the trailing line | 50 K-lines have been run
🎯 Trailing Line: 0.02427 ( Dynamic stop-loss reference )
Key Levels:
Support 0.02287 / 0.02329 / 0.02371
Resistance: Recent high at 0.02558
Strategy: The current price overlaps with the trailing line, beware of a break below! If it stabilizes, consider holding for a potential move towards the previous high; a break below the trailing line may indicate trend stagnation or reversal.
Risk: Price is testing the dynamic support, an
VELODROME6,6%
- Reward
- like
- Comment
- Repost
- Share
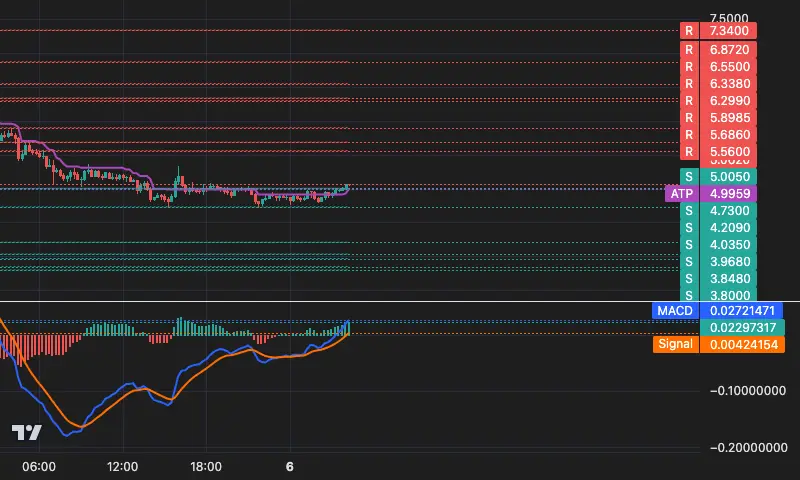
📊 MYX 15-Minute Technical Overview
💰 Current Price: 5.062 ( Same as Entry Price )
📈 Trend: Bullish continuation | 2K candles run
🎯 Tracking Line: 4.996 ( Dynamic Stop-Loss Reference )
Key Levels:
Support 5.005 / 4.730 / 4.209
Resistance 5.560 / 5.686 / 5.899
Strategy: Holding long positions is still valid; maintain based on the tracking line as a dynamic support. For new positions, consider a light long position above the 5.0-5.005 support zone.
Risk: Recently retraced from a high of 5.072; monitor whether the current price can hold steady. The current price is slightly above the stop-los
View Original💰 Current Price: 5.062 ( Same as Entry Price )
📈 Trend: Bullish continuation | 2K candles run
🎯 Tracking Line: 4.996 ( Dynamic Stop-Loss Reference )
Key Levels:
Support 5.005 / 4.730 / 4.209
Resistance 5.560 / 5.686 / 5.899
Strategy: Holding long positions is still valid; maintain based on the tracking line as a dynamic support. For new positions, consider a light long position above the 5.0-5.005 support zone.
Risk: Recently retraced from a high of 5.072; monitor whether the current price can hold steady. The current price is slightly above the stop-los
- Reward
- like
- Comment
- Repost
- Share
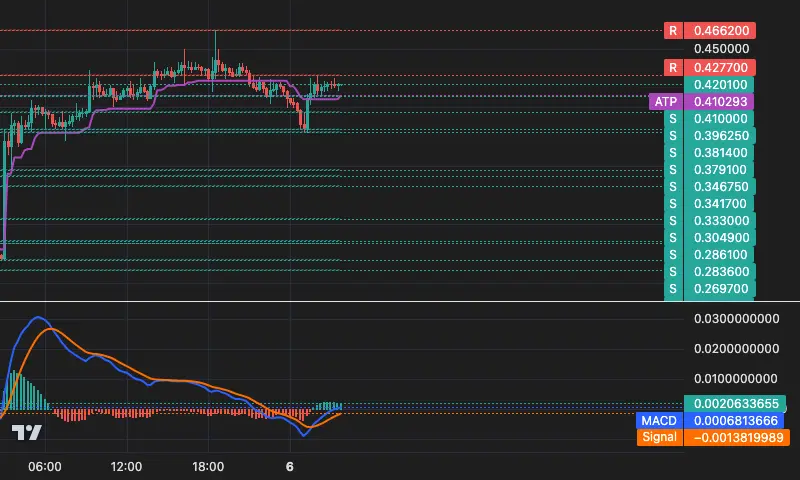
📊 CLO 15m Technical Overview
💰 Current Price: 0.4201
📈 Trend: Bullish trend just formed | 1 K-line has been completed
🎯 Tracking Line: 0.4103 ( Dynamic Stop Loss Reference )
Key Levels:
Support 0.4100 / 0.3962 / 0.3814
Resistance 0.4277 / 0.4662
Strategy: Just broke through the key resistance, consider a light long position near the tracking line, watch for the previous high at 0.4277 🚀
Risk: If the pullback breaks below 0.4100, the trend may be invalidated
View Original
- Reward
- like
- Comment
- Repost
- Share
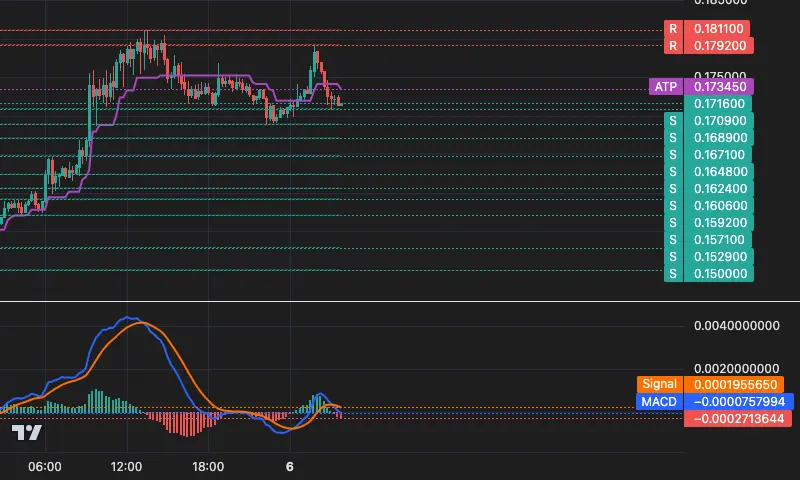
📊 #UAI 15-Minute Technical Overview
💰 Current Price: 0.1716 (0.00%)
📈 Trend: **Early decline, bears gathering** | 1K candles in operation
🎯 Tracking Line: 0.1734 ( Dynamic Stop-Loss Reference)
Key Levels:
Support 0.1709 / 0.1689 / 0.1671
Resistance 0.1792 / 0.1811
Strategy: Current price closely follows the start of the decline, with weak rebound. If unable to quickly regain above the tracking line 0.1734 or test the support at 0.1709 downward, continue to be bearish in the short term.
Risk: Price repeatedly fluctuates near the starting point, beware of false breakouts caused by small reb
UAI5,14%
- Reward
- like
- Comment
- Repost
- Share
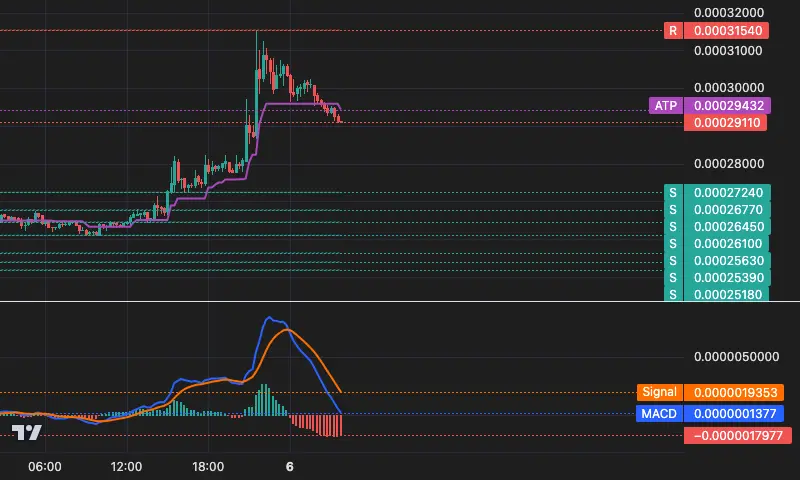
📊 SPELL 15-Minute Technical Overview
💰 Current Price: 0.0002911 (≈0%)
📈 Trend: 🔴 Trend Reversal - Just Entered a Downtrend | Running 0 K-lines
🎯 Tracking Line: 0.0002943 ( Dynamic Stop Loss Reference )
Key Levels:
Support 0.0002724 / 0.0002677 / 0.0002645
Resistance 0.0003154
Strategy: Bearish pattern established. If the price breaks below the tracking line (approximately 1.11% decline, greater than the current ATR), and cannot rebound above 0.0002943, it can be seen as a signal to short or continue holding short positions.
Risk: A "reversal" has just occurred, so be alert to the possibil
SPELL8,85%
- Reward
- like
- Comment
- Repost
- Share
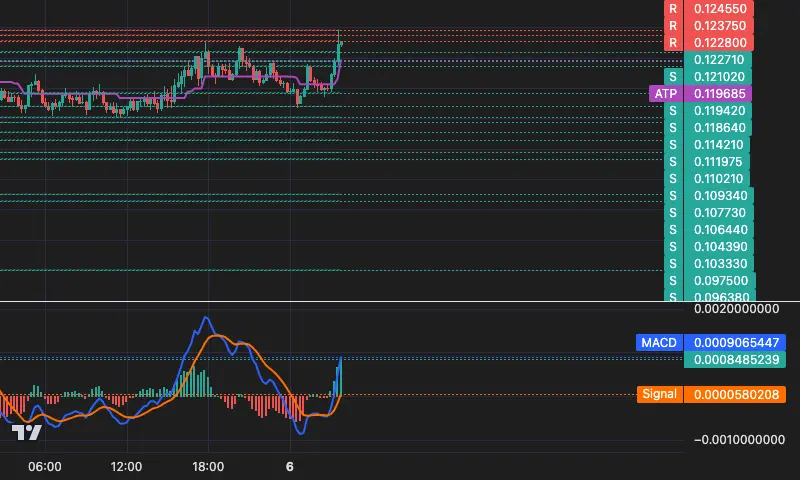
📊 USELESS 15m Technical Overview
💰 Current Price: 0.12271 (+0.43%)
📈 Trend: Bullish trend continues | 1K candles in operation
🎯 Tracking Line: 0.11969 (Dynamic stop-loss reference)
Key Levels:
Support 0.12102 / 0.11942 / 0.11864
Resistance 0.12280 / 0.12375 / 0.12455
Strategy: The trend is just established, and the price is above the entry point and dynamic support. Watch for a breakout of the first high at 0.12455 to confirm acceleration, and consider 0.11969 below as a moving stop-loss baseline.
Risk: Be aware of the potential resistance at the intra-day high of 0.12455! If the price fa
USELESS1,83%
- Reward
- like
- Comment
- Repost
- Share
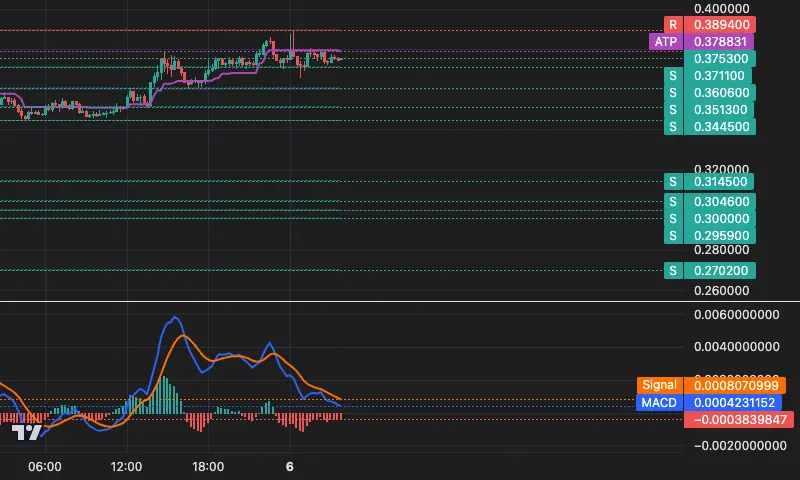
📊 STX 15-Minute Technical Overview
💰 Current Price: 0.3753 ( Sideways Market )
📈 Trend: **Downtrend Confirmed** | Just Initiated
🎯 Tracking Line: 0.3788 ( Dynamic Stop-Loss Reference )
Key Levels:
Support 0.3711 / 0.3606 / 0.3513
Resistance 0.3894 🔺
Strategy: Bearish outlook. The current price is close to the trend start point. If the rebound does not effectively break through the tracking line at 0.3788 (resistance), it can be considered a shorting opportunity.
Risk: The trend is newly established, and volatility may increase. Watch the first support at 0.3711; a break below could accel
STX8,73%
- Reward
- like
- Comment
- Repost
- Share
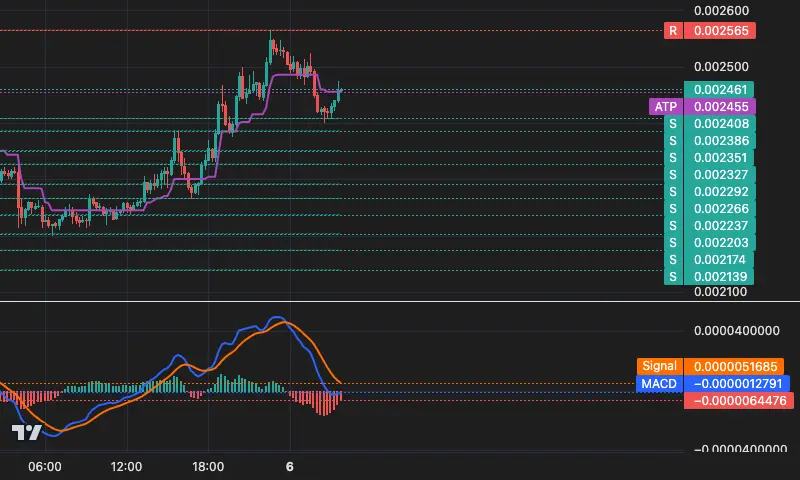
📊 PUMP/USDT 15m Technical Overview
💰 Current Price: 0.002461 ( Since trend initiation +1.48%)
📈 Trend: **Bearish trend continues** | 6K candles have run
🎯 Tracking line: 0.002455 ( Dynamic stop-loss/resistance reference )
Key levels:
Support 0.00240 / 0.00238 / 0.00235
Resistance 0.00247 / **0.002486 ( Recent sideways range )** / 0.002565
Strategy: Price rebounds close to the downward trend line, strength is uncertain. Until a clear breakthrough above 0.002486, it can still be considered a high-altitude shorting opportunity. 🚀
Risk: The current price is already above the trend initiation
PUMP8,43%
- Reward
- like
- Comment
- Repost
- Share
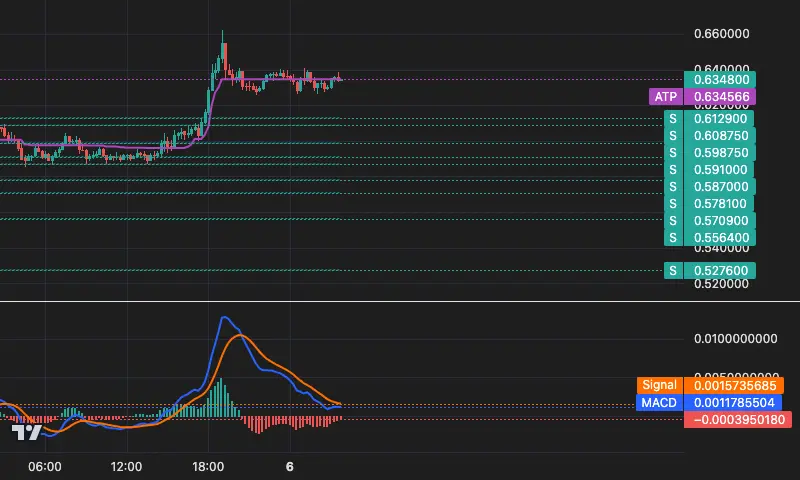
📊 WLD 15-Minute Technical Overview
💰 Current Price: 0.6348 (+5.05%)
📈 Trend: **Bullish trend accelerates** | 45 K-lines have been completed
🎯 Tracking Line: 0.6346 (Dynamic support/stop-loss level)
Key Levels:
Support 0.6087 / 0.5988 / 0.5910
Resistance: No clear resistance above, beware of profit-taking!
Strategy: The upward trend is strong, **price is closely following the dynamic tracking line**, and cautious long positions can be held near this line (about 0.6346).
Risk: The current price is just one step away from the trend line. If it breaks downward in the short term, beware of tren
WLD5,73%
- Reward
- like
- Comment
- Repost
- Share
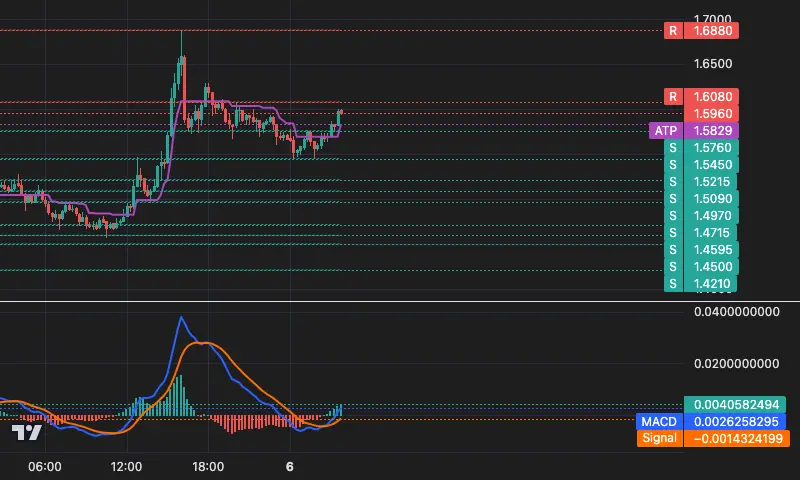
📊 FIL / USDT 15-Minute Technical Overview
💰 Current Price: 1.596 (+0.00%)
📈 Trend: Early Bullish Phase | 1 K-line has been completed
🎯 Tracking Line: 1.583 ( Dynamic Stop-Loss Reference )
Key Levels:
Support 1.576 / 1.545 / 1.522
Resistance 1.608 / 1.688🚀
Strategy: When the price breaks out of consolidation and moves above the trendline, consider a light position to go long, using the tracking line as a moving stop-loss.
Risk: This is the early stage of the trend, with significant volatility. The current price has slightly pulled back; beware of false breakouts. A valid break below the 1
FIL6,62%
- Reward
- 1
- Comment
- Repost
- Share
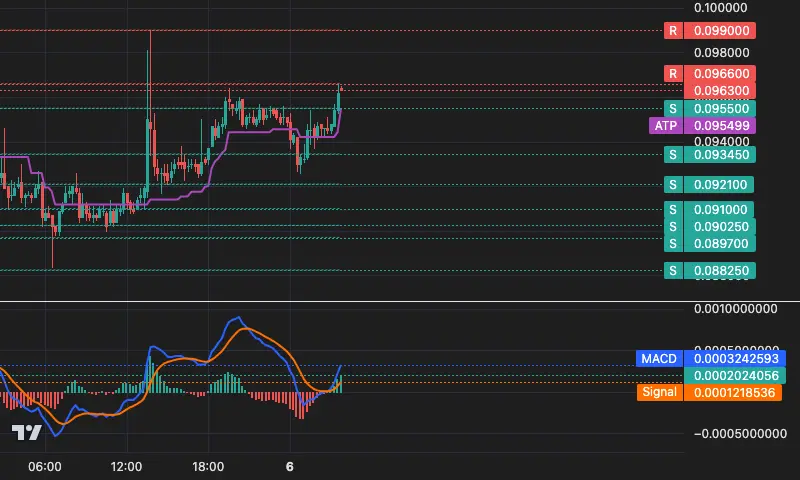
📊 $FLOCK 15-Minute Technical Overview
💰 Current Price: 0.0963 (+0.10%)
📈 Trend: **Bullish trend continues** | 2K candles in operation
🎯 Tracking Line: 0.0955 ( Dynamic stop-loss reference )
Key Levels:
Support 0.0955 / 0.0942 / 0.0935
Resistance 0.0966 / 0.0990
Strategy: Price remains above the upward trend line with small retracement. Consider looking for low buy opportunities near the current tracking line, targeting up to 0.0990.
Risk: The current price is close to the first resistance at 0.0966. If it cannot break through, it may turn into sideways trading. Keep a close eye on the trac
FLOCK4,53%
- Reward
- like
- Comment
- Repost
- Share
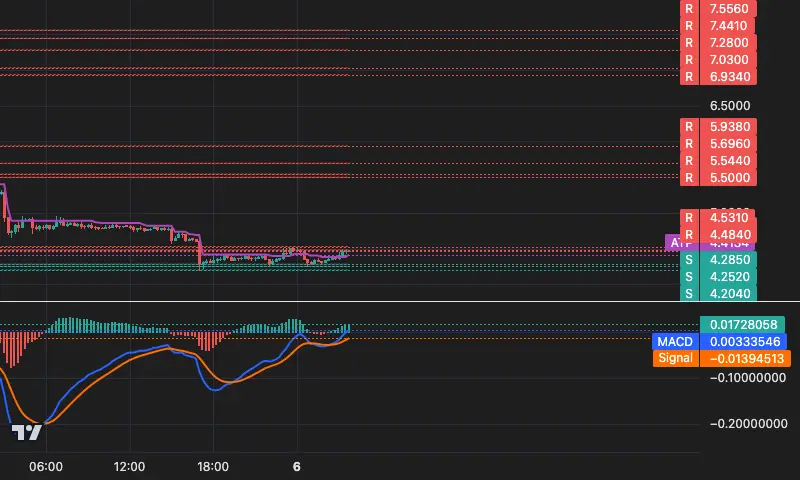
📊 OG 15m Technical Overview
💰 Current Price: 4.464 (0.00% vs Launch Point )
📈 Trend: Bullish trend established, just broke through! 🔥 | 1K candles in operation
🎯 Tracking Line: 4.413 ( Dynamic Stop Loss )
Key Levels:
Support 4.285 / 4.252 / 4.204
Resistance 4.484 / 4.531 / 5.500
Strategy: Bullish outlook, small positions can be tried near the current price. Be sure to set stop loss below the 4.413 trend line.
Risk: Just started, momentum needs confirmation, beware of false breakouts. Resistance at 4.484 is very close above.
OG-11,62%
- Reward
- 1
- Comment
- 1
- Share