MuxiTrading
vip
Age 0.7 Yıl
Peak Tier 5
No content yet
ETH direction: fall Just now it touched the one-hour and four-hour Bollinger Bands lower band line Now it is in a pullback phase ETH is currently below the MA120 Looking at the four-hour line, it is below the MA30.
Resistance levels above: 2970-3016-3057 Support levels below: 2904. 2807
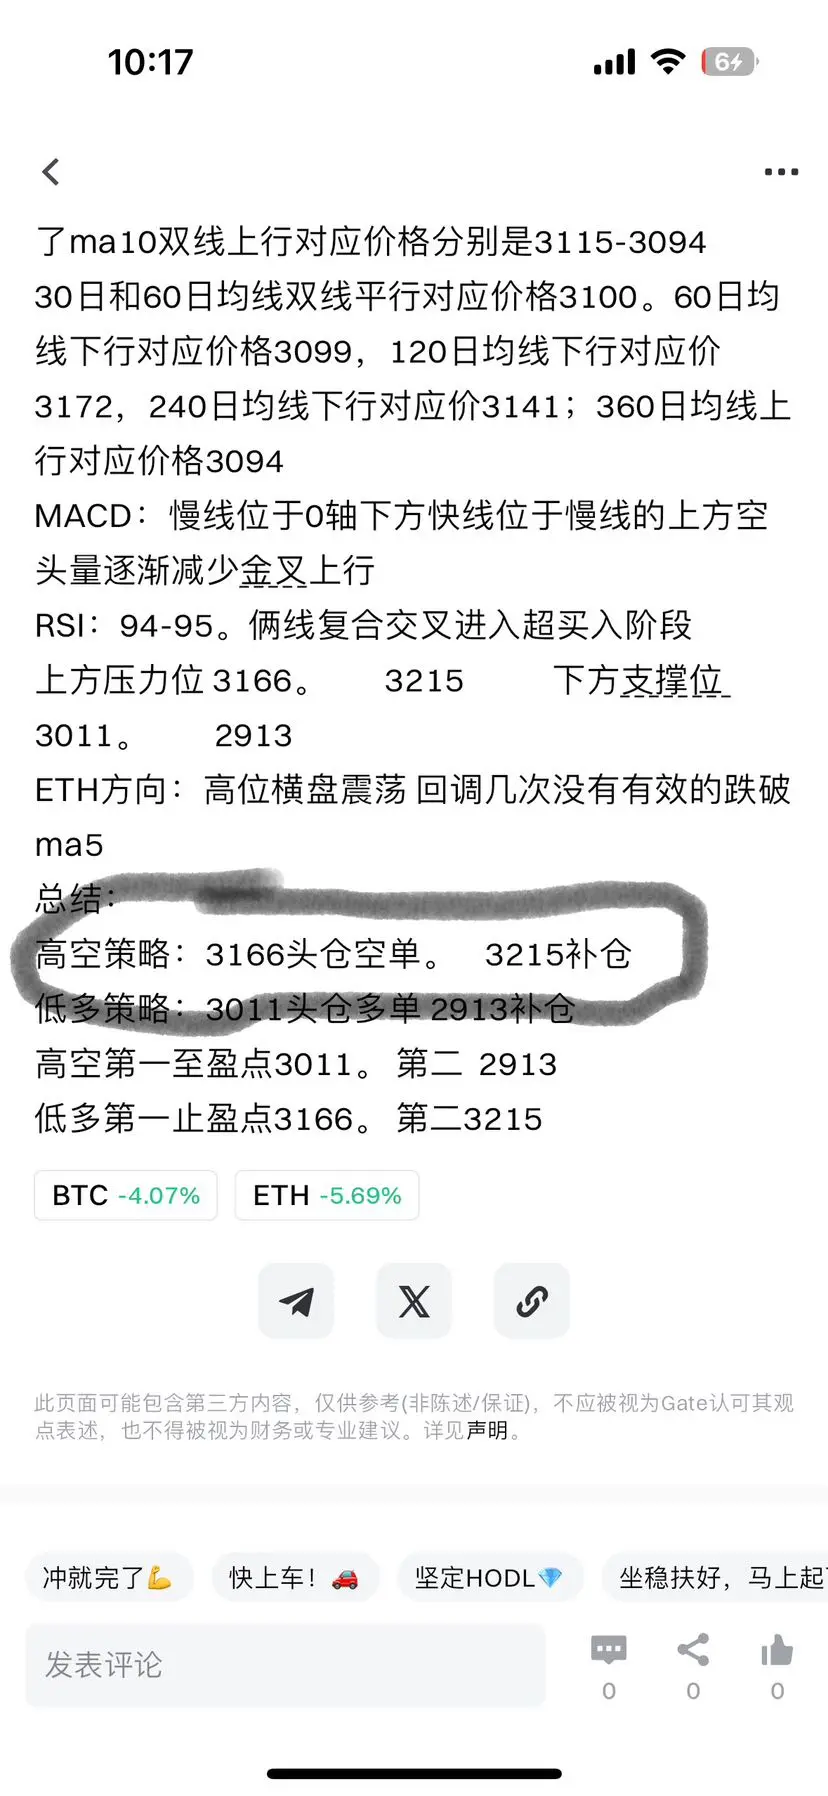
Summary:
High-altitude strategy: temporarily not available
Long Strategy: Long position at 2904, add position at 2807
ETH-3.16%
View Original
  • Reward
  • Comment
  • Repost
  • Share
ETH Direction: The Bollinger Bands are in a parallel state, with the middle band trending upwards corresponding to a price of 2994. ETH is currently above the MA60 and is attempting to break through, but has not yet achieved an effective breakout.
Resistance levels above: 3045-3072-3145 Support levels below: 2942. 2871
Summary:
High-altitude strategy: temporarily unavailable
Long Strategy: 2942 long position, 2871 additional purchase
ETH-3.16%
View Original
  • Reward
  • Comment
  • Repost
  • Share
ETH direction: Currently on the four-hour chart, it is near the upper band of the Bollinger Bands. The four-hour Bollinger Bands are narrowing with the middle band trending upwards. From the one-hour chart perspective, the Bollinger Bands are still in an open state and are currently above ma5, with several pullbacks not effectively breaking below ma5. Currently, it is oscillating upwards within the range between ma5 and the upper band of the Bollinger Bands.
Resistance levels above: 3042-3060-33150 Support levels below: 2933. 2886
Summary:
High-altitude strategy: temporarily not a
ETH-3.16%
View Original
  • Reward
  • 1
  • Repost
  • Share
GateUser-95194dd2vip:
Paying Close Attention🔍
The entry point for ETH has been reached, and it is currently profitable. Based on your own situation, exit the position. Wishing all the bosses to make a fortune.
ETH-3.16%
View Original
post-image
  • Reward
  • Comment
  • Repost
  • Share
ETH
On December 19th, the review indicated that yesterday's overall trend was a sideways fluctuation within the range of 3012-2940.
From the ETH 1-hour indicator, the Bollinger Bands have opened, corresponding to the range of 2953-3024. The upward movement of the middle band corresponds to the price of 2988, and the corresponding price for ETH is 3034.
Moving Average Indicator. The ma5 and ma10 upward lines correspond to prices of 3005-2995. The 30-day moving average upward corresponds to a price of 2984. The 60-day moving average upward corresponds to a price of 2980, the 120-day moving a
ETH-3.16%
View Original
  • Reward
  • Comment
  • Repost
  • Share
#加密市场观察 ETH Direction: A recent high point during the rebound is now consolidating sideways within a range of 2995-2970
Upper resistance levels: 3005-3030 - 3147
Lower support levels: 2933, 2808
Summary:
High short strategy: Not provided at the moment
Low long strategy: Long position at 2933, add to position at 2808
ETH-3.16%
View Original
  • Reward
  • Comment
  • Repost
  • Share
ETH
Review on December 19: Yesterday, the overall trend was a sideways consolidation with oscillations, staying within the MA5 and MA10 range.
Looking at the 1-hour indicator, the Bollinger Bands are opening downward, corresponding to the range of 2994-2936. The middle band is trending upward, corresponding to a price of 2965, with ETH at approximately 2975.
Moving average indicators:
Currently, ETH's price is consolidating within the MA5 and MA10 range, corresponding to 2978-2973.
The 30-day moving average is trending upward at approximately 2926.
The 60-day moving average is trend
ETH-3.16%
View Original
  • Reward
  • Comment
  • Repost
  • Share
ETH Direction: A recent high point during the rebound is now consolidating sideways
Resistance levels above: 2954-2978-3017
Support levels below: 2730, 2675
Summary:
Short-term bearish strategy: Not provided for now
Long-term bullish strategy: Long position at 2730, add to position at 2675
ETH-3.16%
View Original
  • Reward
  • Comment
  • Repost
  • Share
ETH
Review on December 18: Yesterday, the price attempted to break above 3000 but faced resistance and failed. Then, a significant decline followed. From the 4-hour chart, there was no effective stabilization above the Ma30 short-term resistance, leading to a drop to the lower band of the Bollinger Bands. Currently, the rebound is not very strong, and further decline is expected.
Looking at the 1-hour indicator for ETH, the Bollinger Bands are opening downward, corresponding to the range of 2964-2750. The midline downward trend corresponds to a price of 2856, with ETH at 2823.
Moving averages:
ETH-3.16%
View Original
  • Reward
  • Comment
  • Repost
  • Share
December 18 ETH Strategy
ETH Direction: Currently consolidating sideways at a low level, now below MA5 and MA10. On the four-hour chart, it just touched MA5 and is now in a retracement phase. Overall, the retracement is not very strong, and it should continue to decline.
Resistance levels above: 2860-2885-2910 Support levels below: 2730, 2674
Summary:
High Short Strategy: Not provided for now
Low Long Strategy: 2730 initial long position, 2674 add-on position
ETH-3.16%
View Original
  • Reward
  • Comment
  • Repost
  • Share
ETH
Review on December 18: ETH showed a strong upward trend yesterday, achieving a false breakout and breaking through the upper band of the Bollinger Bands on the 1-hour chart, then falling back and turning from an uptrend to a downtrend. It broke below the 2800 support level, indicating a pullback, but the pullback was not very strong.
Looking at the 1-hour indicator, the Bollinger Bands are opening downward, corresponding to the range of 2992-2773. The midline is descending, corresponding to a price of 2884, with ETH at approximately 2830.
Moving average indicators: The MA5 and MA10 lin
ETH-3.16%
View Original
  • Reward
  • Comment
  • Repost
  • Share
ETH 1-hour indicator shows Bollinger Bands opening and closing within the range of 2914-2971. The midline upward movement corresponds to a price of 2944, and ETH's price is approximately 2940 based on the moving average indicator.
The MA5 and MA10 double lines are crossing downward and currently are above ETH, corresponding to prices of 2947-2941. The 30-day moving average is trending downward at approximately 2940. The 60-day moving average is trending downward at approximately 3000, the 120-day at 3059, the 240-day at 3126; the 360-day moving average is trending upward at approximately 310
ETH-3.16%
View Original
  • Reward
  • Comment
  • Repost
  • Share
#市场触底了吗? ETH1-hour indicator shows Bollinger Bands opening and closing within the range of 2971-2914. The midline rising corresponds to a price of 2942, and ETH's price is 2957.
Moving average indicator: The MA5 and MA10 double lines are trending upward and currently below ETH, with respective prices of 2953-2946. The 30-day moving average crossing above the midline corresponds to a price of 2940. The 60-day moving average trending downward corresponds to 3012, the 120-day moving average downward at 3070, the 240-day moving average downward at 3130; the 360-day moving average upward at 3106.
M
ETH-3.16%
View Original
  • Reward
  • Comment
  • Repost
  • Share
ETH Direction: Now once again touching the previous low for a rebound, but currently not able to effectively hold above the 1-hour MA5 and MA10.
Resistance levels above: 2966, 3024.
Support levels below: 2820, 2720.
Summary:
High-altitude strategy: Not provided for now.
Long-term buy strategy: Long position at 2820, add to position at 2720.
ETH-3.16%
View Original
  • Reward
  • Comment
  • Repost
  • Share
#比特币跌破关键价位
Did you take the short positions at 3166 yesterday?
High short strategy: Head position short at 3017. Add at 3064.
Low long strategy: Head position long at 2916. Add at 2795.
First take-profit point for high shorts: 2916. Second: 2795.
First take-profit point for low longs: 3017. Second: 3064.
ETH 1-hour indicator shows Bollinger Bands opening and closing within the range of 3210-2840. The midline downward trend corresponds to a price of 3024, ETH price at 2941.
Moving average indicator: MA5 and MA10 cross at approximately 2945-2950; 30-day and 60-day moving averages are parallel d
BTC-2.34%
ETH-3.16%
View Original
post-image
  • Reward
  • Comment
  • Repost
  • Share
#BTC跌破后技术修复 ETH1 Hour Indicator shows Bollinger Bands opening and closing within the range of 3126-3060. The midline parallel to the price at 3093, ETH corresponding price at 3118.
Moving average indicator: ma5 crosses above ma10 from below, indicating an upward trend with prices at 3115-3094. The 30-day and 60-day moving averages are parallel at around 3100. The 60-day moving average is trending downward at 3099, the 120-day at 3172, and the 240-day at 3141; the 360-day moving average is trending upward at 3094.
MACD: The slow line is below the zero axis, the fast line is above the slow line,
BTC-2.34%
ETH-3.16%
View Original
  • Reward
  • Comment
  • Repost
  • Share
#十二月行情展望 Did you take the long positions around 3023 for ETH yesterday?
ETH direction: Just touched the upper trend line and then pulled back, but the pullback was not very strong. Starting a new trend should require a second wave of upward movement.
Resistance levels above: 3144, 3166. Support levels below: 2983, 2915.
Summary:
High short-term strategy: Not provided for now.
Low long-term strategy: Long position at 2983, add to the position at 2915.
ETH-3.16%
View Original
  • Reward
  • Comment
  • Repost
  • Share
#加密市场反弹 ETH 1-hour indicator shows Bollinger Bands opening and contracting within the range of 31138-3062. The lower band corresponds to a price of 3090, and ETH's price is at 3074
Moving average indicators.
The MA5 and MA10 double lines are trending downward at prices of 3080-3070. The 30-day and 60-day moving average cross downward at 3098. The 60-day moving average decline corresponds to 3098, the 120-day moving average decline to 3180, and the 240-day moving average decline to 3142; the 360-day moving average is trending upward at 3092.
MACD: Below the zero line, the fast line is belo
ETH-3.16%
View Original
ETH
fall below 3000 second round of fall
14
14
Now no looking back, just charge ahead.
14
14
28 ParticipantsVoting Finished
  • Reward
  • Comment
  • Repost
  • Share
#Gate11月透明度报告出炉 ETH Direction: Currently experiencing a slight upward movement, touching the resistance level at 3130 and then pulling back.
Upper resistance levels: 3145, 3230.
Lower support levels: 3023, 2984.
Summary:
Bullish strategy: Not provided at the moment.
Low buy strategy: Long position at 3023, add to position at 2984.
ETH-3.16%
View Original
  • Reward
  • Comment
  • Repost
  • Share
ETH Direction: Currently in a sideways consolidation range at a low level between 3082-3094
Upper resistance levels: 3097, 3113 Lower support levels: 3023, 2984
Summary:
Long-term high-altitude strategy: Not provided for now
Low-position long strategy: 3023 initial long position, 2984 add-on position
ETH-3.16%
View Original
post-image
  • Reward
  • Comment
  • Repost
  • Share
  • Trending TopicsView More
  • Pin
Trade Crypto Anywhere Anytime
qrCode
Scan to download Gate App
Community
  • 简体中文
  • English
  • Tiếng Việt
  • 繁體中文
  • Español
  • Русский
  • Français (Afrique)
  • Português (Portugal)
  • Bahasa Indonesia
  • 日本語
  • بالعربية
  • Українська
  • Português (Brasil)