Trade
Basic
Futures
Futures
Hundreds of contracts settled in USDT or BTC
TradFi
Gold
Trade global traditional assets with USDT in one place
Options
Hot
Trade European-style vanilla options
Unified Account
Maximize your capital efficiency
Demo Trading
Futures Kickoff
Get prepared for your futures trading
Futures Events
Participate in events to win generous rewards
Demo Trading
Use virtual funds to experience risk-free trading
Earn
Launch
CandyDrop
Collect candies to earn airdrops
Launchpool
Quick staking, earn potential new tokens
HODLer Airdrop
Hold GT and get massive airdrops for free
Launchpad
Be early to the next big token project
Alpha Points
Trade on-chain assets and enjoy airdrop rewards!
Futures Points
Earn futures points and claim airdrop rewards
Investment
Simple Earn
Earn interests with idle tokens
Auto-Invest
Auto-invest on a regular basis
Dual Investment
Buy low and sell high to take profits from price fluctuations
Soft Staking
Earn rewards with flexible staking
Crypto Loan
0 Fees
Pledge one crypto to borrow another
Lending Center
One-stop lending hub
VIP Wealth Hub
Customized wealth management empowers your assets growth
Private Wealth Management
Customized asset management to grow your digital assets
Quant Fund
Top asset management team helps you profit without hassle
Staking
Stake cryptos to earn in PoS products
Smart Leverage
New
No forced liquidation before maturity, worry-free leveraged gains
GUSD Minting
Use USDT/USDC to mint GUSD for treasury-level yields
More
CoinCircleRuoyu
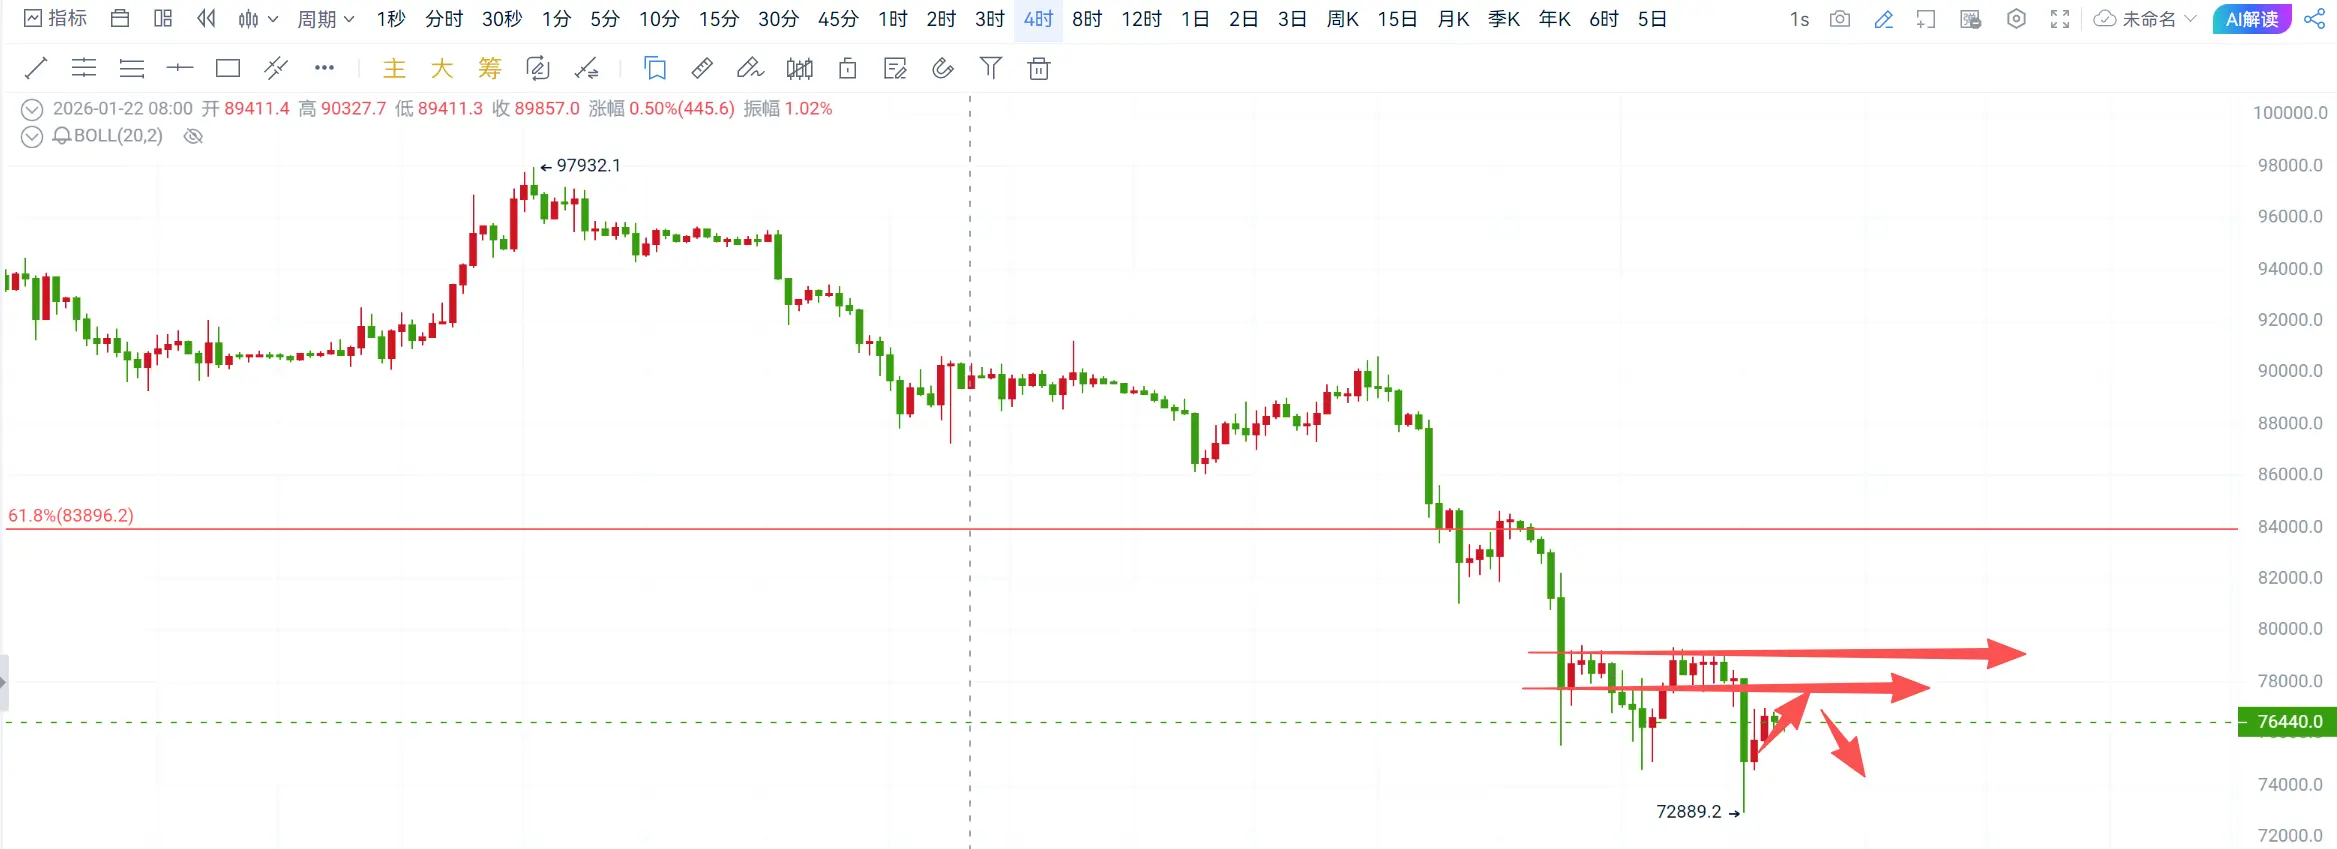
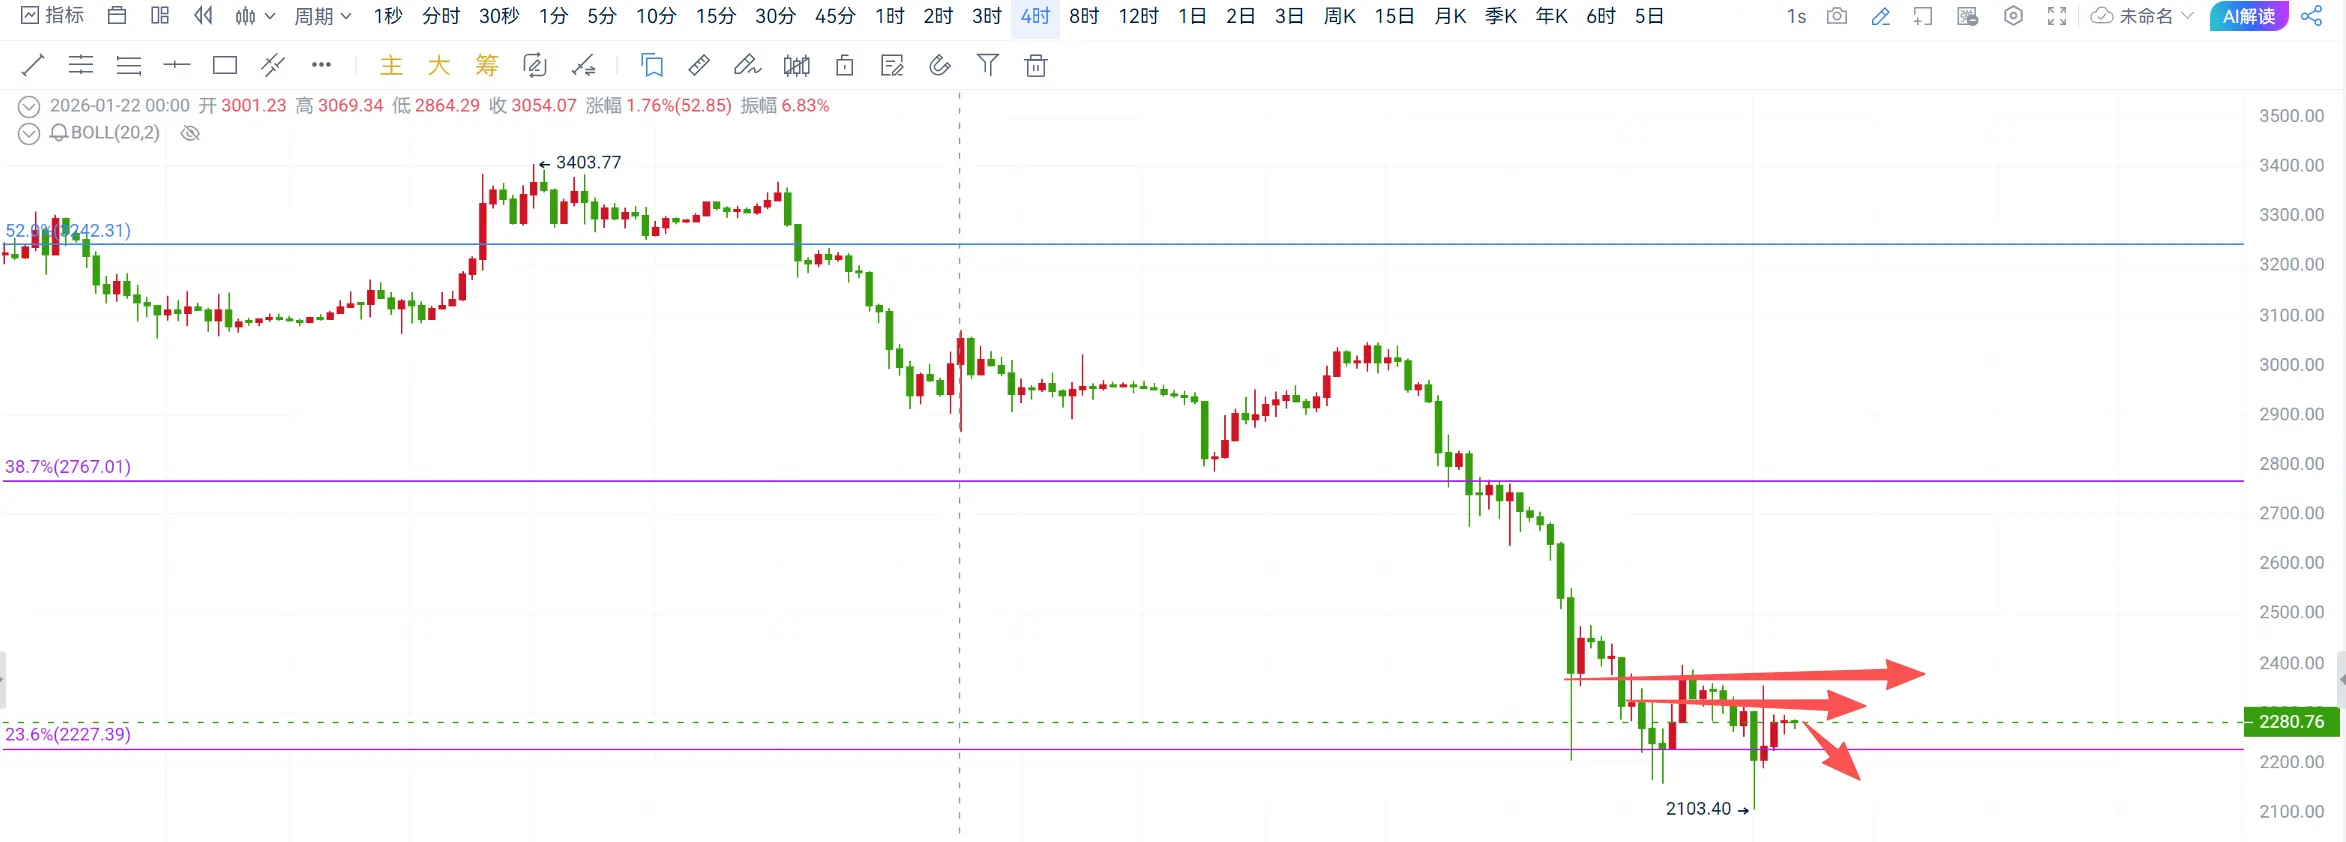
Daily chart Bitcoin hits a new low and closes around 75,700. Currently, the rebound is still weak, with resistance at 77,000-79,000 and short-term support at 75,000. If it continues to decline, watch the 70,000 level. Ethereum's rebound is also weak, but the close remains above the support at 2,230, with resistance at 2,280-2,350. If it breaks below support, the next target is around 1,800.
On the 4-hour chart, Bitcoin experienced a brief correction after an oversold condition but continues to hit new lows. Currently, it is suppressed at 77,500-79,000 with support at 75,000. Ethereum is simila
View OriginalOn the 4-hour chart, Bitcoin experienced a brief correction after an oversold condition but continues to hit new lows. Currently, it is suppressed at 77,500-79,000 with support at 75,000. Ethereum is simila
- Reward
- like
- Comment
- Repost
- Share
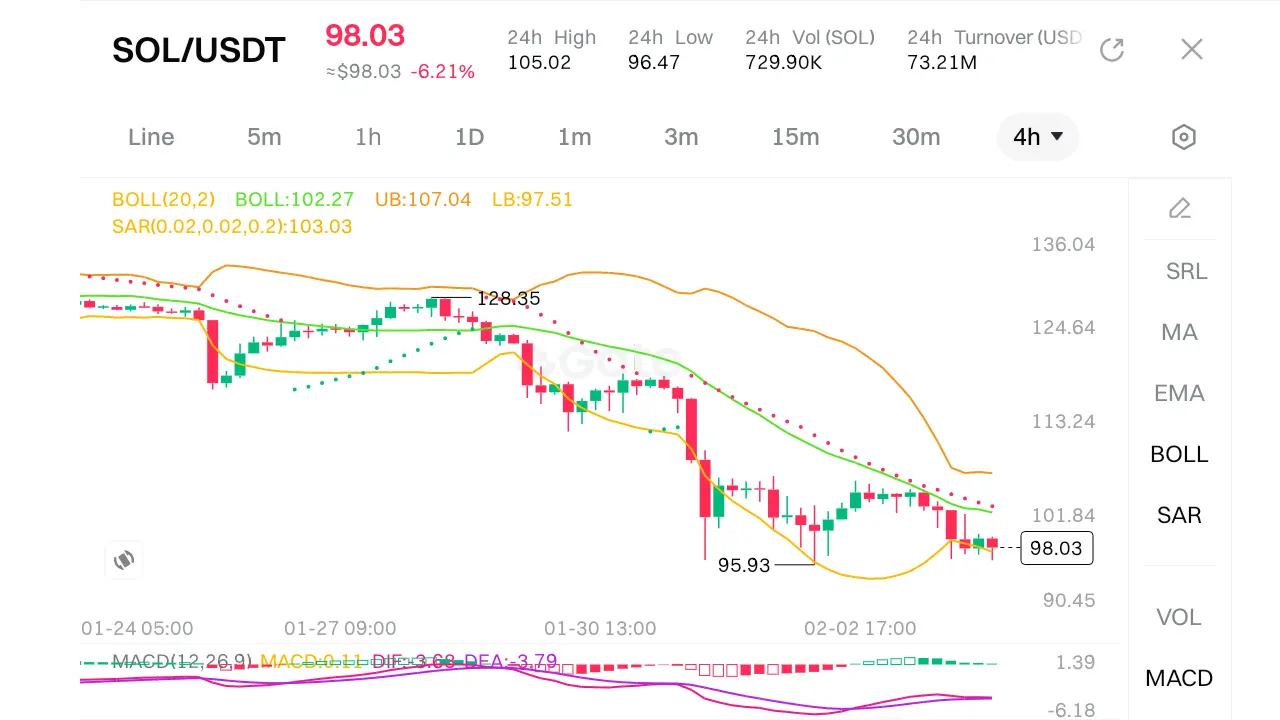
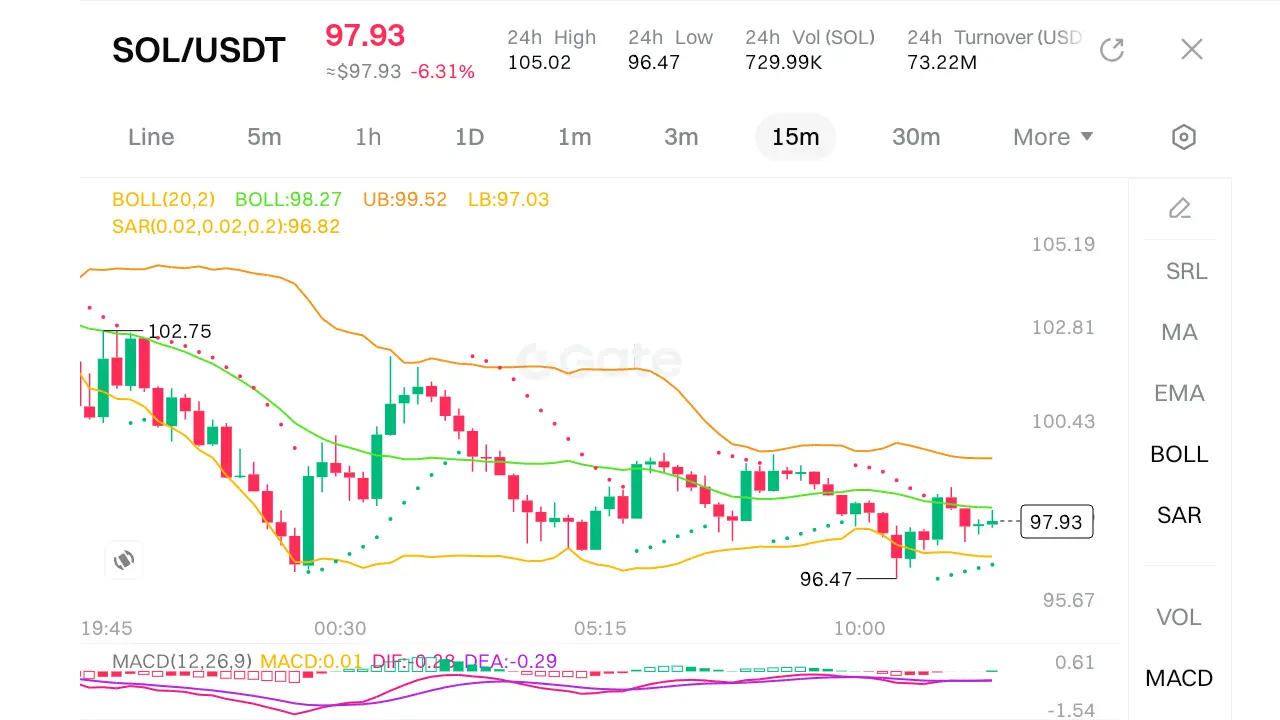
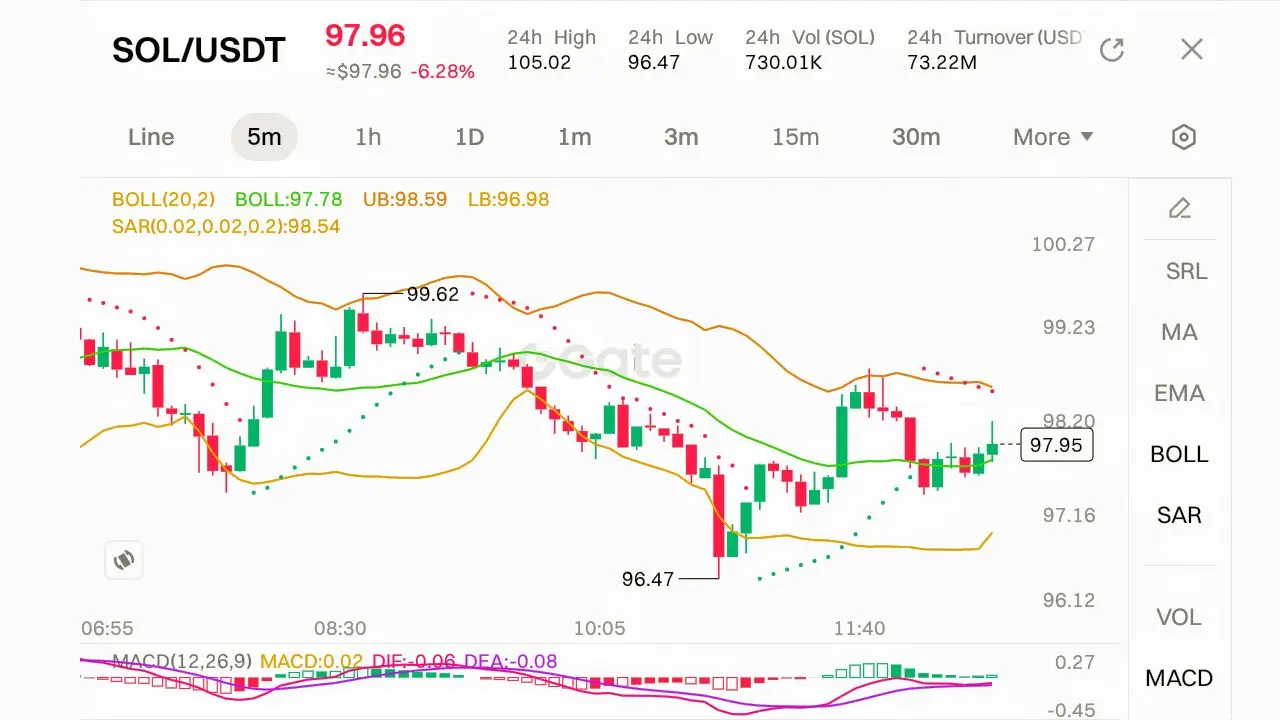
#OvernightV-ShapedMoveinCrypto SOL/USDT Multi-Timeframe Analysis;
Professional Trader Perspective –
4H Chart – Identify Direction
· Trend: Bearish
· Key Levels:
· SAR (Stop & Reverse): 103.03 – Price is below → downtrend confirmed
· BOLL Mid: 102.27 – Price below → bearish bias
· Upper Band (UB): 107.04
· Lower Band (LB): 97.51 – Price approaching → potential support
· MACD: Negative at -6.18, DIFF below DEA → bearish momentum
· Direction: DOWN – Structure favors sell-side until price reclaims >103.03.
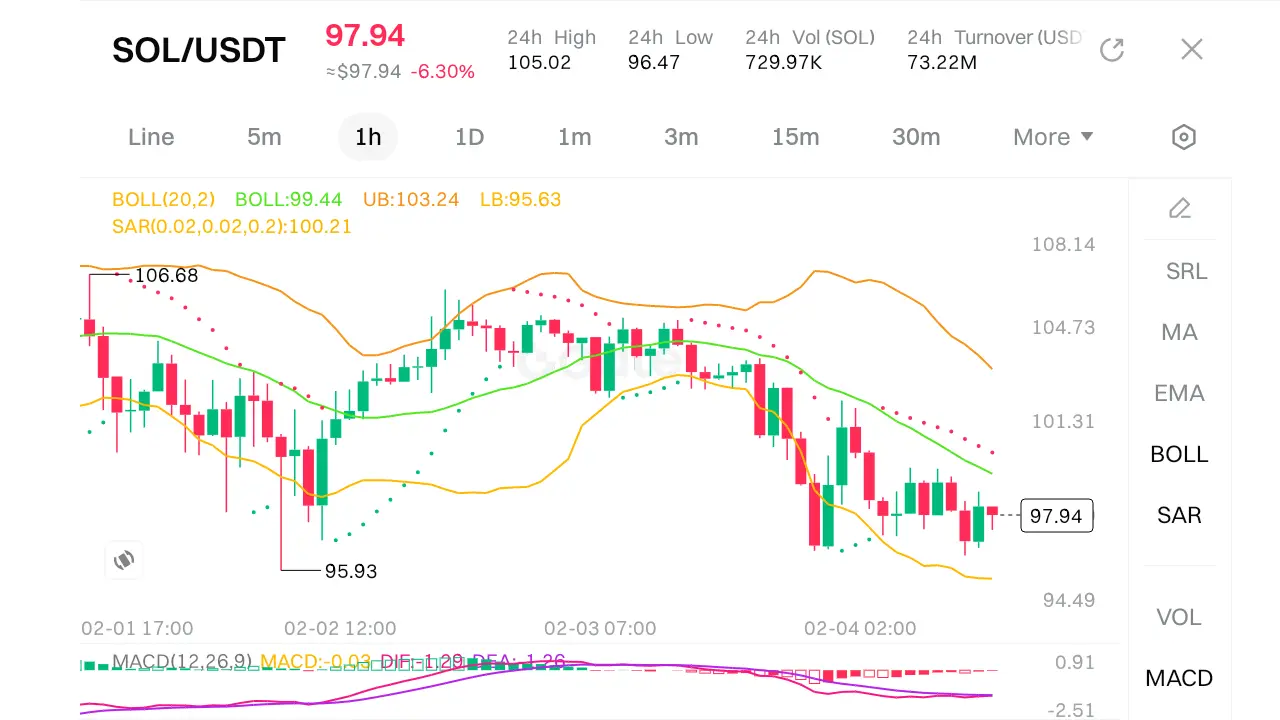
1H Chart – Identify Liquidity High and Low
· Liquidity High (Recent): 105.02 (24h Hi
Professional Trader Perspective –
4H Chart – Identify Direction
· Trend: Bearish
· Key Levels:
· SAR (Stop & Reverse): 103.03 – Price is below → downtrend confirmed
· BOLL Mid: 102.27 – Price below → bearish bias
· Upper Band (UB): 107.04
· Lower Band (LB): 97.51 – Price approaching → potential support
· MACD: Negative at -6.18, DIFF below DEA → bearish momentum
· Direction: DOWN – Structure favors sell-side until price reclaims >103.03.
1H Chart – Identify Liquidity High and Low
· Liquidity High (Recent): 105.02 (24h Hi
SOL-6,47%
- Reward
- 3
- 5
- Repost
- Share
EqunixHub :
:
Ape In 🚀View More
Thanks for playing, see you at next cycle
- Reward
- 1
- 1
- Repost
- Share
THOR_RAG:
CZ 🤲 Czech Republic 🤲
Welcome to the Czech Republic! This beautiful country is known for its rich history, stunning architecture, and vibrant culture. Whether you're exploring Prague's historic old town, visiting the picturesque castles, or enjoying traditional Czech cuisine, there's something for everyone. Don't forget to try the famous Czech beer and experience the warm hospitality of the locals. Have a great trip!
🐸
SERM
Created By@GateUser-2622be26
Subscription Progress
0.00%
MC:
$0
Create My Token
Who still needs this?👇 If you support me, I support youIt’s FREE and simple 👊🚀

- Reward
- like
- Comment
- Repost
- Share
Gate Indices section futures has now launched US2000, TW88, AUS200, VIX and HSCHKD. Trade to earn instant rewards, meet trading targets to share additional prizes, and enjoy exclusive welcome bonuses for new users. Both new and existing users are invited to participate and share a 200,000 USDT reward pool. https://www.gate.com/campaigns/4015?ref_type=132
- Reward
- like
- Comment
- Repost
- Share
Good morning familia.Rise and shine.

- Reward
- like
- Comment
- Repost
- Share
accept payments on polygon with walletconnect pay#polygon #walletconnect #crypto #payments #web3

- Reward
- 2
- 1
- Repost
- Share
THOR_RAG:
✅Hunan's average guy Yi Lihua married Zhejiang's wealthy second-generation Lou Jiyue and started on the path to success. Have you learned everything there is to learn?
View Original
- Reward
- 2
- Comment
- Repost
- Share
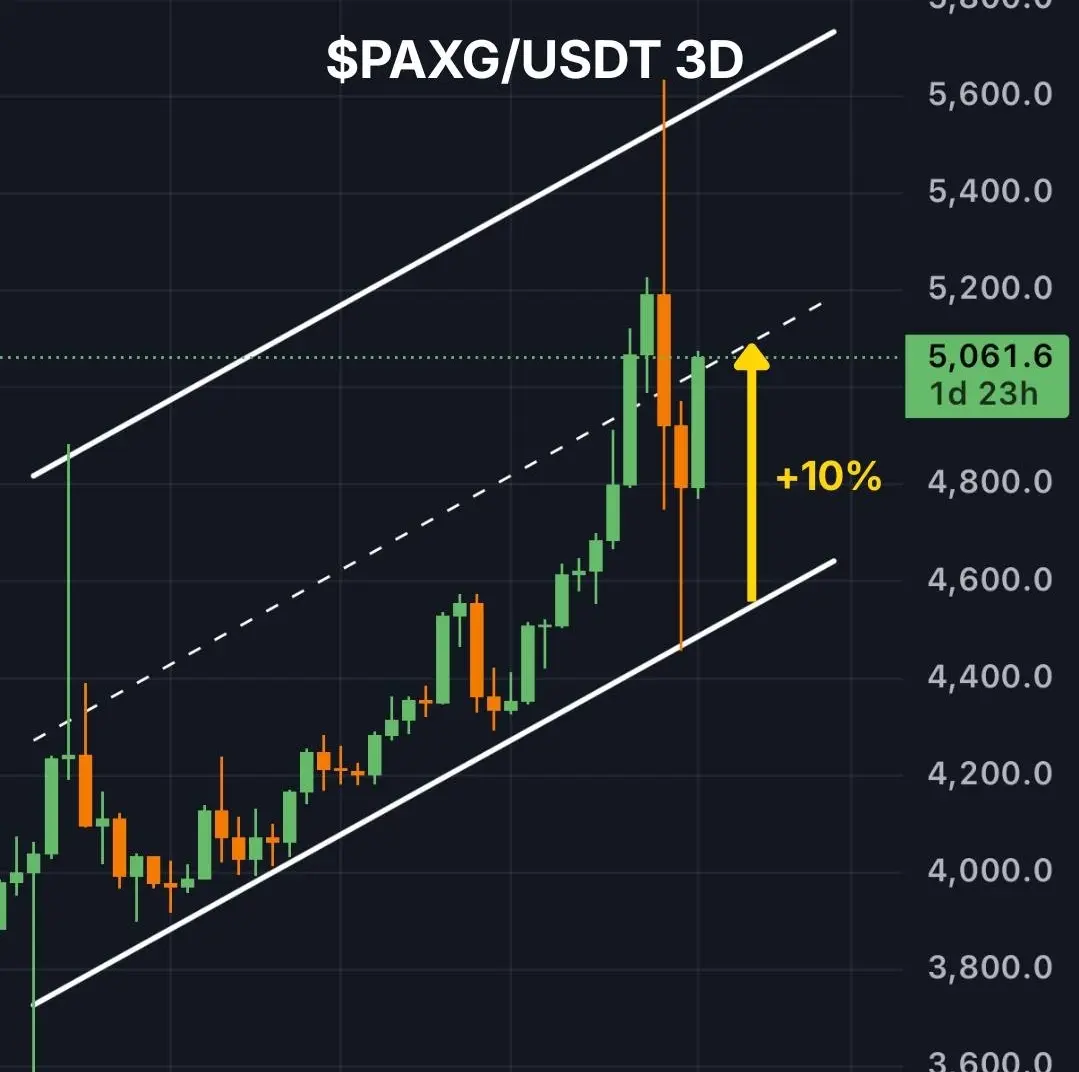
Update on #PAXGUSDT 📈
Following our previous recommendation, the $PAXG stock has increased by 10%, surpassing the support level of the ascending channel.
Our first profit-taking target was achieved at $5000 ✅
If the strong momentum continues, the next target for upward movement is at $5200 - $5300 🎯
#USIranStandoff
#PAXG
$PAXG
PAXG3%
- Reward
- 1
- 1
- Repost
- Share
BasheerAlgundubi:
If the momentum continues strongly, the next target for upward movement is at $5200 - $5300 🎯
Bitcoin drops below $80,000, ETF holdings face testing of cost basis, investor sentiment is under pressure
474
- Reward
- like
- Comment
- Repost
- Share

- Reward
- like
- 4
- Repost
- Share
MissedGainsWillAlwaysEarn,But :
:
2940? Is this a short position, Sister Ying? Is this a pending order? Sister Ying, is this a short sale?
View More
1000BTC
1000BTC Coin
Created By@回不到过去了吗
Listing Progress
0.16%
MC:
$2.9K
Create My Token
Check out Gate and join me in the hottest event! https://www.gate.com/campaigns/3988?ch=826&ref=VLIWBLOKUW&ref_type=132

- Reward
- 1
- 3
- Repost
- Share
AYATTAC:
2026 GOGOGO 👊View More
Check out Gate and join me in the hottest event! https://www.gate.com/campaigns/3988?ch=826&ref=VQBFUWTZUQ&ref_type=132

- Reward
- 3
- 4
- Repost
- Share
MissCrypto:
2026 GOGOGO 👊View More
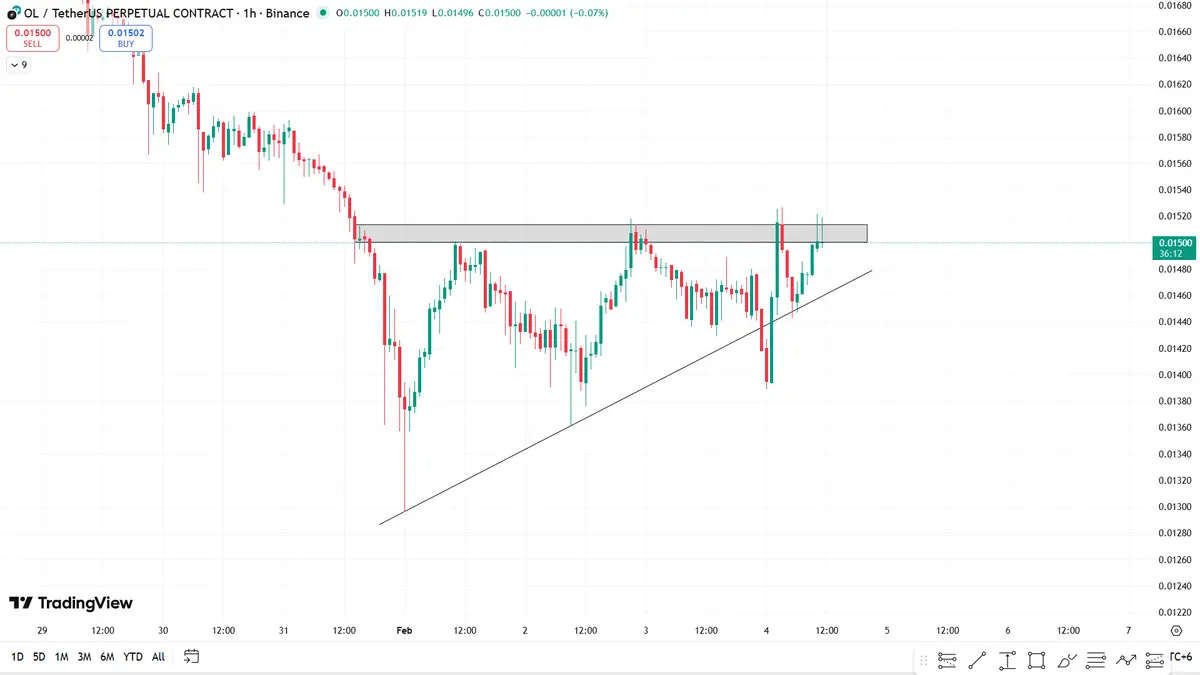
#OL Update: On a LTF, above the gray zone is good for going higher. Massive price surge is expected.
OL2,04%
- Reward
- like
- Comment
- Repost
- Share
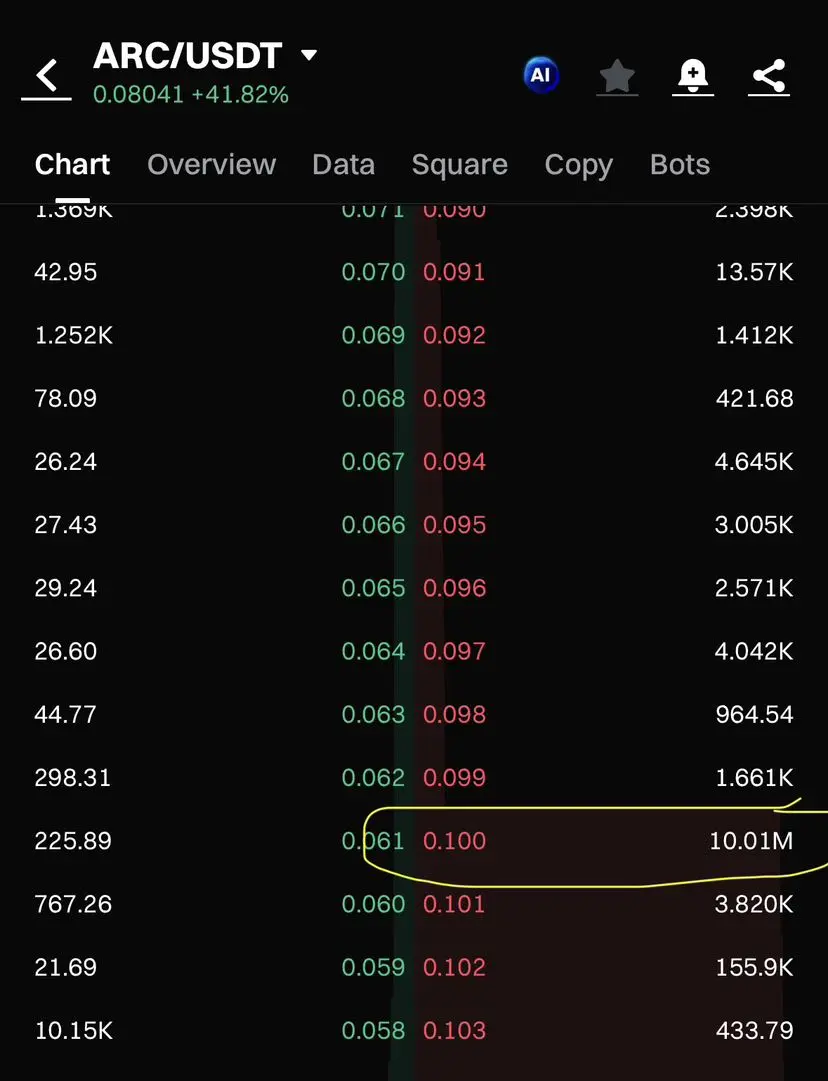
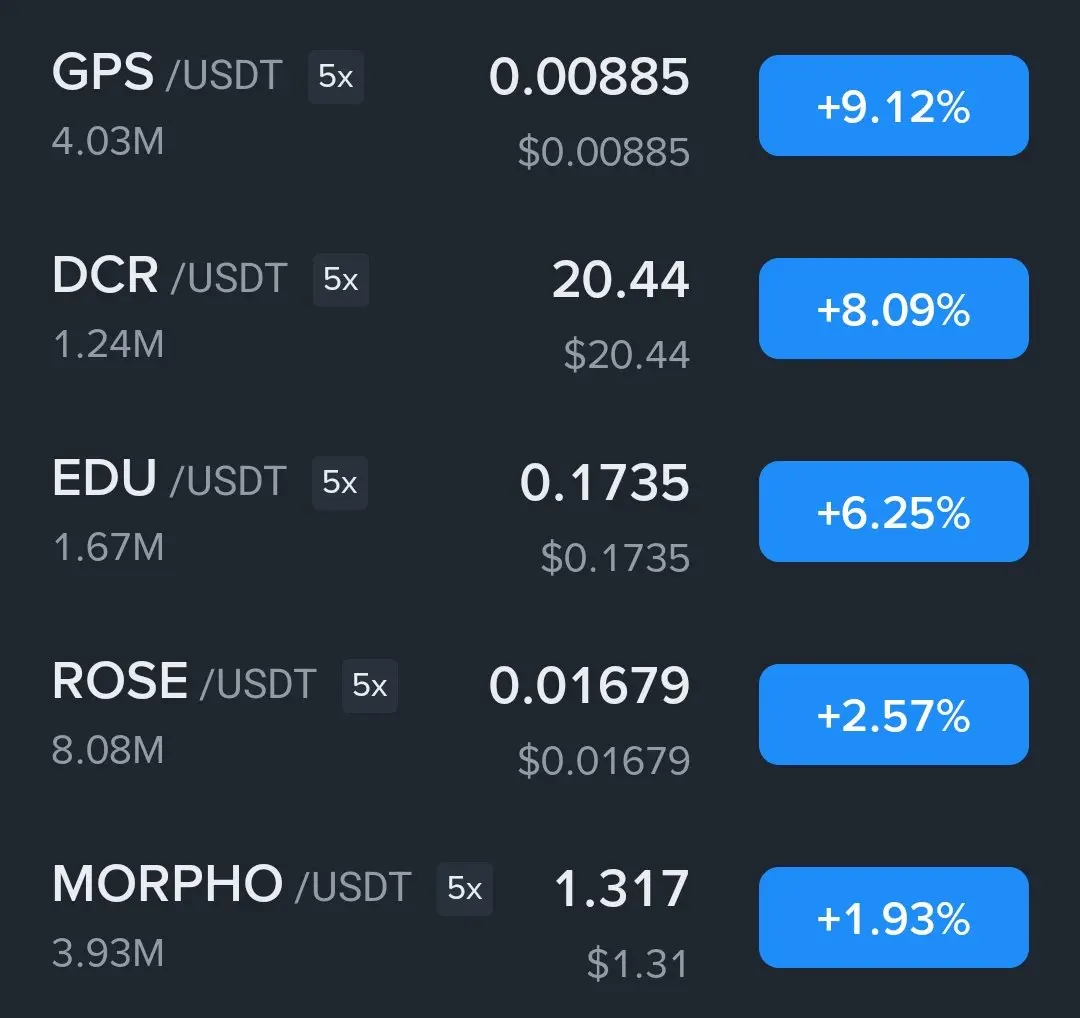
Viewing the Top Market Coins Spot Chart and comparing them
0
- Reward
- 11
- 5
- Repost
- Share
AYATTAC:
Happy New Year! 🤑View More
Bitcoin And Gold Ratio 🚀 #bitcoin #gold # #crypto
BTC-2,83%
- Reward
- like
- Comment
- Repost
- Share
💥 Gate Live 2026 Spring Festival Ranking Clash Grand Ceremony is in full swing
🏆 Host Ranking|Veteran hosts broadcast more to earn cash + New Year gift boxes
🎁 New host first broadcast: +20% points + $50 cash + New Year gift boxes
🧧 Users check in daily, red envelopes every day
Continuous participation also gives you a chance to draw the Koi Fish 50U airdrop reward
Check the market · Grab red envelopes · Climb the leaderboard
Celebrate the Spring Festival like this — Gate Live earnings + double the New Year flavor 🔥
👉 Join now: https://www.gate.com/campaigns/3937

- Reward
- like
- Comment
- Repost
- Share
- Reward
- 1
- 3
- Repost
- Share
GateUser-b2075a06:
Jump in 🚀View More
Load More
Join 40M users in our growing community
⚡️ Join 40M users in the crypto craze discussion
💬 Engage with your favorite top creators
👍 See what interests you
Trending Topics
View More7.97K Popularity
5.59K Popularity
4.76K Popularity
2.13K Popularity
3.07K Popularity
Hot Gate Fun
View More- MC:$0.1Holders:00.04%
- MC:$0.1Holders:10.00%
- MC:$0.1Holders:10.00%
- MC:$2.77KHolders:00.00%
- MC:$2.82KHolders:20.12%
News
View MoreInstitutional BTC median allocation is almost zero. Dan Morehead straightforwardly states: In the long term, Bitcoin is expected to surpass gold.
1 m
Stable v1.2.0 Major Release: USDT0 Becomes Native Gas, Fully Upgraded Stablecoin Settlement Experience
3 m
Ripple takes the stage at the White House Summit, and XRP's influence in U.S. crypto policy is on the rise
3 m
Circle has minted approximately 750 million USDC on the Solana network in the past 12 hours.
4 m
CZ warns that fake images are manipulating crypto market sentiment. How can users avoid new scam traps?
6 m
Pin