The US Nasdaq Index experienced its most severe two-day consecutive plunge, Bitcoin crashed close to $70,000, gold slightly rose, and the dollar recovered its losses. US Treasury Secretary Bessent stated “support for a strong dollar,” drawing a red line, indicating that the dollar is no longer a stable asset price. This round of pressure crushed crowded trades (gold, Bitcoin), which are assets driven by consensus, leading to a stampede. However, the 2-year US Treasury yield slightly declined, reducing the likelihood of systemic risk outbreak.
The textbook sequence of crowded trade stampedes
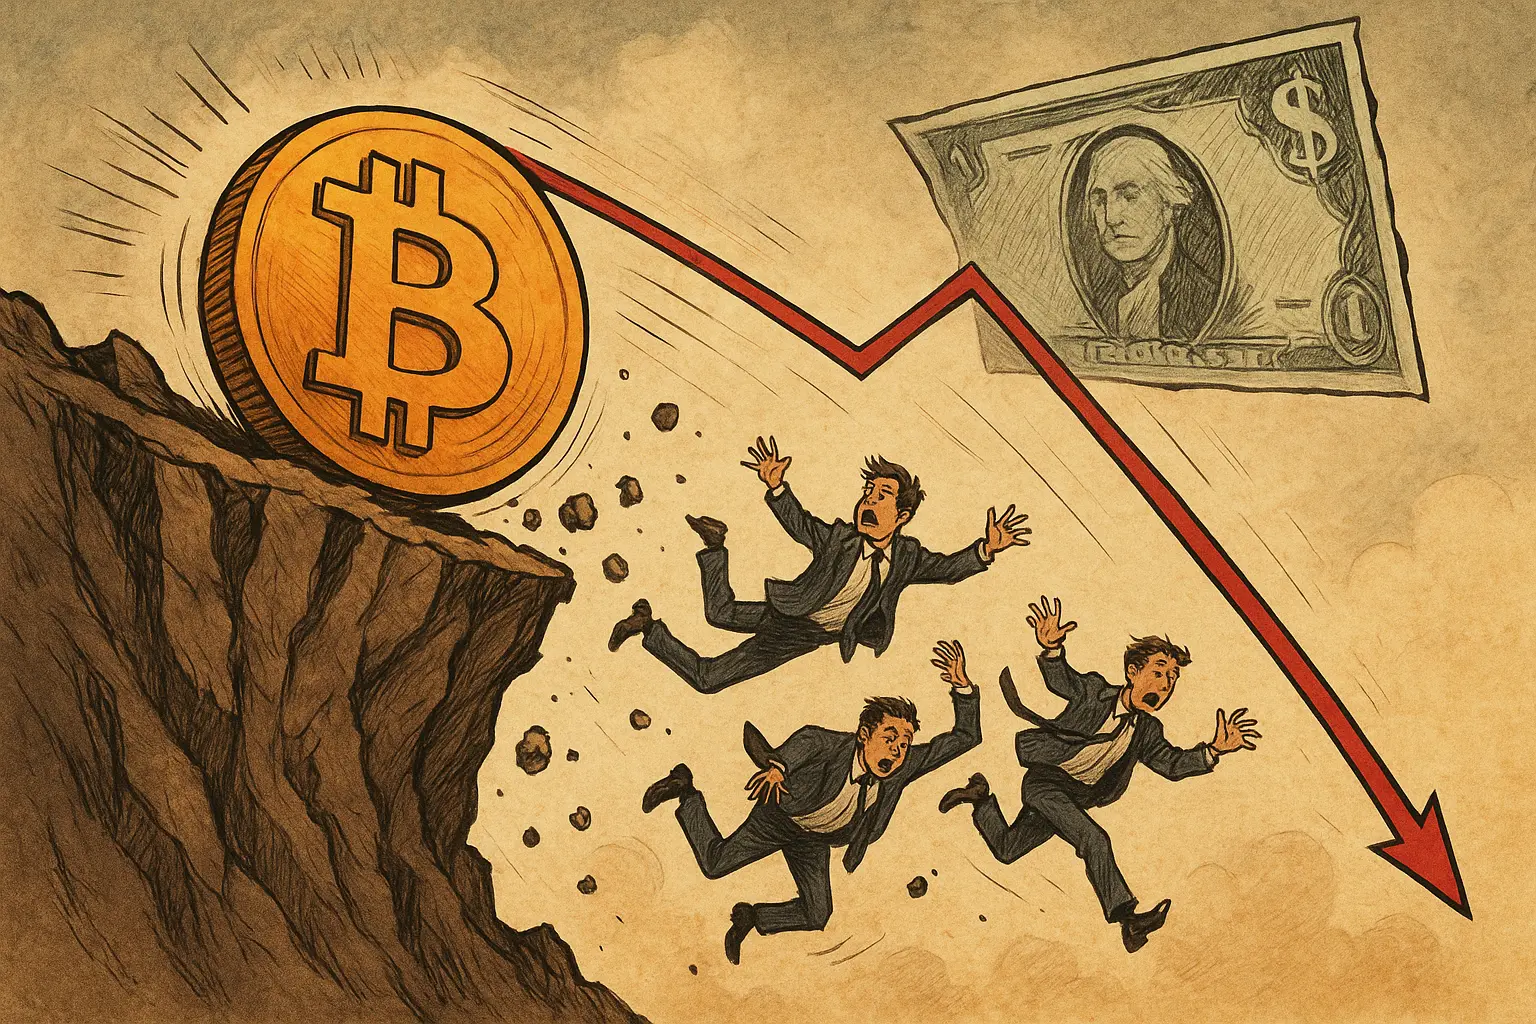
This decline has two obvious features. First, it hits the “most crowded trades” of the past. The current decline’s sequence is almost textbook-like. First, sell “safe assets everyone agrees on” (gold), then sell “high beta assets everyone crowded into” (Bitcoin). These assets share a common point: they do not rely on being “cheap” to survive but on “consensus.” Once the consensus is shaken, even slightly, it results in a stampede-level decline.
What is a crowded trade? Simply put, it’s when many investors establish similar positions based on the same logic. In the second half of 2025, the narrative of “dollar weakening, gold hitting new highs, Bitcoin breaking historical highs” became market consensus. Hedge funds, family offices, and even retail investors were betting on this trend. When everyone is on the same boat, the balance is extremely fragile; any gust of wind can trigger a collective escape.
Gold hit a historic high of $3,700 per ounce at the end of 2025, becoming one of the most crowded safe-haven trades. Bitcoin retreated from $126,000 in October but still had many investors firmly believing it would return to highs. After Bessent’s strong dollar stance emerged, the fundamental logic of these two crowded trades was shaken, holders rushed to exit, and with insufficient buy-side support, prices accelerated downward.
This stampede sequence also has its internal logic. The gold market is larger and more liquid, allowing large institutions to reduce positions more orderly. Bitcoin’s market is smaller and more volatile; when large sell orders flood in, prices fall more sharply. Tech stocks have their own decline logic due to earnings expectations and valuation issues, but a strong dollar undoubtedly added pressure.
The three stages of the crowded trade stampede
First stage: Gold falls from $3,700, profit-taking on safe-haven trades
Second stage: Bitcoin drops toward $70,000, high beta assets accelerate deleveraging
Third stage: Tech stocks plummet, valuation bubbles burst amid tightening liquidity
The second feature is the obvious rise of the dollar. The old formula of “dollar down, everything up” has become invalid. The dollar is not rising because “America is doing well,” but because capital is withdrawing and seeking safety. This naturally suppresses tech stocks, Bitcoin, and high-valuation assets. When global funds exit risk assets, the dollar, as the main safe-haven currency, appreciates. This pattern of dollar strength coinciding with risk asset declines is typical of risk-averse environments.
The deeper meaning of Bessent’s strong dollar red line
More critically, at 00:39 Beijing time, US Treasury Secretary Bessent said, “We always support a strong dollar policy.” This statement essentially “draws a red line for the market.” It’s a signal that market participants should not expect a depreciation of the dollar to ease financial pressures; the dollar no longer functions as a “stabilizer of asset prices.”
The destructive power of this statement lies in breaking the market’s long-standing implicit expectation. Historically, whenever asset prices plunged or financial markets faced stress, the US government and Federal Reserve would often adopt easing monetary policies (cutting rates, QE) to rescue the market. These policies had the side effect of dollar depreciation. The market had become accustomed to “a rescue after enough decline,” creating moral hazard. Investors dared to take risks, believing the government would ultimately backstop.
Bessent’s statement essentially says: no rescue this time. A strong dollar means a tightening monetary environment, implying higher interest rates may persist longer, and dollar liquidity will not be as abundant as before. For high-valuation tech stocks, zero-yield Bitcoin, and various risk assets, this environment is extremely unfavorable. They previously enjoyed valuation bubbles driven by ultra-low interest rates and dollar depreciation; now, they may face the opposite process.
Why did Bessent emphasize a strong dollar now? Possible reasons include: the US national debt has reached $36 trillion, requiring dollar credibility to ensure continued financing; inflation pressures have not fully subsided, and a weak dollar could trigger imported inflation; and the Trump administration aims to attract capital back to the US through a strong dollar to support its manufacturing return policies. Regardless of motives, the result is that markets can no longer rely on the old script of “dollar depreciation to rescue.”
Impacts of a strong dollar on different assets
Bitcoin: a non-yielding asset, less attractive in a high-interest-rate environment, dollar appreciation directly depresses dollar-priced Bitcoin
Tech stocks: high valuations rely on low interest rates; a strong dollar indicates continued tightening
Gold: traditional safe-haven but usually under pressure when the dollar strengthens; they have an substitutive relationship
Emerging markets: dollar strength leads to capital inflows into the US, pressuring EM assets
Moderate risk warning rather than systemic crisis
But this is not a systemic crisis. If it were, the bond market would panic, yields would soar, but that scene did not happen; the 2-year US Treasury yield even slightly declined. This indicates it’s not a crisis but a re-pricing of assets at different levels. We rate this round of market risk as “moderate” (currently escalating), because the decline involves crowded trades and dollar appreciation. The real red flag is when even the least crowded, most stable assets start falling together. That step has not yet been reached.
This distinction is extremely important. A systemic crisis features liquidity shortages, soaring credit default risks, and panic selling of safe assets (like US Treasuries). During the 2008 financial crisis, even Treasuries were sold because everyone needed cash. In March 2020, during the pandemic panic, gold and Bitcoin both plummeted as investors rushed to liquidate to meet margin calls. The current situation differs; US Treasuries remain the preferred safe asset, and declining yields indicate capital inflows rather than outflows.
This “asset re-pricing” is healthy market behavior. When some assets are overvalued and excessively crowded, markets need adjustments to restore balance. Bitcoin falling from 126,000 to 70,000, though brutal, may be more reasonable from a long-term valuation perspective. The PE ratios of tech stocks retreating from extreme levels are also part of the bubble deflation process. As long as this adjustment does not evolve into a liquidity crisis and credit collapse, it remains within controllable bounds.
What are the real warning signals? When even the least crowded, most stable assets start falling indiscriminately, that’s the true red flag. For example, if utilities, consumer staples, and high-grade corporate bonds—“boring but safe” assets—also plunge, it indicates a liquidity panic. Currently, these assets are relatively stable, suggesting the crisis has not yet escalated to a systemic level.
For Bitcoin holders, the current strategy depends on the time horizon. In the short term, $70,000 is a key level; if broken, it could accelerate toward $65,000 or even $60,000. In the medium term, if the strong dollar policy truly persists, Bitcoin may oscillate in a lower range for several months. In the long term, the fundamental logic of Bitcoin (scarcity, decentralization, hedge against fiat devaluation) remains unchanged, and this correction might be a better accumulation opportunity.
