
The charts are lining up around an important moment for the ZEC price. After weeks of sideways and choppy action, Zcash is now sitting at a level that could either support a rebound or lead to another move lower.
On the lower-timeframe chart, the ZEC price is hovering around the $360–$370 area, a zone that has acted as a pivot multiple times. This is where traders are watching closely to see if a higher low can form. Holding this range keeps the recovery structure in place, while losing it would shift attention back toward lower support zones.
- Zcash Short-Term Levels That Matter Most
- The ZEC Daily Chart Shows the Bigger Picture
- What to Watch Next for the ZEC Price
Zcash Short-Term Levels That Matter Most
The 4-hour chart shared by Sjuul gives a clean roadmap. Support sits around $360–$370, which is where the ZEC price is currently trying to hold its ground. Above that, the next major hurdle comes in near $460, a level that has capped rallies in the past.
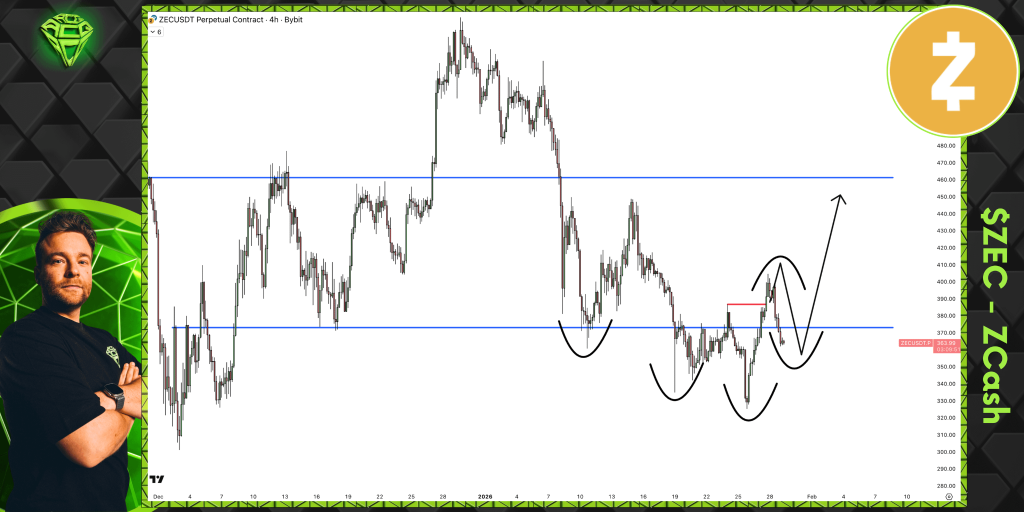
Source: X/@AltCryptoGems
There is also a clear invalidation level on the chart. A breakdown below $320 would invalidate the higher-low idea and shift the structure back toward a more bearish setup. That does not mean price is headed there, but it is the line that separates recovery from failure.
For the bullish scenario to materialize, ZEC needs to recover $370 and follow through. If so, a move to the high $300s and then testing the $460 resistance level is not entirely far-fetched.
The ZEC Daily Chart Shows the Bigger Picture
Zooming out to the daily chart shared by BitcoinCensus changes the perspective. The Zcash price has been trading within a wide bullish flag-like formation over the past months after a strong rally in the earlier stages of the cycle. The price is still trading within the flag formation. Therefore, it is likely to experience some minor corrections.
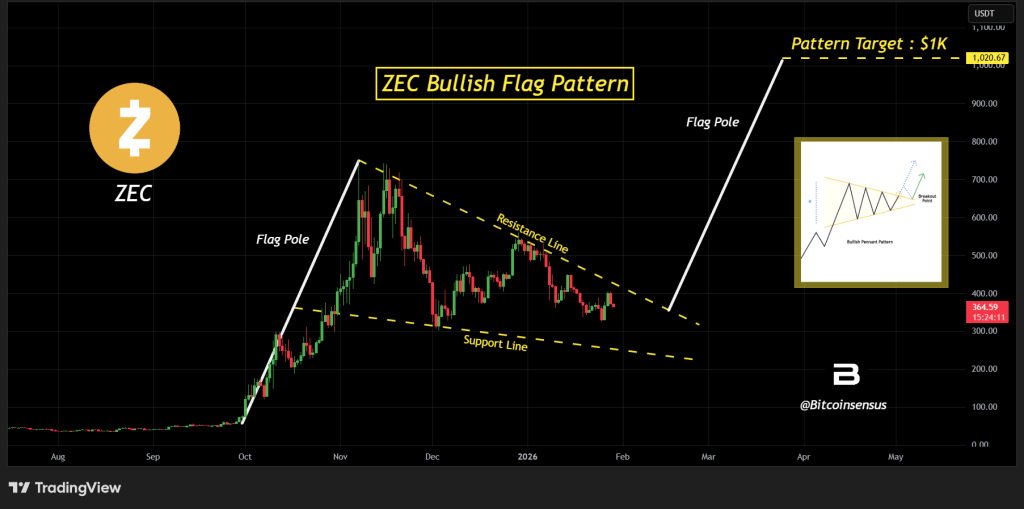
Source: X/@Bitcoinsensus
The long-term projection from this pattern points toward $1,000, but that is clearly a macro target, and not something expected in the near term.
For that scenario to even come into play, the ZEC price would need to reclaim several major resistance zones and eventually break out of the larger structure with momentum.
$KAS Price Prediction – $5,000 in Kaspa Now, How Much Could It Be Worth by 2027?_**
What to Watch Next for the ZEC Price
The big question in the short term is whether ZEC can continue to trade above the $360 to $370 level and keep the level around $320 at bay.
If that level continues to hold, the charts do indicate that ZEC could move back up towards the $400 level, perhaps facing resistance at the $460 level in the process.
Disclaimer: The information on this page may come from third parties and does not represent the views or opinions of Gate. The content displayed on this page is for reference only and does not constitute any financial, investment, or legal advice. Gate does not guarantee the accuracy or completeness of the information and shall not be liable for any losses arising from the use of this information. Virtual asset investments carry high risks and are subject to significant price volatility. You may lose all of your invested principal. Please fully understand the relevant risks and make prudent decisions based on your own financial situation and risk tolerance. For details, please refer to
Disclaimer.
Related Articles
Bitcoin Rejects $76K as War and PPI Rock Markets
_ Bitcoin rejected $76,000 resistance as US strikes on Iran, hot PPI at 3.4%, and Powell’s FOMC tone sent crypto and risk assets into a sell-off._
Bitcoin hit $76,000 and turned back around. The rejection was clean. Sellers were waiting right at the level that traders had marked for
LiveBTCNews24m ago
ZANO 4.6% gains 11.2% to $7.25, technical chart shows bullish rectangle pattern
Gate News reports that on March 19, ZANO token price surged rapidly to $7.25, up 11.2%, with trading volume rising in sync. Technical analysis shows ZANO exhibits a bullish rectangle pattern, with price entering a consolidation phase after the rapid surge, and market signs of buyer entry appearing.
GateNews1h ago
This Friday Traditional Financial Markets Welcome 'Quadruple Witching Day,' Bitcoin Volatility May Rise Accordingly
This Friday will see the quarterly derivatives event "Quadruple Witching Day," which may lead to increased market volatility. The current market environment is highly volatile, with the VIX index breaking through 35, and Bitcoin volatility is also likely to rise. Additionally, on March 27th, there is a large-scale derivatives expiration, which will intensify market volatility risks.
GateNews1h ago
XRP trading price is $1.43, and the RSI indicator shows oscillation in the neutral zone.
Gate News reported that on March 19, XRP is currently trading at $1.43, with a Relative Strength Index (RSI) of 49.65, sitting in the neutral zone. Technical analysis shows XRP price oscillating between the $1.40 support level and the $1.50 resistance level.
GateNews2h ago
ZANO Roars Back, Records 11.2% As Bullish Rectangle Structure Prints Continuing Market Rally: Ana...
Zano (ZANO) coin is experiencing a surge in price and trading volume, reaching $7.25. Analysts note a bullish rectangle pattern indicating sustained upward momentum, reflecting increased demand for privacy-focused cryptocurrencies amid broader market recovery.
BlockChainReporter2h ago
BTC rises 0.74% in 15 minutes: FOMC meeting digestion and short covering drive short-term volatility
Between 2026-03-19 15:45 to 16:00 (UTC), BTC experienced a 15-minute price range of 68787.0 to 69550.9 USDT, achieving a realized return rate of +0.74% with an amplitude of 1.11%. During the same period, market attention increased, short-term volatility intensified, and fund behavior and sentiment indicators both showed concentrated changes.
The primary driver of this price movement was the conclusion of the FOMC meeting, after which the market saw no new bearish catalysts. Some short sellers chose to cover their positions, providing upward momentum to the price in the short term. Additionally, while ETF fund outflows reflected institutional profit-taking, they did not form a sustained trading
GateNews2h ago
