Altcoins such as Midnight (NIGHT), Tezos (XTZ), and Quant (QNT) are standing out as they record significant gains compared to the overall cryptocurrency market in the past 24 hours. However, the recovery momentum formed since Monday is gradually stalling as prices approach key moving averages — important technical resistance zones. Pressure at these levels is restraining upward movement and weakening short-term bullish momentum. From a technical perspective, NIGHT, XTZ, and QNT still face reversal risks, especially given that the overall crypto market has not yet exited a strong sell trend, and cautious sentiment remains dominant.
Midnight’s Breakout is Blocked at the 50-Period EMA
Midnight is fluctuating around $0.0600 at the time of writing on Tuesday, after rising about 10% in the previous session. This recovery has helped the privacy-focused token within the Cardano ecosystem break out of a downtrend channel on the 4-hour chart. However, the upward momentum remains unconvincing as the price continues to encounter resistance at the 50-period EMA at $0.064566. This moving average is still sloping downward and has twice halted attempts to break higher this week.
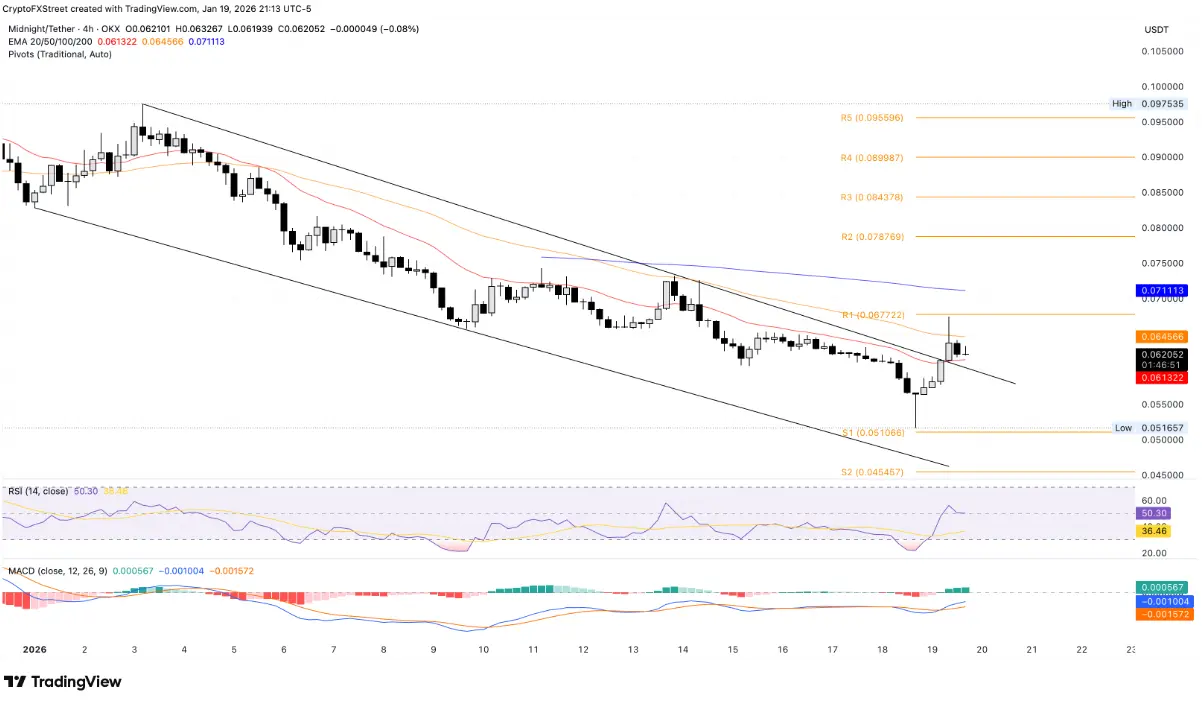 4-hour NIGHT/USDT chart | Source: TradingViewFrom a momentum standpoint, the 4-hour MACD has crossed above the signal line in the negative zone, moving toward zero; the expanding histogram indicates selling pressure is waning significantly. Meanwhile, RSI has retreated to the neutral level, reflecting short-term buying power cooling off and the market returning to a balanced state.
In a risk scenario, if NIGHT drops below the 20-period EMA at $0.06132, the breakout signal will be invalidated, opening the possibility for the price to retreat toward the S1 Pivot at $0.05106. Conversely, a decisive breakout above the 50-period EMA could trigger further gains, with resistance targets at the R1 Pivot at $0.06772 and the 200-period EMA at $0.07113.
Tezos Signals Downside Risk as Momentum Weakens
Tezos declined 2% at the time of Tuesday’s report, after a 5% increase on Monday. The coin is facing strong resistance from the 200-day EMA at $0.6081, limiting its recovery efforts. However, the 20-day and 50-day EMAs are still trending upward, suggesting potential short- and medium-term recovery.
If XTZ can close above the 200-day EMA, the upward trend could extend toward the R2 Pivot at $0.6618.
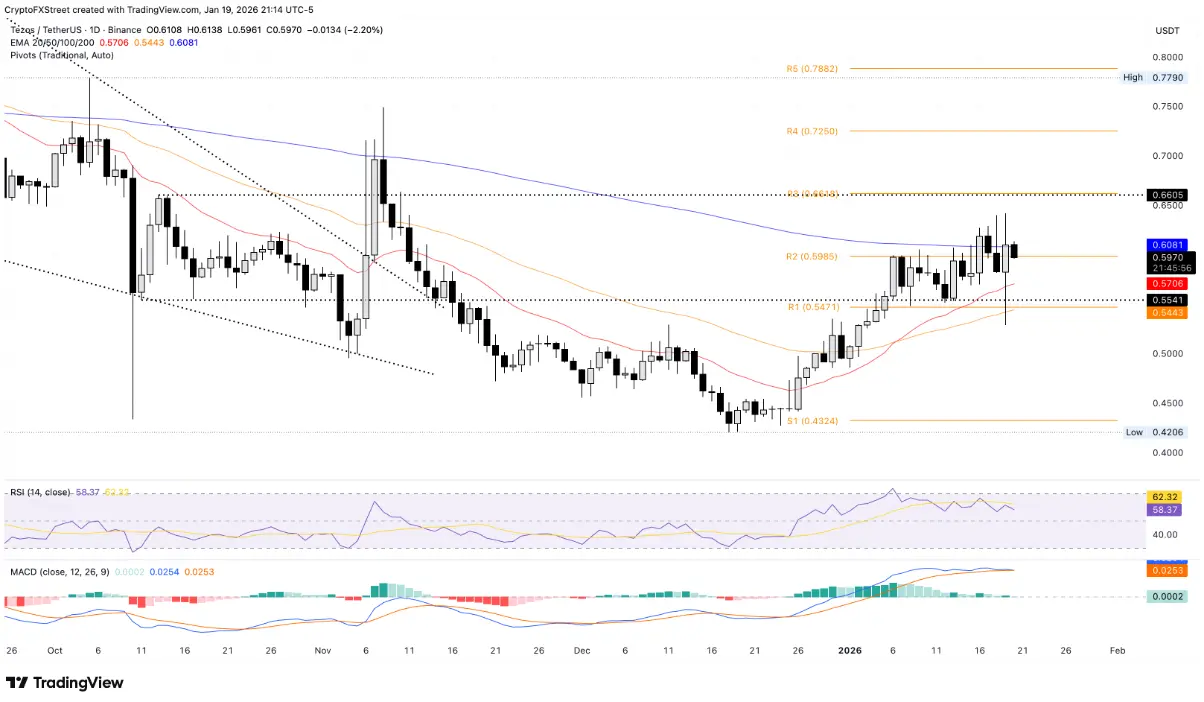 Daily XTZ/USDT chart | Source: TradingViewOn the daily chart, the MACD indicator’s MACD line is converging with the red signal line as the histogram narrows, indicating weakening bullish momentum. A bearish crossover and a shift of the histogram into negative territory would confirm a downtrend.
RSI is currently at 58, adjusting downward from overbought levels, indicating buying pressure is gradually diminishing.
In a correction scenario, XTZ could test the 20-day EMA at $0.5706, with deeper support at the R1 Pivot at $0.5471.
Quant’s Recovery Faces Resistance at the 200-Day EMA
Quant (QNT) is currently trading between the 50-day and 200-day EMAs, roughly in the $78–$87 range. At the time of writing, QNT is trading around (Tuesday, up 4% from Monday. However, the presence of long upper shadows on candles this week indicates strong selling pressure at higher price levels.
If QNT cannot sustain above the 50-day EMA at $87, a correction back to the November 4 low of $68 is possible.
![])https://img-cdn.gateio.im/webp-social/moments-640406a7480df1813c480bb6982e0a5c.webp$82 Daily QNT/USDT chart | Source: TradingViewTechnical indicators on the daily timeframe support an uptrend: the MACD and signal lines are rising above zero, with the histogram expanding, showing increasing bullish momentum. RSI is at 57, remaining above neutral, reflecting growing buying strength.
If QNT breaks above the 200-day EMA at $87, the next target could be the R1 Pivot at $92, opening opportunities for a new breakout rally.
Disclaimer: The information on this page may come from third parties and does not represent the views or opinions of Gate. The content displayed on this page is for reference only and does not constitute any financial, investment, or legal advice. Gate does not guarantee the accuracy or completeness of the information and shall not be liable for any losses arising from the use of this information. Virtual asset investments carry high risks and are subject to significant price volatility. You may lose all of your invested principal. Please fully understand the relevant risks and make prudent decisions based on your own financial situation and risk tolerance. For details, please refer to
Disclaimer.
Related Articles
Bitcoin Spot ETF Saw $760 Million in Inflows Last Week! But Whether the Rally Continues Requires Monitoring 3 Key Factors
US cryptocurrency spot ETFs showed a significant rebound last week, with Bitcoin and Ethereum recording net inflows of approximately $763.4 million and $160.9 million respectively, with prices bouncing back accordingly. Although the market is showing incremental buying signals, it still faces variables from central bank policies and geopolitical risks in the future. The market will continue to monitor ETF capital inflows and macroeconomic impacts.
CryptoCity21m ago
Market rally continues! Bitcoin returns to $75,000 level, ETF inflows persist
Bitcoin broke through $74,000 on March 16 as institutional capital flowed back into the market, with ETF net inflows reaching $1 billion, shifting market sentiment to bullish. Analysts predict Bitcoin could reach $80,000, but it is currently in a consolidation phase. $75,000 is a key resistance level; a breakout could lead to a test of $90,000, otherwise it risks a pullback.
区块客28m ago
MICA Daily | BTC Stable Above 30-Day Moving Average, Continues to Show Bullish Outlook
According to Binance data, Bitcoin's moving average convergence divergence indicator shows significant improvement in its price trend structure, with current trading price around $73,000, and moving averages in a divergent state, reflecting a market transition phase. Technical analysis indicates that the 30-day moving average is of high importance; if the price maintains above this moving average, it indicates buying support, otherwise it may enter a correction phase. Investors will judge the trend based on changes in moving averages.
区块客32m ago
Bitcoin Surges Toward $75,000: $600 Million Short Liquidations Drive Rally, ETF Inflows Emerge as Key Variable
On March 17, Bitcoin tested the 75,000 US dollar level driven by short liquidations, briefly reaching 75,653 US dollars before retreating. This rally was accompanied by massive liquidations totaling approximately 609 million US dollars in 24 hours, with shorts accounting for a significant proportion. Market sentiment has recovered somewhat, with capital inflows into spot demand and ETF support driving Bitcoin's rally. Future price movements will be influenced by sustained capital inflows and macroeconomic data.
GateNews1h ago
