Key Highlights
-
PUMP rallies 30% in one week, showing improving momentum
-
Pump.fun ranks 3rd in protocol fees with $78.78M in 30 days
-
Rounding bottom pattern forms on daily chart
-
Price reclaimed 50-day moving average, shifting trend bias
-
Breakout above $0.00310–$0.00339 could unlock 76% upside
Pump.fun (PUMP), the native token of the popular Solana-based launchpad protocol, is quietly turning heads in the crypto market. Over the past week, PUMP has surged by nearly 30%, supported by strong on-chain growth and a noticeable improvement in price structure.
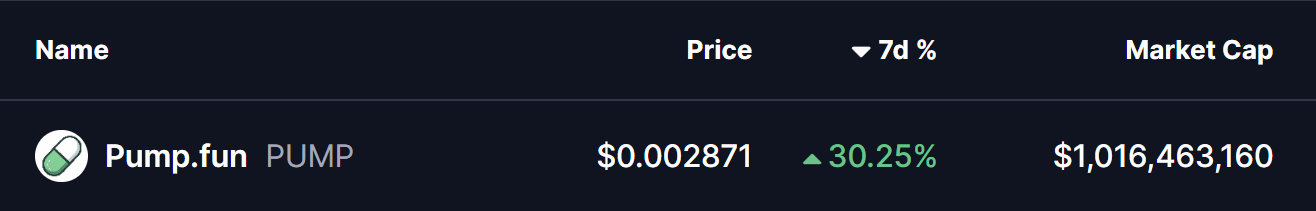
Source: Coinmarketcap
While broader market momentum has helped — with Bitcoin and Ethereum holding firm — PUMP’s recent move appears to be more than just a sympathy rally. Both fundamental metrics and technical structure are beginning to align, raising the possibility that the token may be preparing for a larger upside move if a key breakout level is cleared.
On-Chain Momentum Is Building
Beyond price action, Pump.fun’s protocol activity has been accelerating at an impressive pace. According to DefiLlama, Pump.fun ranked as the third-highest fee-generating crypto protocol over the past 30 days, recording approximately $78.78 million in fees.
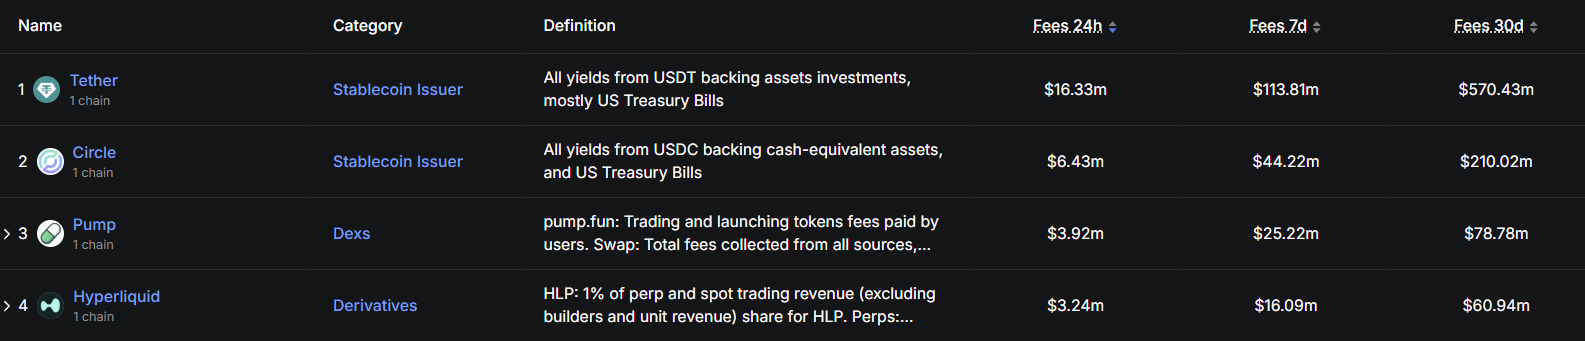
Source: Defillama
This places Pump.fun ahead of major players like Hyperliquid and just behind stablecoin giants such as Tether and Circle. Consistently high fee generation signals sustained user demand, strong protocol usage, and growing economic relevance — all of which often precede longer-term price expansions.
Rounding Bottom Pattern Takes Shape
From a technical perspective, PUMP’s daily chart is now printing a rounding bottom pattern, a classic bullish reversal structure that typically forms after prolonged downtrends and extended accumulation phases.
The pattern began taking shape after PUMP was rejected near the $0.003396 region late last month. That rejection led to a sharp sell-off, pushing price down toward the $0.0017 area. However, sellers gradually lost control at those lows, and downside momentum faded.
Over time, price action stabilized, volatility compressed, and PUMP began to curve higher — forming the smooth, rounded base that characterizes this pattern and recently PUMP reclaimed its 50-day moving average near $0.002453, a level that had previously acted as resistance. Since then, price structure has improved, and higher lows have continued to form.
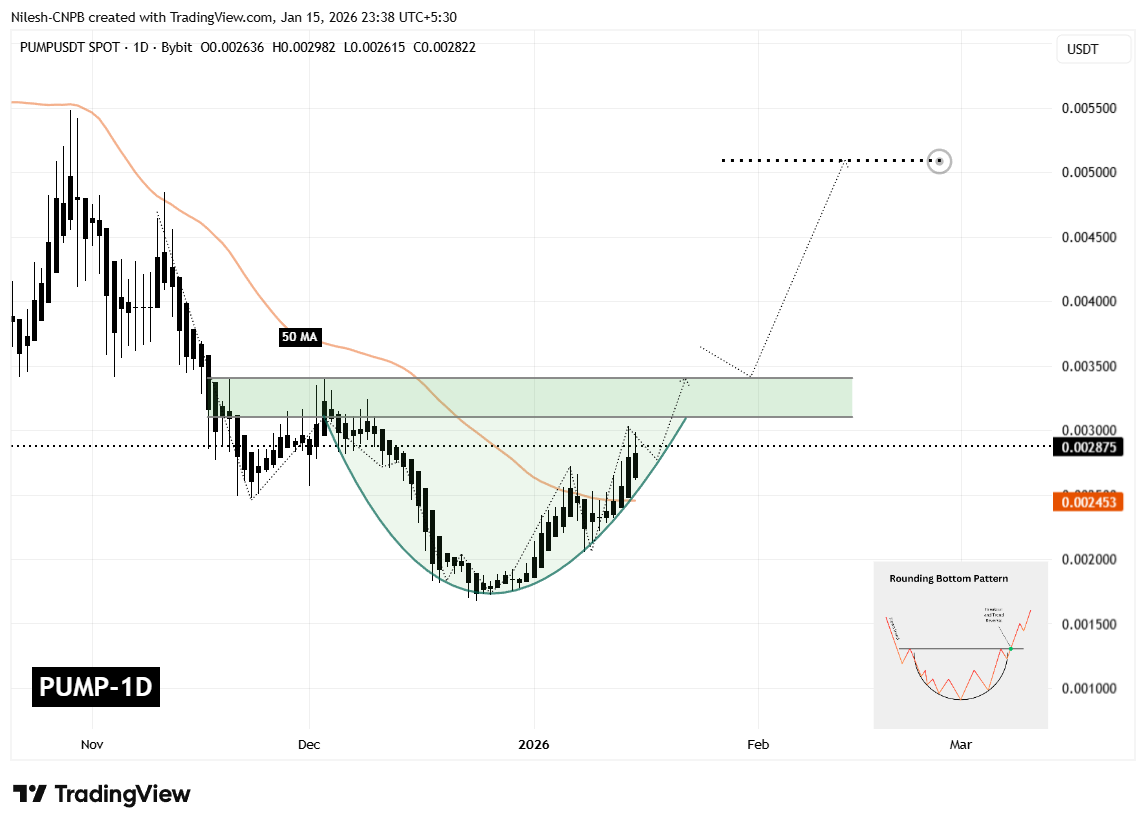
Pump.fun (PUMP) Daily Chart/Coinsprobe (Source: Tradingview)
At present, PUMP is trading around $0.002875 and is pressing into a well-defined resistance zone between $0.003107 and $0.003396. This zone represents the neckline of the rounding bottom pattern and has capped upside attempts multiple times in the past — making it the most important area to watch.
What’s Next for PUMP?
If PUMP can secure a clean daily close above the $0.003107–$0.003396 resistance zone, it would confirm a breakout from the rounding bottom formation. A successful breakout followed by a retest of this zone as support would significantly strengthen the bullish case and suggest that a new upward leg is underway.
Based on the depth of the rounding structure, the measured move projection points toward the $0.005092 region. From current levels, this would represent a potential upside of roughly 76%, aligning well with typical post-breakout expansions seen in this pattern.
That said, patience remains key. Until confirmation occurs, short-term pullbacks — including a dip toward the rising base of the rounding structure — remain possible. Such moves would not invalidate the bullish setup as long as price continues to hold above higher-low support levels.
Bottom Line
Pump.fun is currently sitting at a critical inflection point. Strong on-chain fee growth, improving market structure, and a well-defined bullish reversal pattern all suggest that PUMP may be positioning for a larger move — provided bulls can reclaim and hold the neckline resistance.
For now, the $0.003107–$0.003396 zone remains the line in the sand. How price behaves around this level will likely determine whether PUMP transitions into a sustained bullish phase or remains range-bound for longer.
Frequently Asked Questions (FAQ)
What is Pump.fun (PUMP)?
Pump.fun is a Solana-based token launchpad protocol designed to simplify the creation and trading of new crypto tokens.
Why is PUMP price rising?
PUMP is gaining momentum due to strong on-chain fee growth, increased user activity, and a bullish rounding bottom pattern forming on the chart.
What bullish pattern is forming on PUMP?
PUMP is forming a rounding bottom pattern, which often signals a trend reversal after prolonged consolidation.
What is the key resistance level for PUMP?
The critical resistance zone lies between $0.003107 and $0.003396. A breakout above this range could confirm bullish continuation.
What is the upside target for PUMP?
If the breakout is confirmed, the projected target stands near $0.005092, representing roughly 70–76% upside from current levels.
Disclaimer: The views and analysis presented in this article are for informational purposes only and reflect the author’s perspective, not financial advice. Technical patterns and indicators discussed are subject to market volatility and may or may not yield the anticipated results. Investors are advised to exercise caution, conduct independent research, and make decisions aligned with their individual risk tolerance.
About Author: Nilesh Hembade is the Founder and Lead Author of Coinsprobe, with over 5 years of experience in the cryptocurrency and blockchain industry. Since launching Coinsprobe in 2023, he has been providing daily, research-driven insights through in-depth market analysis, on-chain data, and technical research.
Disclaimer: The information on this page may come from third parties and does not represent the views or opinions of Gate. The content displayed on this page is for reference only and does not constitute any financial, investment, or legal advice. Gate does not guarantee the accuracy or completeness of the information and shall not be liable for any losses arising from the use of this information. Virtual asset investments carry high risks and are subject to significant price volatility. You may lose all of your invested principal. Please fully understand the relevant risks and make prudent decisions based on your own financial situation and risk tolerance. For details, please refer to
Disclaimer.
Related Articles
US-Iran Tensions Escalate, Bitcoin Viewed as "Flight Asset"
US-Iran tensions are escalating, with markets beginning to price in prolonged conflict, impacting oil, shipping, and supply chain costs. Investors are focusing on hard assets and related resource sectors, while facing stagflation risks. It is recommended to adopt defensive trading strategies and currency diversification.
GateNews11m ago
Six Countries' Joint Statement on Defending the Strait of Hormuz, But No Specifics on What to Do? Brent Crude Falls Below $110
The UK, France, Germany, Italy, the Netherlands, and Japan released a joint statement on the 19th, committing to take "appropriate measures" for navigation safety in the Strait of Hormuz, but did not specify concrete actions, leaving political flexibility. The statement condemned Iran's attacks on commercial vessels, demanded its compliance with international law, and supported increased production to stabilize energy markets. This declaration has sparked external scrutiny and analysis, particularly regarding the ambiguity of the term "appropriate measures."
動區BlockTempo27m ago
Solana Price Trend Shows Bearish Technical Pattern, Higher Time Frames Exhibit Weakness
Gate News Report: On March 20, Solana (SOL) price action displayed bearish technical formations on higher timeframes, with the market showing weakness. Technical charts indicate that SOL has formed bearish structures across multiple timeframes, with price action under pressure.
GateNews1h ago
Israel Signals De-escalation in Conflict, Oil Prices Decline, Bitcoin Rebounds After Breaking Below 69K
Israeli Prime Minister Netanyahu's speech prompted oil prices to decline and reduced market tension. The crypto market continued to weaken, with Bitcoin briefly falling below 69K. ETF outflows indicate institutional profit-taking, and the Fear and Greed Index has retreated into the fear zone.
ChainNewsAbmedia1h ago
SOL price is positioned in the $92-95 range, with the market in a recovery phase.
Gate News update: On March 19th, Solana (SOL) price is currently trading in the $92-95 range. Recent price movements indicate that the market is in a recovery phase, with prices fluctuating within this range.
GateNews3h ago
River (RIVER) Weekly Gains Hit 50%, Market Divided on Future Outlook
River (RIVER) token's price has risen by 50% in the last week, leading to mixed opinions; some analysts foresee a potential rise above $50, while others advise traders to remain cautious.
GateNews4h ago
