
**Date: **Sat, Jan 03, 2026 | 01:26 PM GMT
As 2026 kicks off, the broader cryptocurrency market is showing renewed stability. Ethereum (ETH) has reclaimed the $3,100 level, and several major altcoins are already beginning to pick up momentum. Against this improving backdrop, Kaspa (KAS) is quietly positioning itself as a potential late mover, with its chart structure starting to flash early bullish signals.
While KAS is trading slightly in the red today and remains mostly flat on the weekly timeframe, the more important story is unfolding beneath the surface. Recent price action suggests a meaningful structural shift may be underway — one that could mark the early stages of a bullish continuation if confirmed.
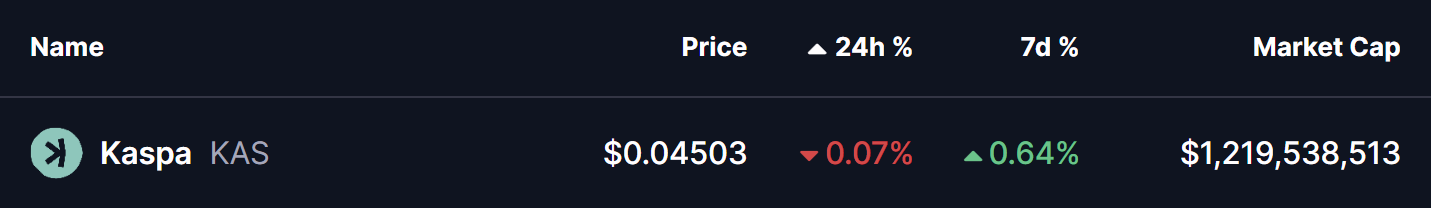
Source: Coinmarketcap
Rounding Bottom in Play
On the 4-hour timeframe, Kaspa appears to be forming a rounding bottom pattern, a classic bullish reversal structure that typically develops after a prolonged corrective phase. This pattern reflects a slow but steady transition from distribution to accumulation, as selling pressure weakens and buyers gradually regain control.
The setup began after KAS faced strong rejection near the $0.06310 neckline zone, which triggered a sharp decline through late November and December. That downside move eventually found strong demand near the $0.040 level, which has since acted as a key support area. Multiple defenses of this zone prevented further downside and helped establish a stable base for a potential trend reversal.
Since carving out that bottom, KAS has started to curve higher in a smooth, rounded fashion — closely matching the textbook structure of a developing rounding bottom. The recent stabilization above the $0.045 region further supports the idea that downside momentum is fading.
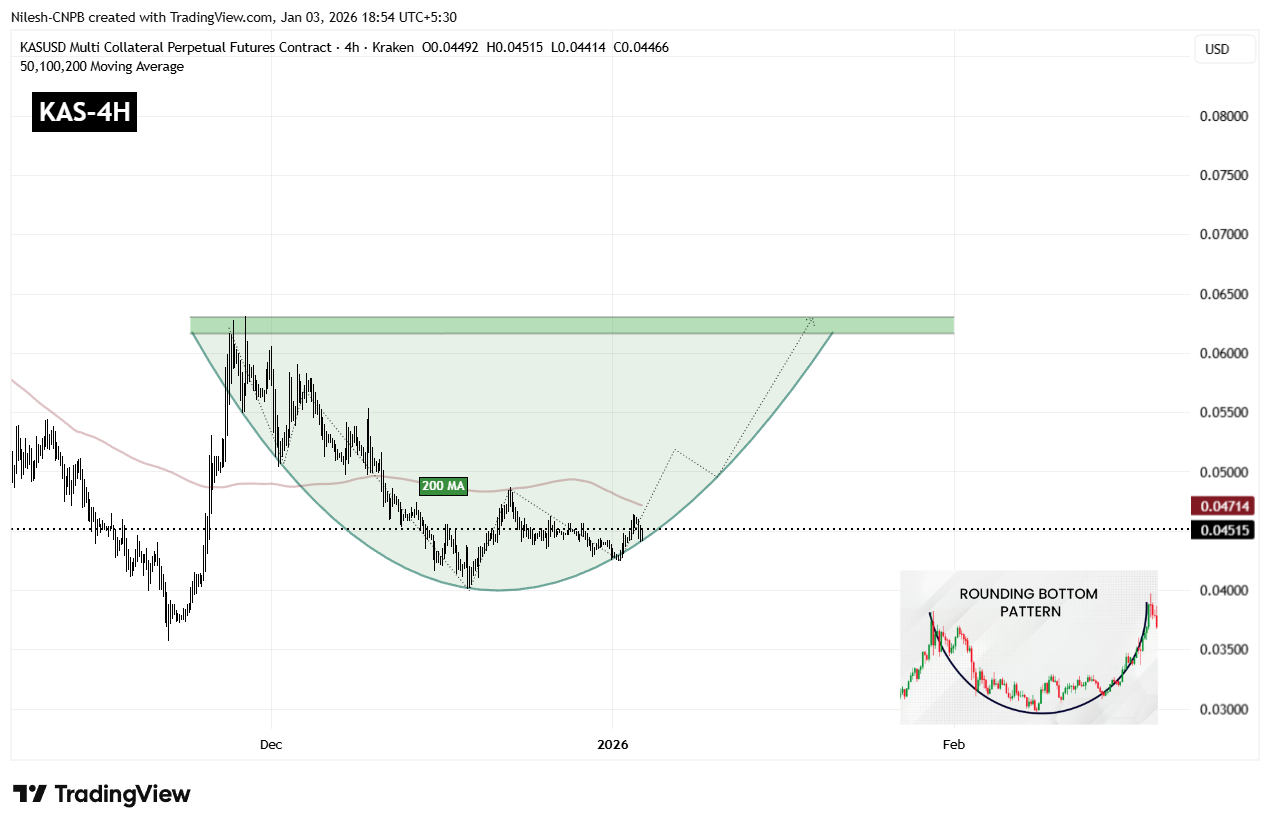
Kaspa (KAS) 4H Chart/Coinsprobe (Source: Tradingview)
A key technical level now comes into focus: the 200-period moving average, currently hovering near $0.04714. This level has acted as dynamic resistance during the recovery phase, and reclaiming it would mark an important shift in short-term market structure.
A sustained move above the 200 MA would indicate that buyers are regaining control after months of corrective price action and could act as the trigger for a stronger upside continuation.
What’s Next for KAS?
For full confirmation of the rounding bottom pattern, KAS must eventually reclaim the $0.06310 neckline resistance. A clean breakout above this zone would validate the entire reversal structure and could open the door to a broader bullish expansion phase, with momentum traders likely re-entering the market.
Until that breakout occurs, the pattern remains in development. Short-term consolidation or shallow pullbacks remain possible, especially near moving average resistance. However, as long as price continues to hold above the $0.04245 support base and maintains higher lows, the broader bottoming structure remains intact and constructive.
In the near term, all eyes remain on the 200 MA and the neckline zone. How Kaspa reacts around these levels will likely determine whether this emerging bullish setup evolves into a confirmed breakout move or requires more time to mature.
Disclaimer: The views and analysis presented in this article are for informational purposes only and reflect the author’s perspective, not financial advice. Technical patterns and indicators discussed are subject to market volatility and may or may not yield the anticipated results. Investors are advised to exercise caution, conduct independent research, and make decisions aligned with their individual risk tolerance.
About Author: Nilesh Hembade is the Founder and Lead Author of Coinsprobe, with over 5 years of experience in the cryptocurrency and blockchain industry. Since launching Coinsprobe in 2023, he has been providing daily, research-driven insights through in-depth market analysis, on-chain data, and technical research.
Disclaimer: The information on this page may come from third parties and does not represent the views or opinions of Gate. The content displayed on this page is for reference only and does not constitute any financial, investment, or legal advice. Gate does not guarantee the accuracy or completeness of the information and shall not be liable for any losses arising from the use of this information. Virtual asset investments carry high risks and are subject to significant price volatility. You may lose all of your invested principal. Please fully understand the relevant risks and make prudent decisions based on your own financial situation and risk tolerance. For details, please refer to
Disclaimer.
Related Articles
Why Did the Crypto Market Decline? Bitcoin Loses Key Support as Macro Headwinds and Technical Breakdown Converge
The cryptocurrency market continues to decline, with total market capitalization falling to $2.32 trillion, as sellers dominate and market sentiment weakens. The escalation of Middle East tensions and macroeconomic pressures are also affecting the stock market. Bitcoin's price has broken through key support levels, facing further downside risks in the short term. If it fails to stabilize at key levels, the market may continue to move lower.
GateNews5m ago
Bitcoin Uptrend Likely by Late 2026, Says Scaramucci
The latest downturn in Bitcoin has sparked fresh debate across the crypto market. However, according to Anthony Scaramucci, the explanation may be far less surprising than many expect. The SkyBridge Capital managing partner believes the current pullback is simply part of Bitcoin’s long-standing
Coinfomania43m ago
Panic sentiment surges, "hedging costs" reach new highs! VanEck: Bitcoin may be approaching a reversal point
VanEck's research shows that the Bitcoin market is currently in a state of extreme anxiety. Despite rising hedging costs, traders are actively seeking downside protection. The report points out that while leverage and volatility have decreased, the options market is displaying panic signals, with put premiums reaching new highs. However, historical data suggests that extreme panic often precedes a rebound, and significant market turning points may emerge in the future.
区块客47m ago
TRUMP Token May Test Historical Lows Again? $70 Million Sell Pressure Incoming, $3 Level in Jeopardy
Trump token TRUMP has continued to decline recently, with the current price at $3.21, down 1.32% intraday and approaching its historical low of $2.705. On-chain data shows selling pressure has not been fully released, with significant major capital outflows. Technical analysis indicates that if the trend continues, the price could decline to $2.71, with $3.00 serving as psychological support. Market sentiment has turned cautious.
GateNews49m ago
MICA Daily | Why Have Stocks Fallen While Crypto Has Risen Recently? Analyzing the Truth Behind the Decoupling
Since October 2025, the positive correlation between Bitcoin and the S&P 500 Index has significantly weakened, entering a decoupling phase. This change stems from large-scale liquidation events, depressed market liquidity, and reduced risk appetite among traders. Meanwhile, ETF outflows and geopolitical tensions have also impacted Bitcoin's performance, demonstrating that its potential as a safe-haven asset is gradually increasing as deleveraging comes to an end.
区块客50m ago
Bitcoin Rebound Timeline Exposed: Scaramucci Says Q4 May Launch New Bull Market, $1 Million Target Unchanged
Under geopolitical risks and macroeconomic pressures, Bitcoin's price has broken below $68,000. Anthony Scaramucci, founder of SkyBridge Capital, believes this represents a typical cyclical pullback and anticipates Bitcoin may rally again in 2026. Despite short-term market risks, long-term bullish sentiment remains solid.
GateNews51m ago
