
**Date: **Fri, Jan 02, 2026 | 03:10 PM GMT
The broader cryptocurrency market has started the new year with modest strength, as both Bitcoin (BTC) and Ethereum (ETH) trade firmly in the green with gains of over 2%. While this positive momentum is lifting most altcoins, the privacy-focused token Zcash (ZEC) is moving against the broader trend.
ZEC is down more than 8% on the day. However, despite the red candles, the daily chart suggests this pullback may be a healthy bullish retest rather than the start of a trend reversal.
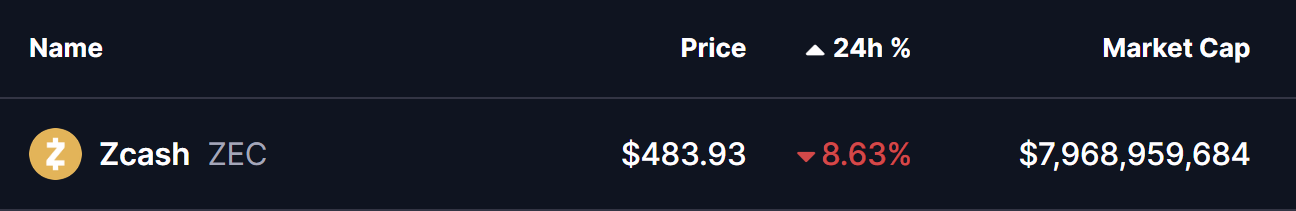
Source: Coinmarketcap
Retesting the Ascending Triangle Breakout
On the daily timeframe, ZEC had been consolidating inside a well-defined ascending triangle pattern, characterized by a series of higher lows pressing against a flat resistance zone near $476. This structure signaled steady accumulation and growing buyer confidence.
Earlier, bulls successfully broke above the $476 ceiling with strong momentum, sending ZEC sharply higher by nearly 66% — from the breakout base to a local peak around $556.59. This move confirmed the validity of the pattern and marked a clear shift in market structure.
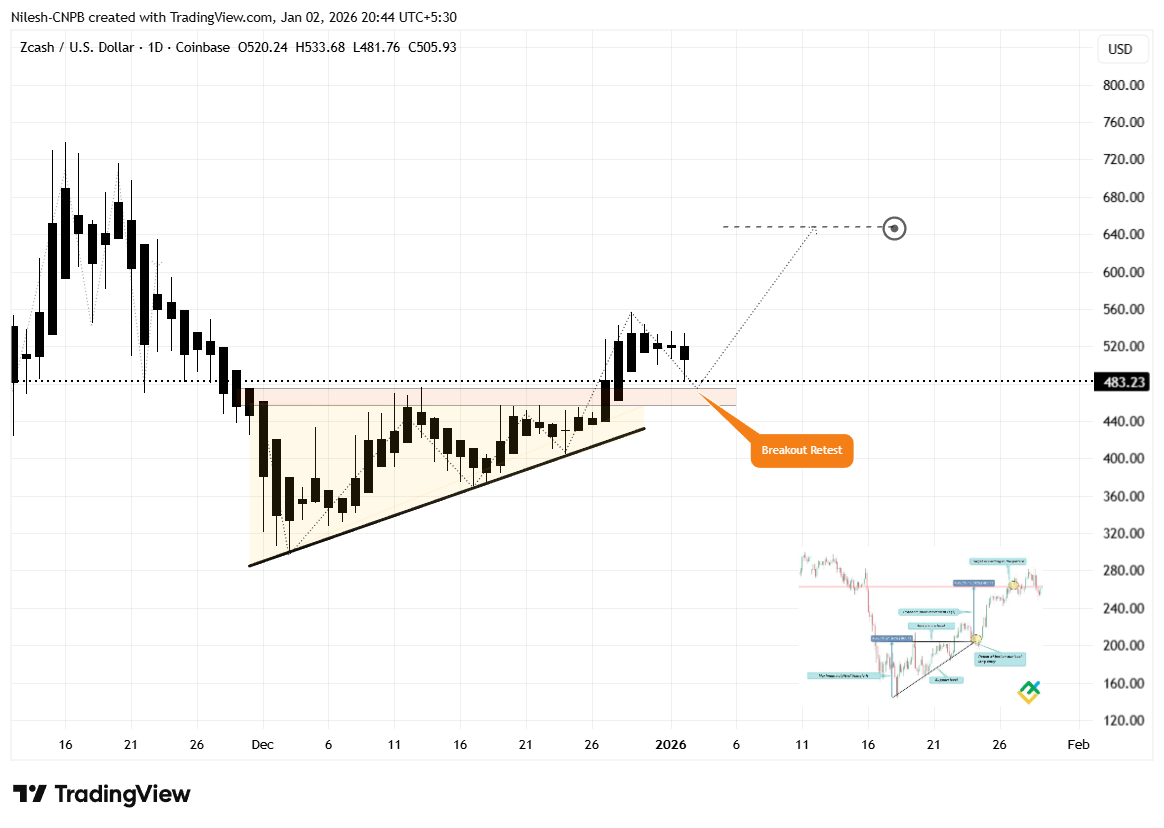
Zcash (ZEC) Daily Chart/Coinsprobe (Source: Tradingview)
Following that rally, price has pulled back and is now trading near the $483 region. Crucially, this zone aligns closely with the former breakout level, making it a classic resistance-turned-support area. Such retests are common after strong breakouts and often act as a launchpad for the next leg higher if buyers defend the level.
What’s Next for ZEC?
The current retest phase is technically constructive, but the next move will depend on whether bulls can firmly defend the broader $426–$476 support zone. A strong reaction from this area would signal that buyers remain in control and are using the dip to accumulate.
If support holds and momentum returns, ZEC’s first key objective will be a reclaim of the $556.59 local high. A decisive move above this level would confirm strength and open the door for further upside.
In that scenario, ZEC could advance toward the ascending triangle’s measured target near $647.73, representing a potential upside of roughly 32% from current levels.
On the downside, failure to hold above the $426 support zone would weaken the bullish breakout structure and raise the risk of a deeper pullback, potentially turning the recent move into a failed breakout.
For now, all eyes remain on the breakout retest. How ZEC reacts around this key support area will likely determine whether the recent rally was just the beginning — or a move that needs more time to rebuild momentum.
Disclaimer: The views and analysis presented in this article are for informational purposes only and reflect the author’s perspective, not financial advice. Technical patterns and indicators discussed are subject to market volatility and may or may not yield the anticipated results. Investors are advised to exercise caution, conduct independent research, and make decisions aligned with their individual risk tolerance.
About Author: Nilesh Hembade is the Founder and Lead Author of Coinsprobe, with over 5 years of experience in the cryptocurrency and blockchain industry. Since launching Coinsprobe in 2023, he has been providing daily, research-driven insights through in-depth market analysis, on-chain data, and technical research.
Disclaimer: The information on this page may come from third parties and does not represent the views or opinions of Gate. The content displayed on this page is for reference only and does not constitute any financial, investment, or legal advice. Gate does not guarantee the accuracy or completeness of the information and shall not be liable for any losses arising from the use of this information. Virtual asset investments carry high risks and are subject to significant price volatility. You may lose all of your invested principal. Please fully understand the relevant risks and make prudent decisions based on your own financial situation and risk tolerance. For details, please refer to
Disclaimer.
Related Articles
This Friday Traditional Financial Markets Welcome 'Quadruple Witching Day,' Bitcoin Volatility May Rise Accordingly
This Friday will see the quarterly derivatives event "Quadruple Witching Day," which may lead to increased market volatility. The current market environment is highly volatile, with the VIX index breaking through 35, and Bitcoin volatility is also likely to rise. Additionally, on March 27th, there is a large-scale derivatives expiration, which will intensify market volatility risks.
GateNews23m ago
XRP trading price is $1.43, and the RSI indicator shows oscillation in the neutral zone.
Gate News reported that on March 19, XRP is currently trading at $1.43, with a Relative Strength Index (RSI) of 49.65, sitting in the neutral zone. Technical analysis shows XRP price oscillating between the $1.40 support level and the $1.50 resistance level.
GateNews55m ago
ZANO Roars Back, Records 11.2% As Bullish Rectangle Structure Prints Continuing Market Rally: Ana...
Zano (ZANO) coin is experiencing a surge in price and trading volume, reaching $7.25. Analysts note a bullish rectangle pattern indicating sustained upward momentum, reflecting increased demand for privacy-focused cryptocurrencies amid broader market recovery.
BlockChainReporter1h ago
BTC rises 0.74% in 15 minutes: FOMC meeting digestion and short covering drive short-term volatility
Between 2026-03-19 15:45 to 16:00 (UTC), BTC experienced a 15-minute price range of 68787.0 to 69550.9 USDT, achieving a realized return rate of +0.74% with an amplitude of 1.11%. During the same period, market attention increased, short-term volatility intensified, and fund behavior and sentiment indicators both showed concentrated changes.
The primary driver of this price movement was the conclusion of the FOMC meeting, after which the market saw no new bearish catalysts. Some short sellers chose to cover their positions, providing upward momentum to the price in the short term. Additionally, while ETF fund outflows reflected institutional profit-taking, they did not form a sustained trading
GateNews1h ago
Aster (ASTER) Price Rejected Again at $0.80 – Is a Sharp Drop Next?
Aster (ASTER) is once again facing trouble at the $0.80 level, and the repeated rejection is starting to raise concerns. What once looked like a potential breakout is now turning into a clear area of resistance that the price simply can’t overcome.
This level has held firm since December,
CaptainAltcoin1h ago
Bitcoin Price Discovery Mechanism Shifts to Derivatives-Driven Model, 2024 ETF Approval Becomes Key Turning Point
Bitcoin's price mechanism is shifting from spot-driven dynamics to derivative ecosystem influences, with the introduction of financial instruments like futures and options significantly shaping price discovery. Investors are adopting more sophisticated strategies, incorporating Bitcoin into macro asset allocation frameworks, reflecting the market structure's increasing impact on price formation.
GateNews2h ago
