
**Date: **Tue, Jan 06, 2026 | 10:08 AM GMT
The broader cryptocurrency market continues to show fresh strength at the start of the new year. Both Bitcoin (BTC) and Ethereum (ETH) are posting weekly gains of over 6%, helping restore confidence across the market. This improving sentiment is now spilling over into major altcoins — including Jupiter (JUP).
JUP has already delivered an impressive 20% gain on the week. While the short-term momentum is encouraging, the more important development is unfolding on the higher-timeframe chart. Recent price action suggests a meaningful shift in market behavior, hinting that JUP could be transitioning from a corrective phase into a broader bullish continuation if key resistance zones are reclaimed.
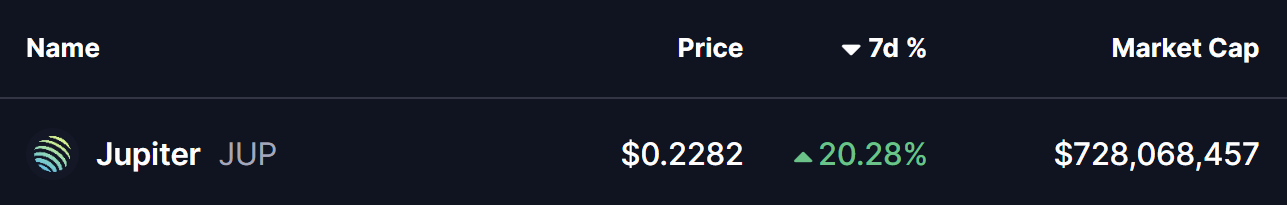
Source: Coinmarketcap
Rounding Bottom Formation Taking Shape
On the daily chart, Jupiter appears to be forming a rounding bottom pattern — a classic bullish reversal structure that typically develops after extended downside pressure and gradual seller exhaustion.
This setup began after JUP faced a strong rejection from the $0.4540–$0.4760 resistance zone in late October. That rejection triggered a sharp sell-off, dragging price lower toward the $0.17 region. However, bears failed to maintain control beyond that point. Selling pressure faded, demand began to absorb supply, and price started stabilizing.
Over time, volatility compressed and JUP began curling higher in a smooth, rounded fashion — closely matching the textbook behavior of a developing rounding bottom. Importantly, the recent recovery has pushed price back above the 50-day moving average around $0.2192, a level that previously capped upside attempts and now appears to be turning into support.
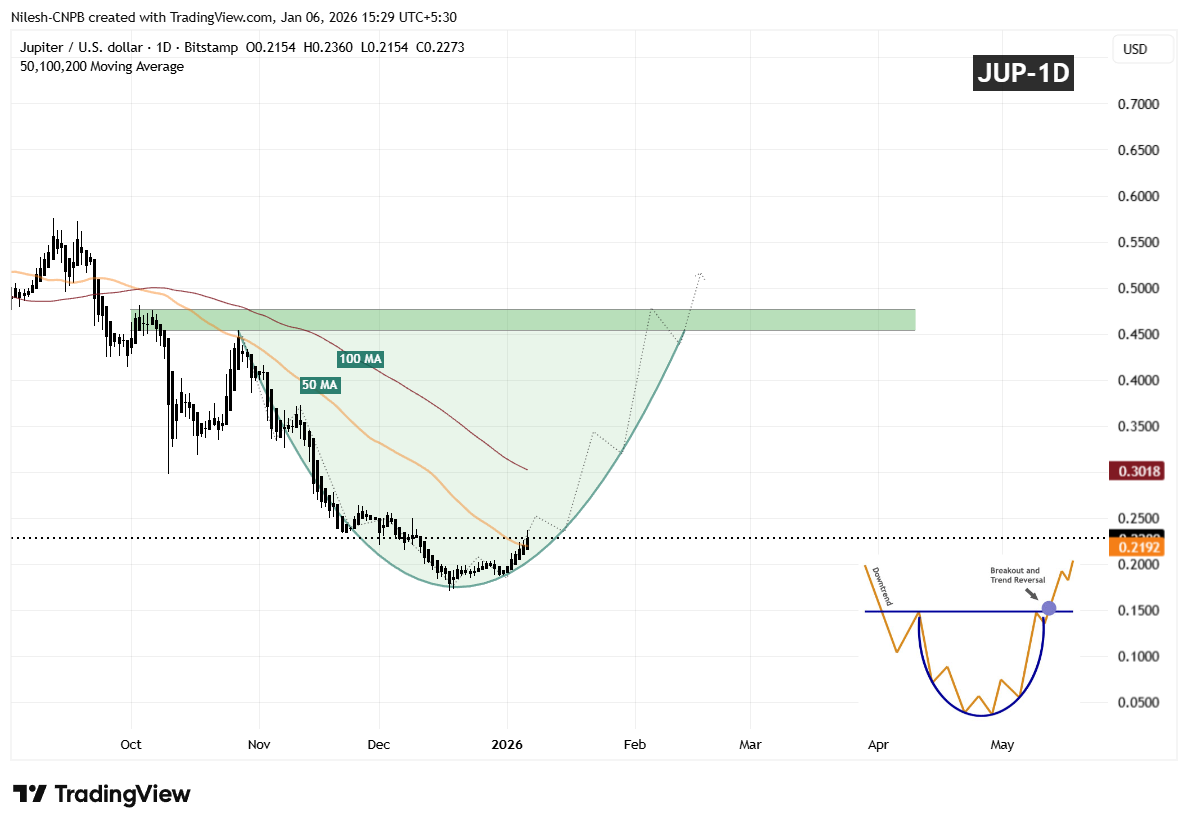
Jupiter (JUP) Daily Chart/Coinsprobe (Source: Tradingview)
The gradual slope of the recovery suggests organic accumulation rather than speculative spikes, reinforcing the credibility of the developing base.
What’s Next for JUP?
If JUP continues to hold above the 50-day moving average, this level could serve as a solid foundation for further upside, with the 100-day moving average acting as the next upside magnet in the near term.
A clean and decisive breakout above the $0.4540–$0.4760 resistance zone, followed by sustained acceptance above that area, would confirm the rounding bottom reversal and likely open the door for a broader bullish expansion phase.
Until that breakout occurs, the pattern remains in development. Some short-term consolidation or shallow pullbacks are possible as price digests recent gains. However, as long as JUP continues to print higher lows above the established base, the broader structure remains constructive.
For now, the chart suggests Jupiter is approaching a critical confirmation phase — one that could determine whether this recovery matures into a sustained bullish trend as 2026 progresses.
Disclaimer: The views and analysis presented in this article are for informational purposes only and reflect the author’s perspective, not financial advice. Technical patterns and indicators discussed are subject to market volatility and may or may not yield the anticipated results. Investors are advised to exercise caution, conduct independent research, and make decisions aligned with their individual risk tolerance.
About Author: Nilesh Hembade is the Founder and Lead Author of Coinsprobe, with over 5 years of experience in the cryptocurrency and blockchain industry. Since launching Coinsprobe in 2023, he has been providing daily, research-driven insights through in-depth market analysis, on-chain data, and technical research.
Disclaimer: The information on this page may come from third parties and does not represent the views or opinions of Gate. The content displayed on this page is for reference only and does not constitute any financial, investment, or legal advice. Gate does not guarantee the accuracy or completeness of the information and shall not be liable for any losses arising from the use of this information. Virtual asset investments carry high risks and are subject to significant price volatility. You may lose all of your invested principal. Please fully understand the relevant risks and make prudent decisions based on your own financial situation and risk tolerance. For details, please refer to
Disclaimer.
Related Articles
Pi Network mainnet migration triggers CEX deposits, bulls defend the 0.1736 USDT support line to the death
After Pi Network’s second mainnet migration, about 119,000 users completed KYC verification, resulting in more than 1.12 million PI tokens flowing into centralized exchanges and creating short-term selling pressure. Technical analysis shows that $0.1736 is a key support level, and the Protocol 21 upgrade on April 6 will affect token stability and application expansion.
MarketWhisper16m ago
The PI bulls remain steadfast at the critical support level that marks the decisive point between the second phase of the migration wave
Pi Network saw a 2% rise on Tuesday, maintaining key support amid US-Iran tensions. The second mainnet migration led to increased PI deposits on exchanges, highlighting ecosystem challenges. Technical indicators show potential recovery, but resistance remains at $0.1872.
TapChiBitcoin30m ago
Bitcoin Greed Index hits the bottom: retail investors panic, but long-term holders quietly accumulate coins
The Bitcoin Fear and Greed Index recorded a score of 8 on March 30, indicating extreme pessimism in the market. Maintaining this state for 59 days, it is the longest fear period since the 2022 FTX collapse. Despite subdued retail sentiment, long-term holders have moved Bitcoin to self-custody accounts for protection, with no sign of selling pressure—showing behavior consistent with historical bottom characteristics. With the current market influenced by multiple macro factors and lacking a clear rebound catalyst, the timeline for recovery remains difficult to predict.
MarketWhisper41m ago
Michael Saylor “Laser Eyes” post surpasses 1 million views, billionaires follow up by buying crypto
MicroStrategy Executive Chairman Saylor has restarted the laser eyes symbol, expressing his bullish conviction in Bitcoin, and contrasting it with the current market’s fear sentiment. MicroStrategy holds 761,068 Bitcoins and plans to increase that to 1,000,000 by 2026. Real estate billionaire Grant Cardone has also announced additional Bitcoin purchases, strengthening market confidence and signaling a long-term hold.
MarketWhisper1h ago
Hyperliquid whale puts on a short position in Bitcoin worth 53 million, the market is wary of downside risk
On the decentralized sustainable derivatives exchange Hyperliquid, a whale trader opened a leveraged short Bitcoin position worth $53.0 million, with a liquidation price of $80,630. At the same time, the trader also holds short positions in silver and multiple altcoins, as well as a long position in Brent crude oil, reflecting its bearish outlook on the current market. Geopolitics, regulatory uncertainty, and the upcoming employment data make up the threefold pressure weighing on this week’s market.
MarketWhisper1h ago
BTC 15-minute surge 0.80%: spot incremental buy orders and changes in the order book structure drive a price breakout
From 2026-03-31 01:15 to 2026-03-31 01:30 (UTC), BTC showed a clear breakout move. The candlestick data indicates a return rate of +0.80%, with the price ranging between 67,241.1 and 67,884.3 USDT, and a recorded amplitude of 0.96%. During this period, trading activity in the market was active, risk appetite rebounded, and short-term bullish sentiment dominated, driving the price to break through local resistance.
The main driving forces behind this breakout were the synchronized rise in trading volume across the spot and derivatives (futures/perpetual) markets, along with a significant net inflow of funds into exchanges. The spot trading volume surged sharply compared with the average value of the previous hour.
GateNews2h ago
