JasmyCoin (JASMY), Cosmos (ATOM), and Bittensor (TAO) are emerging as the most impressive-performing cryptocurrencies in the past 24 hours. Leading the market enthusiasm, JasmyCoin has broken out strongly with double-digit gains, as buying pressure continues to dominate and fuel expectations of reaching higher milestones. Conversely, Cosmos and Bittensor, although still maintaining a positive trend, are beginning to slow down as their upward momentum weakens after six consecutive recovery sessions.
JasmyCoin Approaches a Key Psychological Level
As of Wednesday, JasmyCoin is trading around $0.00950, following an impressive breakout with a 27% increase in the previous session. This strong recovery is pushing JASMY close to the 200-day EMA at $0.01105 – a critical technical threshold.
In the scenario where the price decisively breaks above this long-term moving average, the bullish trend is likely to be reinforced and expanded, with the next target around $0.01361 – a level last tested on 10/3.
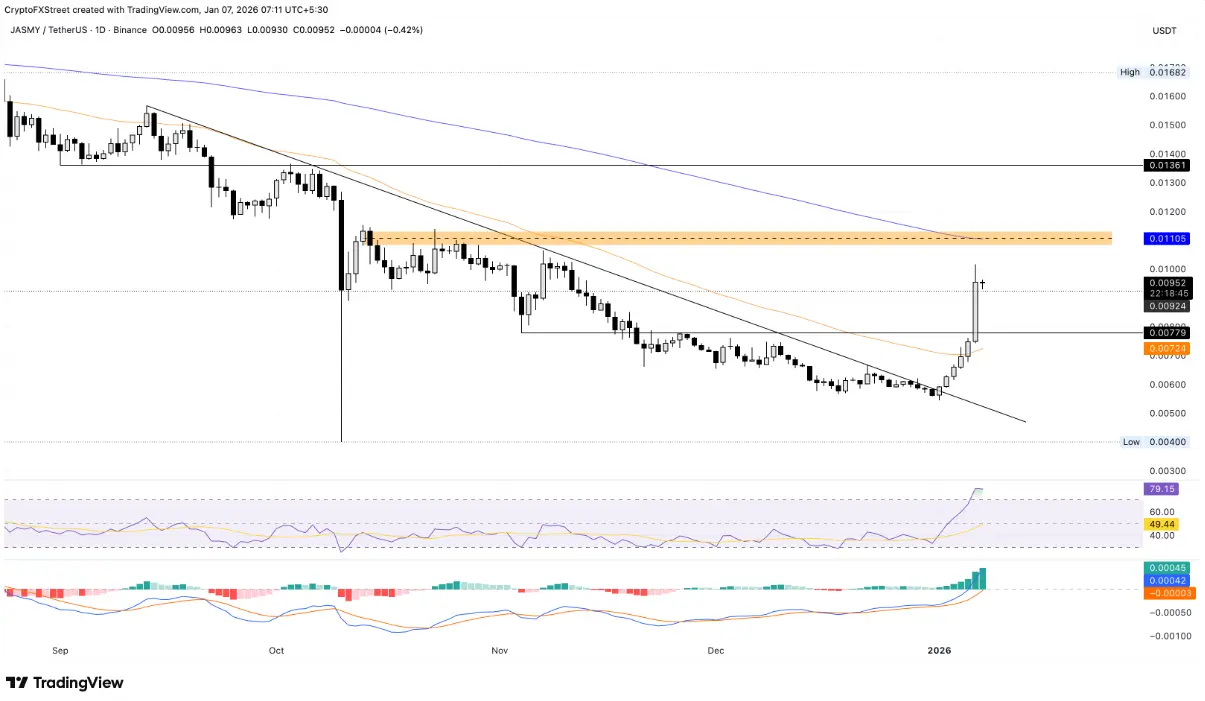 Daily JASMY/USDT Chart | Source: TradingView Technical signals on the daily timeframe are clearly favoring the bulls. The RSI has surged to 79, entering overbought territory, indicating strong buying pressure but also warning of a potential correction if the rally becomes overheated.
At the same time, momentum remains supported as the MACD continues its steady upward trend, accompanied by expanding green histogram bars, reflecting the strength of the current bullish momentum.
In a less optimistic scenario, if JASMY fails to sustain its upward momentum and reverses from the $0.01000 level, the price could retreat to test the support at $0.00779 – the recent low established on 11/4.
Cosmos Cannot Extend 6-Day Recovery Streak
Cosmos experienced a slight correction of about 2% as of Wednesday, ending its six consecutive days of gains. The daily decline pushed the price back toward the 2.346 USD low formed on 11/4, and it approached the 50-day EMA at $2.321 – a key support zone.
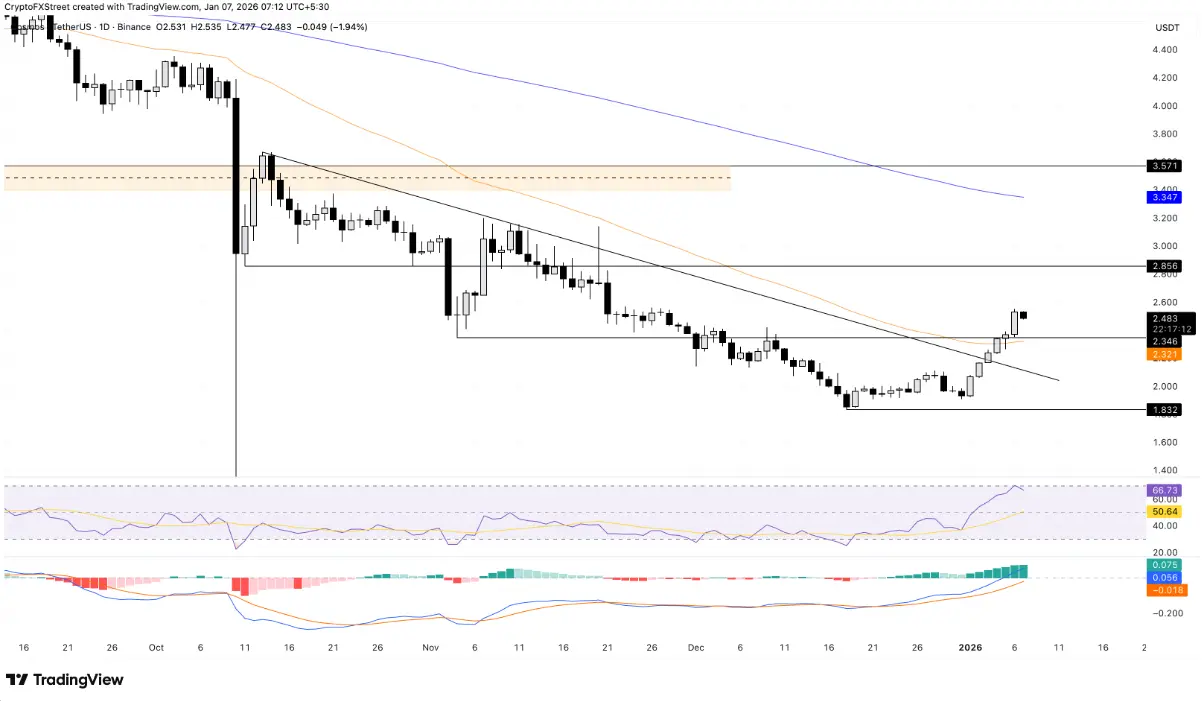 Daily ATOM/USDT Chart | Source: TradingView On the daily timeframe, momentum indicators are sending mixed signals as ATOM’s price trend shows signs of stalling. The RSI has fallen to 66 after leaving overbought territory, reflecting waning buying strength. Conversely, the MACD and its signal line continue to expand upward, indicating that the overall bullish momentum remains intact.
On the downside, the October 11 low around $2.856 now stands out as the nearest resistance level that bulls need to overcome to resume the upward trend.
Bittensor’s Recovery Stalls Below $300
Bittensor (TAO) failed to sustain its six-day recovery streak when it was unable to break through the psychological $300 level. At the time of reporting, TAO was down over 3% in Wednesday’s session, approaching the 50-day EMA at around $271 – just slightly above the critical support zone at $260.
In a negative scenario, if the $260 support is broken, selling pressure could increase, pushing the price down toward $206 – the low established on 12/24.
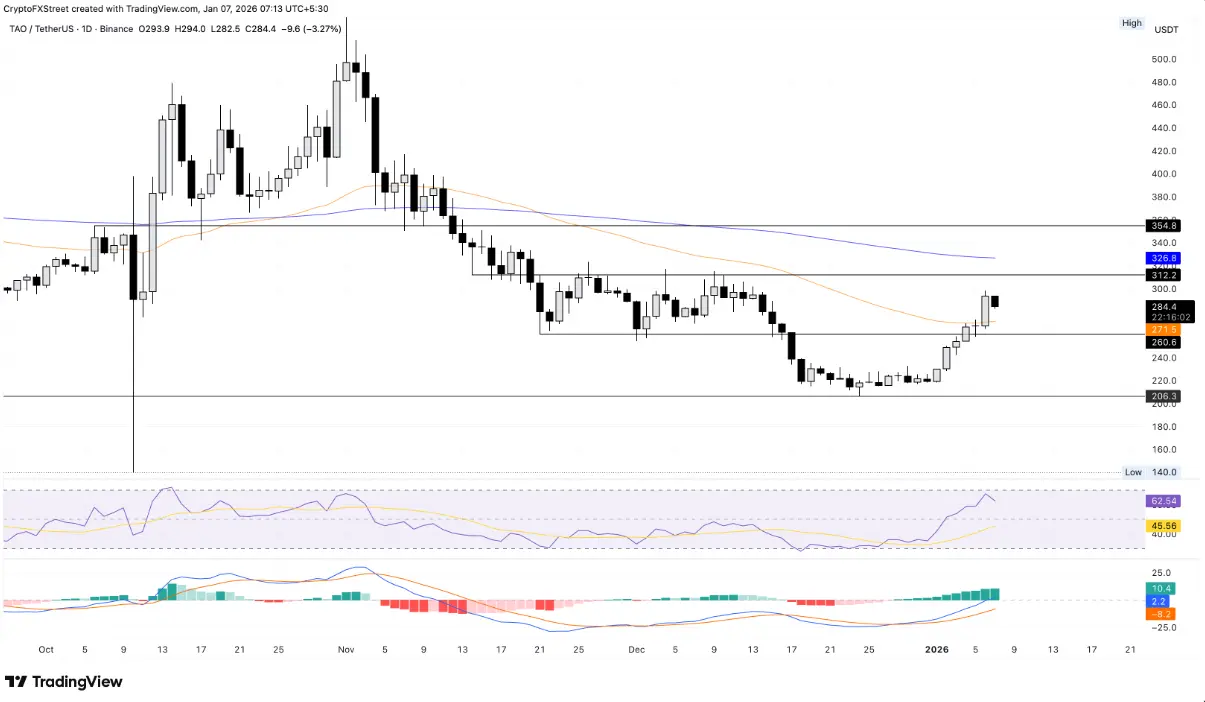 Daily TAO/USDT Chart | Source: TradingView Similar to Cosmos, momentum indicators on TAO are sending mixed signals. The RSI at 62 has turned downward from overbought levels, while the MACD and its signal line continue to trend upward, suggesting that buying interest has not fully waned.
Conversely, if TAO successfully regains the $300 level, the rally may face significant resistance at around $312 – the nearest resistance level tested on 12/12.
Disclaimer: The information on this page may come from third parties and does not represent the views or opinions of Gate. The content displayed on this page is for reference only and does not constitute any financial, investment, or legal advice. Gate does not guarantee the accuracy or completeness of the information and shall not be liable for any losses arising from the use of this information. Virtual asset investments carry high risks and are subject to significant price volatility. You may lose all of your invested principal. Please fully understand the relevant risks and make prudent decisions based on your own financial situation and risk tolerance. For details, please refer to
Disclaimer.
Related Articles
Dogecoin Tests $0.090 Support After 3.4% Drop as Traders Watch Key Price Range
Dogecoin is currently trading at $0.09061 which is a drop of 3.4 percent, and the price is close to the important level of $0.09011 support.
The chart indicates a series of tests of the support zone of $0.089-$0.090, and the closest resistance is represented by $0.09353.
A hold of
CryptoNewsLand23m ago
PEPE Price at $0.053259 as Tight Range and Falling Volume Shape Short-Term Market Activity
PEPE was traded at $0.053259 and has recorded a 3.0 percent fall in value but it is within a thin band of support and resistance.
The market exhibited a volume of 235.15M in 24 hour trading, which is a decline of 19.16% reflecting less trading activity.
Technical indicators are not
CryptoNewsLand28m ago
XRP ETF Performance Praised as 'Really Impressive' by Bloomberg - U.Today
XRP ETFs have shown resilience amid a 45% price drop, attracting significant capital despite typical market behavior. Bloomberg's Eric Balchunas highlights strong investor support. Despite recent outflows, the funds retain substantial assets, indicating community dedication.
UToday48m ago
Crypto Shines Amid Middle East Oil Shock and Market Selloff
Bitcoin remains stable amid market turmoil fueled by rising oil prices and inflation, outperforming traditional assets. Its reduced leverage limits forced selling, attracting long-term investors eyeing potential gains in a volatile landscape.
CryptoFrontNews53m ago
XRP Holds $1.34 Support While Leverage Heatmap Highlights $1.30 Risk Zone
XRP is trading at $1.36 in a tight range of support at $1.34 and resistance at $1.37.
The heatmap data indicates that there is a huge amount of long positions in the range of $1.30.
Should prices fall to around $1.30, long positions with high leverage in this region might
CryptoNewsLand1h ago
ETH drops 1.07% in 15 minutes: whale fund concentration triggers short-term pullback
March 10, 2026, 18:00 to 18:15 (UTC), ETH's return within the 15-minute candlestick was -1.07%, with price fluctuations ranging from 2049.1 to 2073.15 USDT, an amplitude of 1.16%. During the same period, market trading volume significantly increased by over 32%, large on-chain fund flows occurred frequently, triggering short-term market sentiment fluctuations, rapidly increasing attention, and intensifying volatility risks.
The main driver of this abnormal movement is the concentrated sell-off by whale funds. On-chain data shows that within this time window, there were four large transfers exceeding 5000 ETH, all flowing to a major...
GateNews1h ago