
**Date: **Tue, Jan 06, 2026 | 06:20 AM GMT
The broader cryptocurrency market continues to show fresh strength as 2026 unfolds. Bitcoin (BTC) and Ethereum (ETH) are both up more than 7% on the week, helping improve overall market sentiment. This renewed momentum is gradually spreading across major altcoins — including Pi Network (PI).
While PI has recorded a modest 5% gain over the past week, the more important development is taking shape on the chart. On lower timeframes, price action is compressing into a well-defined bullish structure, suggesting the token may be preparing for a meaningful breakout if resistance is reclaimed.
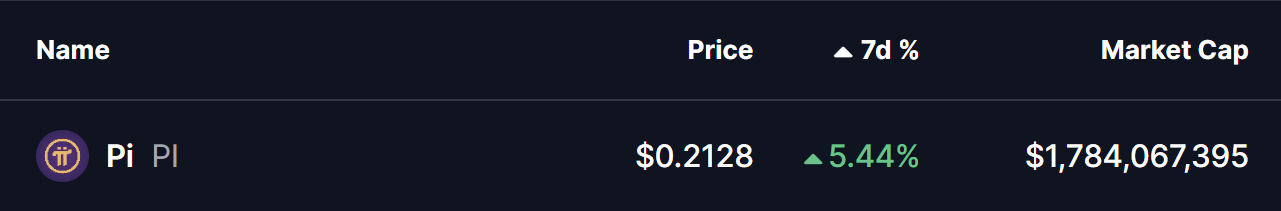
Source: Coinmarketcap
Ascending Triangle Taking Shape
On the 4-hour chart, Pi Network is forming a clear ascending triangle pattern. This structure is defined by a series of higher lows pressing steadily into a flat resistance zone, signaling persistent buying interest despite repeated rejections at the same level. Ascending triangles are widely considered bullish continuation patterns, particularly when they develop after an extended consolidation phase.
PI recently bounced cleanly from its rising support trendline, once again pushing price toward the upper boundary of the triangle around the $0.2129–$0.2160 region. The ability to repeatedly defend higher lows suggests that buyers remain in control and are willing to accumulate on dips rather than exit positions.
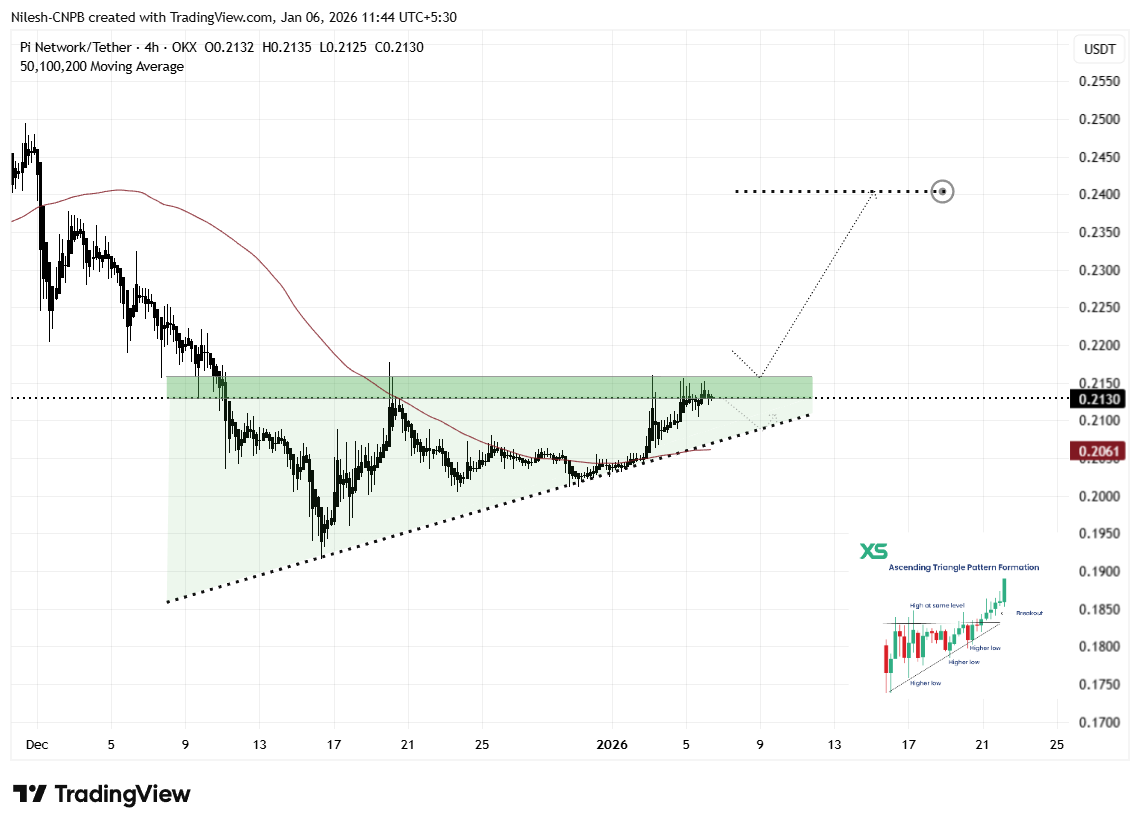
_ Pi Network (PI) 4H Chart/Coinsprobe (Source: Tradingview)_
Rather than signaling weakness, this sideways-to-higher price action reflects healthy consolidation. Volatility continues to compress, which often precedes a larger directional move as the market approaches a decision point.
What’s Next for PI?
From here, PI appears set for another test of the $0.2160 resistance zone. A decisive breakout above this level, followed by sustained acceptance and a successful retest as support, would confirm the ascending triangle structure and likely trigger a stronger bullish expansion.
Based on the measured move of the pattern, the technical upside projection points toward the $0.2404 area. This represents a potential upside of roughly 13% from current levels and also aligns with previous price structure, reinforcing the bullish case.
That said, caution remains important. If PI fails to break above resistance, price could rotate back toward the rising support trendline once again. As long as this ascending support holds, the broader bullish structure remains intact. A clear breakdown below the trendline, however, would invalidate the pattern and delay any breakout scenario.
For now, the combination of improving market sentiment and a tightening ascending triangle suggests Pi Network is approaching a critical inflection point — one that could define its next major move as the new year progresses.
Disclaimer: The views and analysis presented in this article are for informational purposes only and reflect the author’s perspective, not financial advice. Technical patterns and indicators discussed are subject to market volatility and may or may not yield the anticipated results. Investors are advised to exercise caution, conduct independent research, and make decisions aligned with their individual risk tolerance.
About Author: Nilesh Hembade is the Founder and Lead Author of Coinsprobe, with over 5 years of experience in the cryptocurrency and blockchain industry. Since launching Coinsprobe in 2023, he has been providing daily, research-driven insights through in-depth market analysis, on-chain data, and technical research.
Disclaimer: The information on this page may come from third parties and does not represent the views or opinions of Gate. The content displayed on this page is for reference only and does not constitute any financial, investment, or legal advice. Gate does not guarantee the accuracy or completeness of the information and shall not be liable for any losses arising from the use of this information. Virtual asset investments carry high risks and are subject to significant price volatility. You may lose all of your invested principal. Please fully understand the relevant risks and make prudent decisions based on your own financial situation and risk tolerance. For details, please refer to
Disclaimer.
Related Articles
Bitcoin Breaks Below $71,000, Ethereum Falls Below $2,200! Nearly $300 Million in Liquidations Across the Network in 4 Hours, Inflation, Conflict, and Political Deadlock "Triple Kill" Crypto Market
The crypto market experienced a sharp decline on the evening of the 18th, with Bitcoin falling below $71,000 and Ethereum dropping to $2,200. The causes include U.S. PPI data exceeding expectations, which reduced the likelihood of Federal Reserve rate cuts; escalating Middle East conflicts increasing geopolitical risks; and gridlock in the U.S. Congress over crypto regulations. Market sentiment was severely damaged, with 110,000 people liquidated in just 4 hours, resulting in losses of $300 million.
動區BlockTempo1h ago
Here’s Where Gold Price Could Go After the FOMC Decision
Gold is in a bearish trend, forming a waterfall pattern with lower highs and lows. Watch the 4905 level; a break could lead to a drop toward 4841. Upcoming FOMC announcements may cause volatility, impacting price movements.
CaptainAltcoin1h ago
A Certain CEX Survey: 74% of Institutions Expect Cryptocurrency Market to Rebound in the Next 12 Months, Allocation Willingness Continues to Strengthen
Despite the crypto market's pullback since last year, the latest survey shows that institutional investor confidence remains solid, with 73% planning to increase digital asset allocation by 2026, and 74% expecting market recovery over the next 12 months. Most institutions prefer to invest through regulated instruments while focusing on regulatory clarity and risk management.
GateNews2h ago
Shiba Inu (SHIB) Shows Warning Signs as Price Hints at Another Dip
Shiba Inu price has returned to a delicate zone after several failed attempts to push higher. Recent price action shows SHIB struggling to break above a descending resistance line. That pattern has started raising concerns about another short-term decline.
Market observers began paying
CaptainAltcoin2h ago
