
Date: Thu, Jan 01, 2026 | 06:00 AM GMT
As the new year 2026 begins, the broader cryptocurrency market is showing modest weakness, with both Bitcoin (BTC) and Ethereum (ETH) trading slightly in the red. Despite this soft start among major assets, select altcoins are managing to outperform — including Story (IP), the native token of Story Protocol, a dedicated Layer 1 blockchain focused on decentralized intellectual property infrastructure.
IP is in spotlight with a nearly 6% daily gain, trimming its heavy 60-day decline to around 61%. While the longer-term trend still reflects recovery mode, the more important development is unfolding on the daily chart, where price action is beginning to signal a meaningful structural shift. If this setup plays out as expected, it could mark the early stages of a bullish continuation despite broader market pressure.
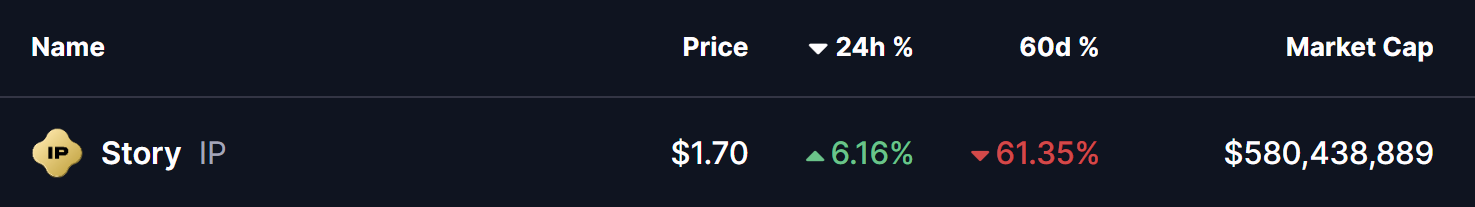
Source: Coinmarketcap
Rounding Bottom in Play
On the daily timeframe, IP appears to be forming a textbook rounding bottom pattern — a classic bullish reversal structure that typically emerges after an extended period of downside pressure. This pattern highlights a gradual transition from distribution to accumulation, where selling momentum fades and buyers begin to step in with increasing confidence.
Earlier in the trend, IP faced strong rejection near the $3.06 neckline zone, triggering a sharp and sustained decline through the final months of 2025. That sell-off eventually found a floor near the $1.42 level, which has since acted as a critical demand zone. Multiple defenses of this area prevented further downside and helped establish a solid base for a potential trend reversal.
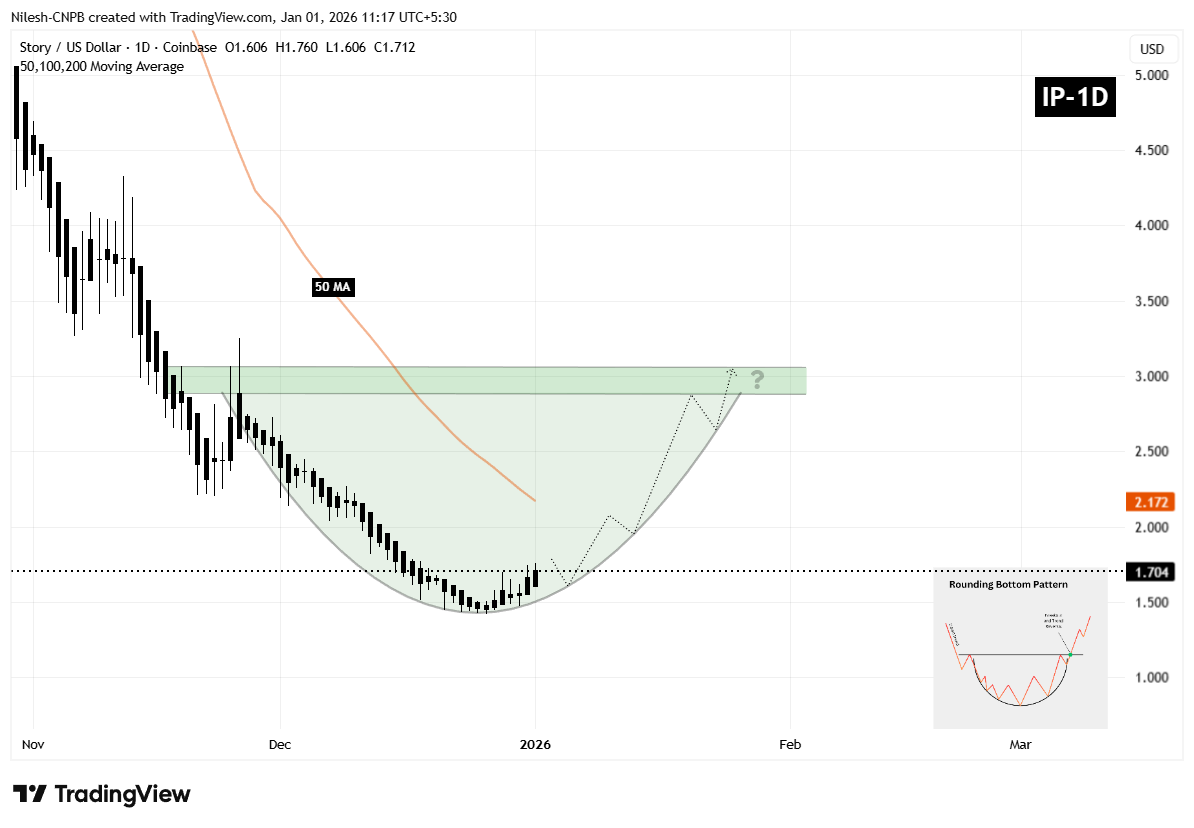
Story (IP) Daily Chart/Coinsprobe (Source: Tradingview)
Since setting that bottom, IP has begun curving higher in a smooth, rounded fashion. This type of price action suggests that selling pressure is no longer aggressive, and that accumulation is quietly taking place. The recent recovery back above the $1.70 region reinforces this view, signaling that the market may be positioning ahead of a larger directional move.
What’s Next for IP?
For the rounding bottom structure to gain confirmation, IP needs to reclaim the 50-day moving average, currently positioned near the $2.172 level. A sustained move above this zone would mark a notable shift in momentum and confirm that buyers are regaining control after months of corrective price action.
Beyond that, the most significant technical barrier remains the neckline resistance around $3.06. A clean and decisive breakout above this area would validate the entire reversal pattern and could open the door for a broader bullish expansion phase, with momentum traders and sidelined participants likely re-entering the market.
Until those levels are reclaimed, the pattern remains in development. Short-term consolidation or minor pullbacks remain possible if IP struggles near the 50-day moving average. However, as long as price continues to form higher lows and holds above the $1.42 base, the broader bottoming structure remains intact.
Overall, IP is approaching a technically important inflection point. The emerging rounding bottom formation, improving price structure, and proximity to key resistance levels suggest the coming sessions could prove decisive for Story’s next major directional move as 2026 gets underway.
Disclaimer: The views and analysis presented in this article are for informational purposes only and reflect the author’s perspective, not financial advice. Technical patterns and indicators discussed are subject to market volatility and may or may not yield the anticipated results. Investors are advised to exercise caution, conduct independent research, and make decisions aligned with their individual risk tolerance.
About Author: Nilesh Hembade is the Founder and Lead Author of Coinsprobe, with over 5 years of experience in the cryptocurrency and blockchain industry. Since launching Coinsprobe in 2023, he has been providing daily, research-driven insights through in-depth market analysis, on-chain data, and technical research.

Disclaimer: The information on this page may come from third parties and does not represent the views or opinions of Gate. The content displayed on this page is for reference only and does not constitute any financial, investment, or legal advice. Gate does not guarantee the accuracy or completeness of the information and shall not be liable for any losses arising from the use of this information. Virtual asset investments carry high risks and are subject to significant price volatility. You may lose all of your invested principal. Please fully understand the relevant risks and make prudent decisions based on your own financial situation and risk tolerance. For details, please refer to
Disclaimer.
Related Articles
The situation in the US-Iran war worsens, oil prices rise by 4%, and the surge in US Treasury yields impacts US stocks, causing them to fall.
Due to the worsening Middle East situation and soaring U.S. Treasury yields, concerns about inflation have intensified, causing the U.S. stock market to retreat and turning the sentiment cautious. Energy stocks rose against the trend, and crude oil prices broke through $100 per barrel, further fueling market panic. U.S. import prices experienced their largest increase since 2022, and postal services raised fuel surcharges, drawing attention to the consumer confidence index. The Federal Reserve chair succession process has stalled amid political disputes, and the cryptocurrency market remains flat as investors stay on the sidelines.
ChainNewsAbmedia1h ago
Crypto edges off of worst levels after Trump extends Iran strike pause
Bitcoin recovered after President Trump's announcement of a 10-day pause on attacks against Iran's energy infrastructure, helping stabilize markets following recent declines. Despite a volatile day, bitcoin is currently trading above $69,000, while other cryptocurrencies also saw some rebound.
CoinDesk2h ago
BTC 15-minute increase of 0.97%: Driven by active buying and ETF fund inflows pushing the market higher
On March 26, 2026, from 20:00 to 20:15 (UTC), the 15-minute spot Bitcoin (BTC) candlestick return was +0.97%, with a price range of 68,428.7 to 69,460.2 USDT and an amplitude of 1.51%. Trading volume during this period increased by 18% compared to the previous period, reaching approximately $120 million. Market attention significantly intensified, and short-term volatility increased.
The main driver of this movement was strong active buying in the spot market. Specifically, multiple large transfers of ≥1000 BTC appeared on-chain, with net inflows of BTC on major trading platforms totaling approximately 28.
GateNews3h ago
Solana Reclaims $90 as Golden Cross Signals Renewed Momentum
Solana has surpassed the $90 resistance, aided by a golden cross indicating positive momentum, despite low trading volume. Strong on-chain growth supports price stability, and sustained support above $89.50 could push Solana towards $96, though higher volume is crucial for confirming a breakout.
CryptoNewsLand3h ago
Bittensor TAO Jumps 17% as Market Momentum Strengthens
Key Insights:
Bittensor surged 17% in one day, with strong weekly and monthly gains supported by broader crypto stability and rising investor participation.
Institutional access expanded through new exchange products while Grayscale’s trust premium signaled sustained demand for
CryptoNewsLand3h ago
Zcash Rally Gains Strength as Privacy Demand and ZODL Funding Lift ZEC
Key Insights:
The Zcash price rose above $235 with strong volumes, reflecting sustained institutional participation and signaling broader market confidence in privacy-focused digital assets.
The $25 million ZODL funding supports protocol upgrades, wallet growth, and shielded adoption,
CryptoNewsLand3h ago
