
The shooting star candlestick signals bearish reversal with small body and long upper shadow. Traders confirm the shooting star candlestick pattern and shooting star inverted hammer candlestick through volume, RSI, and bearish follow-through.
What Is Shooting Star Candlestick Pattern?
The shooting star candlestick is a one-day pattern indicating potential bearish reversal in established uptrends. In markets, bulls and bears constantly battle for control—knowing when one might be wresting control from the other provides valuable trading edges. The shooting star indicates bears might be taking control, at least short-term.
Shooting Star Candlestick Characteristics
Appears after strong uptrend: Must follow sustained price increases
Forms at or near recent highs: Typically appears at resistance levels
Long upper shadow: At least twice the body length, showing rejection
Small real body: Little difference between opening and closing prices
Minimal lower shadow: Non-existent or very short, signaling close near session low
Body position: Located at lower end of candlestick range
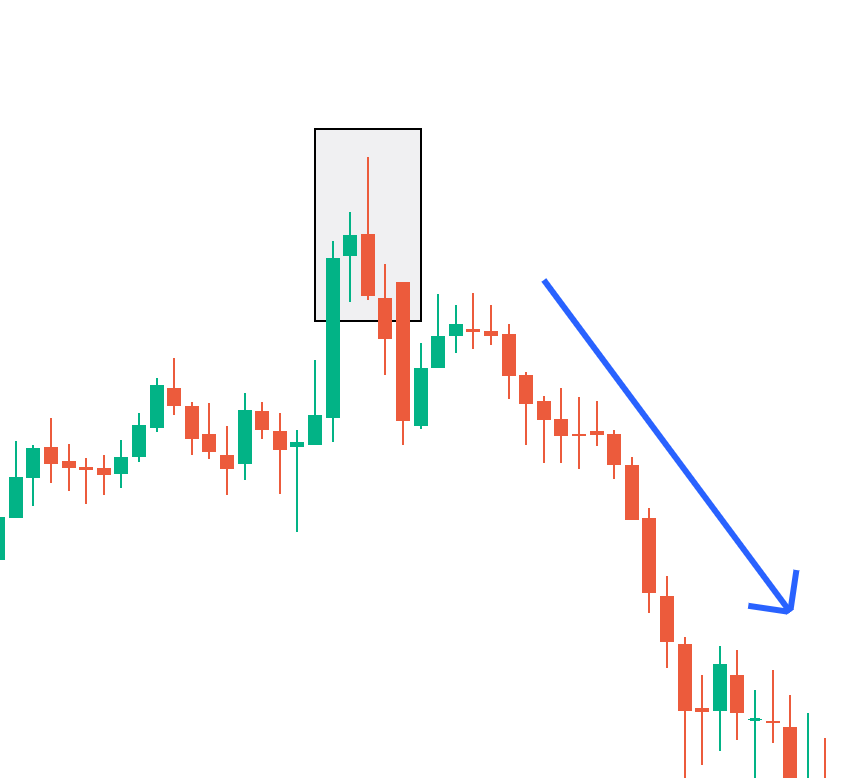
The shooting star candlestick pattern structure reveals crucial market psychology. Buyers initially pushed prices significantly higher during the session, creating the long upper shadow. However, strong resistance from sellers, or exhaustion of buying power, forced prices back down to close near the open. This price action indicates loss of bullish momentum and potential reversal.
The shooting star signal is considered even stronger if there’s no lower shadow at all and the closing price is below the opening price. However, note that existence of a shooting star candlestick doesn’t guarantee reversal. Traders should seek additional confirmation before acting on the pattern.
Confirming The Shooting Star Pattern
Traders can confirm the shooting star candlestick pattern through multiple validation methods. Perhaps the most reliable is a strong bearish follow-through candle, ideally closing below the shooting star’s low. Weak confirmation candles, such as doji patterns, may indicate market hesitation, reducing signal strength.
Key Confirmation Signals
Bearish follow-through candle: Strong down-close on next session validates reversal
Previous resistance levels: Shooting star at major Fibonacci levels strengthens signal
Technical indicator crossovers: RSI downturn from overbought, MACD bearish crossover, or stochastic oscillator reversal
Volume analysis: High volume on shooting star formation day suggests strong selling pressure
High volume on the day the shooting star forms, combined with bearish confirmation candle the next day, suggests strong selling pressure reinforcing likelihood of trend reversal. Conversely, low volume weakens the signal, increasing chances of failed setup. Traders also look for negative divergence, where prices rise but volume weakens.
These signals help traders judge whether the shooting star is part of genuine reversal pattern or just one-off event. Volume analysis gauges underlying buying and selling pressure, providing crucial context for pattern interpretation. The shooting star occurred at previous resistance level, particularly major Fibonacci level, adds technical confirmation supporting reversal thesis.
Shooting Star Inverted Hammer Candlestick: Critical Differences
The shooting star inverted hammer candlestick patterns look alike but serve opposite functions in different market contexts. Both patterns feature small real bodies and long upper shadows with little to no lower shadows. Understanding this distinction prevents costly trading errors.
Shooting Star (Bearish Signal)
· Appears after uptrend
· Signals buyer exhaustion and potential downward reversal
· Buyers push price up but sellers overpower, closing near the low
· Functions as exit signal or short entry opportunity
Inverted Hammer (Bullish Signal)
· Appears after downtrend
· Signals seller exhaustion and potential upward reversal
· Sellers push price down but buyers regain control, closing near the open
· Functions as entry signal for long positions
The inverted hammer shooting star candlestick distinction is purely contextual—the same shape carries opposite implications depending on prior trend direction. A bullish shooting star candlestick pattern technically doesn’t exist, as shooting stars by definition signal bearish reversals. What appears as “bullish shooting star” is actually an inverted hammer in downtrend context.
This confusion represents one of the most common mistakes in candlestick pattern interpretation. Always assess the prevailing trend before labeling patterns—trend context determines whether the formation is shooting star or inverted hammer.
How To Trade Shooting Star Candlestick Pattern
Imagine a crude oil futures trader looking to take short position after rally. Using the shooting star pattern, here’s the trading approach:
Step 1: Recognizing the Shooting Star
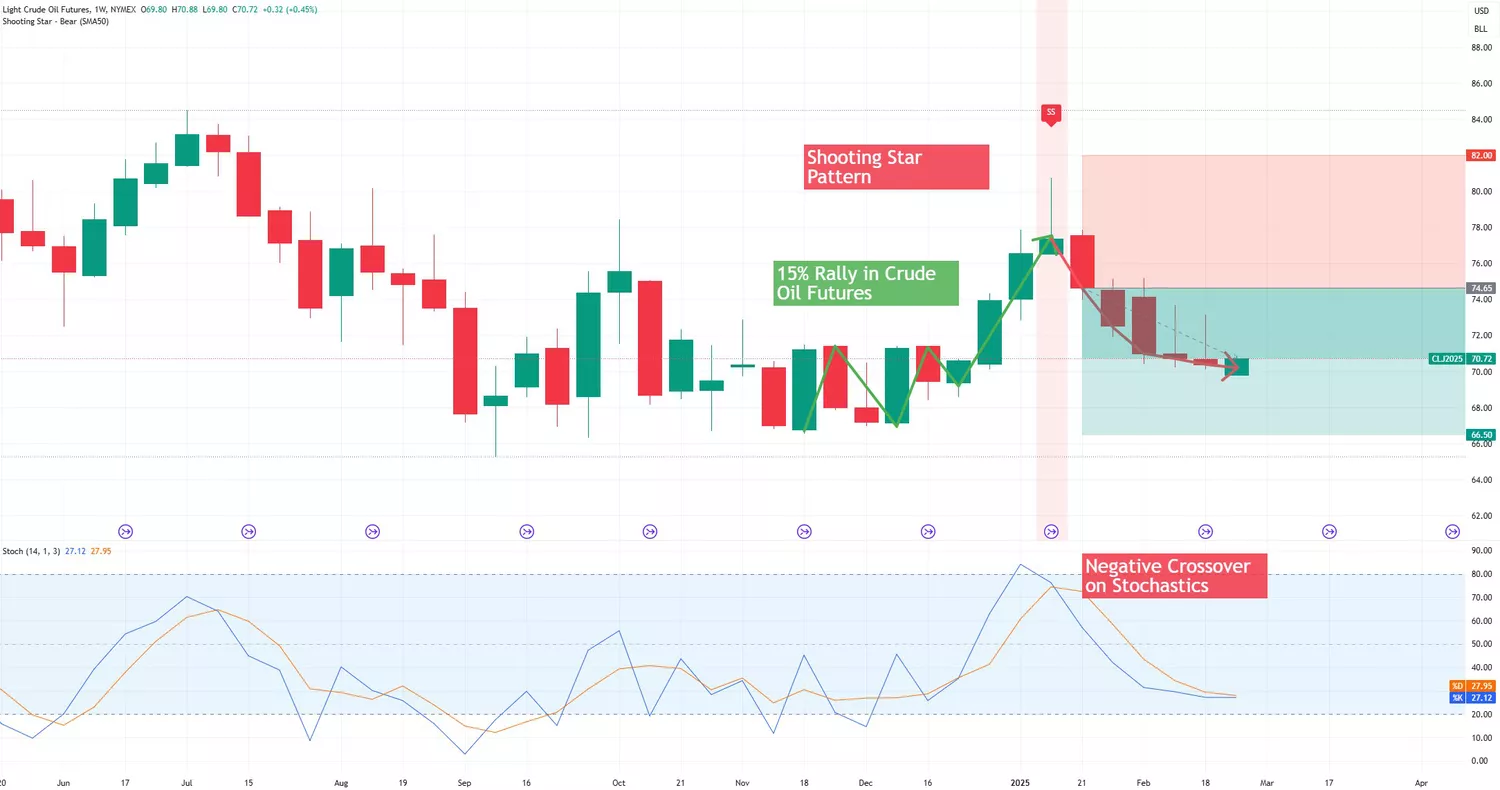
After 15% rally over three months, trader seeks opportunity to enter short position if reversal occurs. A shooting star candlestick appears with upper tail high just above $80, near previous resistance area. This initial recognition triggers alert for potential reversal setup.
Step 2: Validating the Bearish Setup
Once shooting star forms, the bearish pattern needs validation. Formation near level where last reversal occurred provides one confirming signal. Additionally, stochastic oscillator’s %K line has turned down from overbought and bearish crossover appears imminent—clear evidence favoring reversal.
The following week, market closes below the shooting star’s low with bearish candlestick, and stochastic oscillator completes bearish crossover, together offering strong confirmation. Trader may also use volume analysis to confirm the shooting star candlestick pattern validity.
Step 3: Initiating Short Position
Aggressive Entry: Enter short position once market moves below shooting star’s low, given formation near previous resistance and stochastic downturn from overbought. Set relatively tight stop-loss order above shooting star high.
Conservative Entry: Wait for market close below shooting star’s low at week end, with confirmation from bearish candlestick and stochastic crossover. Enter stop-loss order above that week’s bearish candlestick high.
Both approaches set target prices, keeping in mind shooting stars can signal both short- and intermediate-term reversals. Risk-reward ratios should favor at least 2:1 before entering positions.
Step 4: Monitoring and Exit Signals
Monitor position for signs reversal is ending. These could include candlestick patterns like hammer or inverted hammer, bullish engulfing, or morning star. Technical indicators showing bullish divergence in RSI or bullish stochastic crossover also signal potential exits.
With any of those signals, trader may take partial profits and wait for additional confirmation before exiting entirely, or exit position completely at that time.
Common Shooting Star Trading Mistakes
The shooting star candlestick pattern can be misinterpreted and misplayed. Common pitfalls include:
Trading Without Confirmation: Acting on shooting star alone without bearish follow-through is the most common mistake. Always wait for confirmation through next period’s price action or volume analysis.
Ignoring Market Context: In solid uptrends, single-day candlesticks may result from randomness rather than genuine reversals. Assess broader trend strength before acting.
Too Much Weight: Shooting star alone does not automatically signal trend reversal. It’s indicator requiring additional technical and fundamental validation.
Overly Optimistic Targets: Not every confirmed reversal leads to long downtrends. Some produce only short pullbacks. Set realistic profit targets based on nearby support levels.
Low Volume Ignorance: Shooting stars forming on low volume carry significantly less reliability. High volume is crucial for pattern validity—without it, setup failure probability increases dramatically.
False signals are common in strong uptrends and low-volume markets, making it essential to assess broader market conditions beyond single candlestick patterns.
Volume Analysis And Technical Indicator Integration
Integrating volume analysis and technical indicators to confirm the shooting star candlestick pattern is essential for traders. Volume provides crucial context—high volume on shooting star formation day validates the pattern, while low volume suggests weak conviction making reversal less likely.
Technical indicators add additional confirmation layers. RSI downturn from overbought levels (above 70) reinforces shooting star’s bearish signal. MACD bearish crossover where signal line crosses above MACD line confirms momentum shift from bullish to bearish. Stochastic oscillator reversals from overbought territory provide similar confirmation.
Fibonacci retracement levels add spatial context. Shooting stars forming near major Fibonacci resistance levels (61.8%, 78.6%, or 100% retracement) carry higher reliability than those appearing at random price points. These confluence zones where multiple technical factors align produce strongest trading signals.
Proper risk management improves trading strategy regardless of pattern strength. Never risk more than 1-2% of trading capital on single position. Use stop-loss orders consistently to protect against adverse movements. Calculate position sizes based on distance between entry and stop-loss to maintain consistent risk per trade.
FAQ
What is shooting star candlestick?
A shooting star candlestick is a bearish reversal pattern appearing after uptrends, characterized by small body near the bottom, long upper shadow (at least 2x body size), and minimal lower shadow. It signals buyer exhaustion and potential downward reversal.
What is shooting star candlestick pattern confirmation?
Confirmation requires bearish follow-through candle closing below the shooting star’s low, high volume on formation day, technical indicator crossovers (RSI, MACD, stochastic), and formation at previous resistance levels for strongest signals.
How is shooting star different from inverted hammer?
Both have identical shapes but opposite meanings. Shooting stars appear after uptrends signaling bearish reversals; inverted hammers appear after downtrends signaling bullish reversals. Context determines interpretation.
Is shooting star candlestick always accurate?
No, shooting stars are indicators, not guarantees. They require confirmation through additional price action analysis. False signals are common in strong uptrends and low-volume markets, making broader market assessment essential.
How do you trade shooting star candlestick pattern?
Wait for confirmation through bearish follow-through candle, enter short position when price breaks below shooting star’s low, place stop-loss above shooting star’s high, set profit targets at 2-3x the pattern’s height.
What volume is needed for valid shooting star?
Higher volume on shooting star formation day strengthens the signal significantly. Low volume weakens reliability, increasing failed setup probability. Volume should be above 20-day average for strong confirmation.
Can shooting star appear in downtrend?
Technically no—shooting stars by definition appear after uptrends. The same shape appearing after downtrends is called an inverted hammer and signals bullish reversal rather than bearish.
