Gold breaks through $4,525, but Bitcoin drops to around $87,000, down 7% since the beginning of the year. On December 24, Bitcoin spot ETF recorded a net outflow of $175 million, with BlackRock IBIT leading the outflows at $91.37 million. Bitcoin fell below the critical support of the 365-day moving average at $102,000, worsening technical indicators and triggering a chain of sell-offs.
Core Reason 1: Institutional Capital Exodus ETF Becomes the Main Selling Force
The primary reason for Bitcoin’s decline today is the large-scale withdrawal by institutional investors. According to SoSoValue data, on December 24, Bitcoin spot ETF experienced a net outflow of $175 million, marking the seventh consecutive trading day of capital outflows. The largest single-day outflow was from BlackRock’s IBIT, with a net outflow of $91.37 million; followed by Grayscale’s GBTC, with a net outflow of $24.62 million. Ethereum spot ETF also saw a net outflow of $57 million on the same day, with Grayscale’s ETHE facing the greatest selling pressure, net outflow of $33.78 million, bringing its total historical net outflow to $5.083 billion.
This ongoing capital outflow reflects institutional investors’ pessimistic outlook on the crypto market. Pratik Kala, portfolio manager at hedge fund Apollo Crypto, stated that this year’s Bitcoin price trend “significantly diverges from the extremely bullish news cycle surrounding the asset.” He attributes this divergence to continued selling by early holders, including the sharp correction in October, which collectively prevented a rebound momentum.
Long-term holders’ selling also constitutes another drag. These investors, who accumulated at lower levels, are taking profits at current prices, and their continued selling provides persistent selling pressure to the market. Konstantin Vasilenko, co-founder of Paybis cryptocurrency exchange, pointed out that due to tax reasons, traders in some regions tend to liquidate cryptocurrencies and exit certain high-risk positions before the New Year, so he does not expect significant volatility before January.
Liquidity shortages during the holiday period further suppress market activity. As traders enter the Christmas holiday, market liquidity declines, risk appetite weakens, and this pattern aligns with typical holiday market behavior: trading volume plummets, market makers reduce holdings, and holding strategies shift toward defense. However, these factors only highlight a deeper issue: the lack of clear buyers willing to enter the market.
Core Reason 2: Gold and Silver Reach New Highs, Stealing Safe-Haven Capital
The second key reason for Bitcoin’s decline today is the massive flow of funds into traditional safe-haven assets. In stark contrast to the weak performance of Bitcoin, gold and silver prices soared to new highs, reshaping cross-market sentiment. February gold futures settlement approached $4,506 per ounce, after briefly hitting a historic high of $4,530; spot prices remain around $4,491. The annual increase exceeds 70%, likely to set the best annual performance since 1979.
Silver prices performed even more strongly, with futures rising over 4%, and spot prices maintaining above $71, reaching unprecedented levels. This divergence clearly demonstrates a shift in market risk appetite: as uncertainty rises, funds tend to flow into time-tested hard assets rather than volatile digital assets.
Three Major Drivers of Capital Flow from Bitcoin to Gold and Silver
Concerns over Currency Depreciation: Global debt levels continue to rise, prompting investors to seek hard assets that preserve value
AI Bubble Concerns: Overvalued stocks driven by artificial intelligence push capital toward defensive allocations
Policy Uncertainty: Ambiguous future US monetary policy makes gold the preferred safe-haven tool
Digital asset research firm BRN’s head of research Timothy Misir said, “‘Hard assets’ as long-term hedging tools are attracting capital, while crypto assets remain on the fringe.” During early 2025, Bitcoin’s trend was highly synchronized with risk assets, but in the year’s rally, it lagged behind other assets. Moreover, its long-touted characteristic as “digital gold” has failed to attract defensive capital flows that drive gold prices higher.
Senior investors believe that the current rally in gold and silver may not have ended. Some analysts suggest that if global debt trends continue to spiral out of control, gold prices could far exceed current levels. However, in this context, one would expect other stores of value like Bitcoin to benefit as well, but the reality is that capital is choosing traditional precious metals over cryptocurrencies.
The third reason for Bitcoin’s decline today is the breach of key technical support levels, triggering technical selling. Bitcoin has fallen below the approximately $102,000 365-day moving average, which previously served as a critical support level during this cycle. Failure to regain this level could increase the risk of further correction.
On the 4-hour chart, Bitcoin continues trading within a descending channel, reflecting controlled profit-taking. The price hovers near the key zone of $87,800, which has repeatedly acted as support and resistance. Although Bitcoin remains below the 50-day moving average ($87,980) and the 100-day moving average ($88,610), the downward momentum has clearly slowed.
K-line structures show spinning tops and doji patterns, indicating market hesitation rather than further decline. The Relative Strength Index (RSI) is stabilizing around 46, above the oversold zone, suggesting weakening bearish momentum. Structurally, this pattern resembles a descending flag, which often indicates a directional breakout.
Over $23 billion in options will expire on December 26, freezing directional bets and intensifying market deadlock. If the price continues to break above $88,600, it is expected to further test $90,500, then $92,650, and possibly retest $94,600. Conversely, if key moving averages cannot hold, the price may retest $86,300, with demand around $83,800 likely to strengthen.
Future Outlook: Consolidation or Continued Decline?
Currently, Bitcoin missed the “Christmas rally,” stagnating amid rising US stock markets and higher gold prices. This sends a signal: this asset built on excitement seems to have lost its appeal at year-end. As long as Bitcoin stays above the lower boundary, the overall trend is more likely to continue rather than break down. If gold and silver continue to attract safe-haven capital, and investors shift toward scarce assets, Bitcoin could become the next target. Kala pointed out that most selling pressure has now eased, and Bitcoin has entered a consolidation phase, which he believes could lay the groundwork for stronger performance next year.
This page may contain third-party content, which is provided for information purposes only (not representations/warranties) and should not be considered as an endorsement of its views by Gate, nor as financial or professional advice. See Disclaimer for details.
Why did Bitcoin drop today? ETF experienced a $175 million outflow in a single day, and a technical breakdown triggered a chain reaction.
Gold breaks through $4,525, but Bitcoin drops to around $87,000, down 7% since the beginning of the year. On December 24, Bitcoin spot ETF recorded a net outflow of $175 million, with BlackRock IBIT leading the outflows at $91.37 million. Bitcoin fell below the critical support of the 365-day moving average at $102,000, worsening technical indicators and triggering a chain of sell-offs.
Core Reason 1: Institutional Capital Exodus ETF Becomes the Main Selling Force
The primary reason for Bitcoin’s decline today is the large-scale withdrawal by institutional investors. According to SoSoValue data, on December 24, Bitcoin spot ETF experienced a net outflow of $175 million, marking the seventh consecutive trading day of capital outflows. The largest single-day outflow was from BlackRock’s IBIT, with a net outflow of $91.37 million; followed by Grayscale’s GBTC, with a net outflow of $24.62 million. Ethereum spot ETF also saw a net outflow of $57 million on the same day, with Grayscale’s ETHE facing the greatest selling pressure, net outflow of $33.78 million, bringing its total historical net outflow to $5.083 billion.
This ongoing capital outflow reflects institutional investors’ pessimistic outlook on the crypto market. Pratik Kala, portfolio manager at hedge fund Apollo Crypto, stated that this year’s Bitcoin price trend “significantly diverges from the extremely bullish news cycle surrounding the asset.” He attributes this divergence to continued selling by early holders, including the sharp correction in October, which collectively prevented a rebound momentum.
Long-term holders’ selling also constitutes another drag. These investors, who accumulated at lower levels, are taking profits at current prices, and their continued selling provides persistent selling pressure to the market. Konstantin Vasilenko, co-founder of Paybis cryptocurrency exchange, pointed out that due to tax reasons, traders in some regions tend to liquidate cryptocurrencies and exit certain high-risk positions before the New Year, so he does not expect significant volatility before January.
Liquidity shortages during the holiday period further suppress market activity. As traders enter the Christmas holiday, market liquidity declines, risk appetite weakens, and this pattern aligns with typical holiday market behavior: trading volume plummets, market makers reduce holdings, and holding strategies shift toward defense. However, these factors only highlight a deeper issue: the lack of clear buyers willing to enter the market.
Core Reason 2: Gold and Silver Reach New Highs, Stealing Safe-Haven Capital
The second key reason for Bitcoin’s decline today is the massive flow of funds into traditional safe-haven assets. In stark contrast to the weak performance of Bitcoin, gold and silver prices soared to new highs, reshaping cross-market sentiment. February gold futures settlement approached $4,506 per ounce, after briefly hitting a historic high of $4,530; spot prices remain around $4,491. The annual increase exceeds 70%, likely to set the best annual performance since 1979.
Silver prices performed even more strongly, with futures rising over 4%, and spot prices maintaining above $71, reaching unprecedented levels. This divergence clearly demonstrates a shift in market risk appetite: as uncertainty rises, funds tend to flow into time-tested hard assets rather than volatile digital assets.
Three Major Drivers of Capital Flow from Bitcoin to Gold and Silver
Concerns over Currency Depreciation: Global debt levels continue to rise, prompting investors to seek hard assets that preserve value
AI Bubble Concerns: Overvalued stocks driven by artificial intelligence push capital toward defensive allocations
Policy Uncertainty: Ambiguous future US monetary policy makes gold the preferred safe-haven tool
Digital asset research firm BRN’s head of research Timothy Misir said, “‘Hard assets’ as long-term hedging tools are attracting capital, while crypto assets remain on the fringe.” During early 2025, Bitcoin’s trend was highly synchronized with risk assets, but in the year’s rally, it lagged behind other assets. Moreover, its long-touted characteristic as “digital gold” has failed to attract defensive capital flows that drive gold prices higher.
Senior investors believe that the current rally in gold and silver may not have ended. Some analysts suggest that if global debt trends continue to spiral out of control, gold prices could far exceed current levels. However, in this context, one would expect other stores of value like Bitcoin to benefit as well, but the reality is that capital is choosing traditional precious metals over cryptocurrencies.
Core Reason 3: Technical Breakdown Triggers Chain Reaction
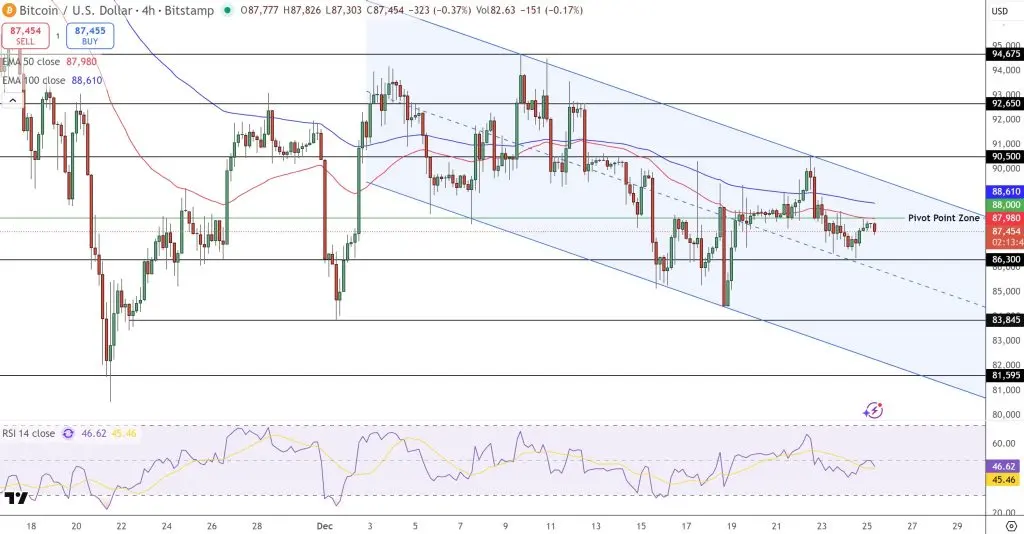
(Source: Trading View)
The third reason for Bitcoin’s decline today is the breach of key technical support levels, triggering technical selling. Bitcoin has fallen below the approximately $102,000 365-day moving average, which previously served as a critical support level during this cycle. Failure to regain this level could increase the risk of further correction.
On the 4-hour chart, Bitcoin continues trading within a descending channel, reflecting controlled profit-taking. The price hovers near the key zone of $87,800, which has repeatedly acted as support and resistance. Although Bitcoin remains below the 50-day moving average ($87,980) and the 100-day moving average ($88,610), the downward momentum has clearly slowed.
K-line structures show spinning tops and doji patterns, indicating market hesitation rather than further decline. The Relative Strength Index (RSI) is stabilizing around 46, above the oversold zone, suggesting weakening bearish momentum. Structurally, this pattern resembles a descending flag, which often indicates a directional breakout.
Over $23 billion in options will expire on December 26, freezing directional bets and intensifying market deadlock. If the price continues to break above $88,600, it is expected to further test $90,500, then $92,650, and possibly retest $94,600. Conversely, if key moving averages cannot hold, the price may retest $86,300, with demand around $83,800 likely to strengthen.
Future Outlook: Consolidation or Continued Decline?
Currently, Bitcoin missed the “Christmas rally,” stagnating amid rising US stock markets and higher gold prices. This sends a signal: this asset built on excitement seems to have lost its appeal at year-end. As long as Bitcoin stays above the lower boundary, the overall trend is more likely to continue rather than break down. If gold and silver continue to attract safe-haven capital, and investors shift toward scarce assets, Bitcoin could become the next target. Kala pointed out that most selling pressure has now eased, and Bitcoin has entered a consolidation phase, which he believes could lay the groundwork for stronger performance next year.