Date: Mon, Dec 22, 2025 | 10:20 AM GMT
The broader altcoin market has remained stuck in choppy and uncertain price action over the past several weeks. The ongoing correction dragged Ethereum (ETH) lower by more than 22% over the last 60 days, reinforcing a short-term bearish tone across the altcoin space — and **Chainlink (LINK) **has not been spared.
LINK is down over 27% during the same period, reflecting persistent selling pressure and weak sentiment. However, beneath the surface, a combination of rising whale accumulation and a developing technical structure on the daily chart suggests that downside momentum may be slowing, potentially setting the stage for a rebound.
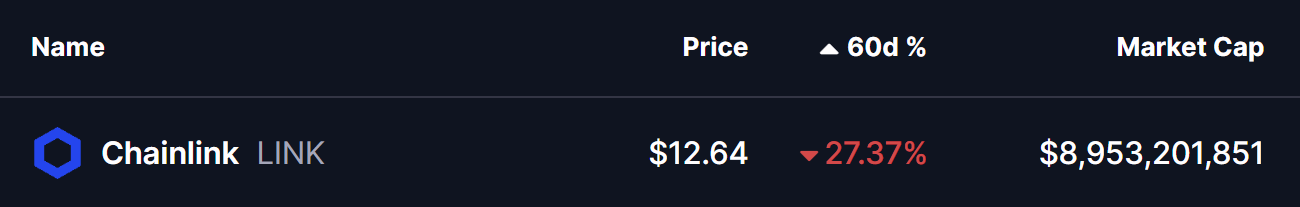
Source: Coinmarketcap
Whale Accumulation Surges Beneath the Sell-Off
Despite LINK’s recent underperformance, large holders appear to be positioning quietly. According to data shared by Lookonchain, over the past three days, 11 newly created wallets have withdrawn approximately 1.567 million LINK — worth nearly $19.8 million — from Binance.
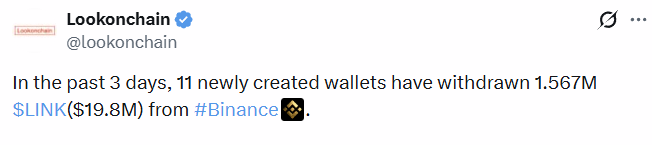
LINK Token Whale Accumulation/Source: @lookonchain (X)
This type of exchange outflow is typically associated with accumulation rather than distribution, as tokens moved off exchanges are less likely to be sold in the near term. While whale activity alone does not guarantee an upside move, it often appears during market phases where smart money begins building longer-term positions amid broader fear and uncertainty.
Harmonic Pattern Hints at Potential Upside
From a technical perspective, LINK’s daily chart is beginning to outline a Bearish Bat harmonic pattern. While the name may sound negative, this structure often produces a strong bullish move during the CD leg before reaching its final completion zone.
The pattern began near Point X around $19.04, followed by a sharp decline to Point A, which marked the initial capitulation move. LINK then rebounded toward Point B, before undergoing a deeper corrective pullback into Point C near $11.73, where buyers stepped in decisively.
Since forming this higher-quality low, LINK has stabilized and rebounded toward the $12.66 region, signaling the early development of the CD leg. This phase is typically where momentum starts to accelerate if the pattern remains valid.
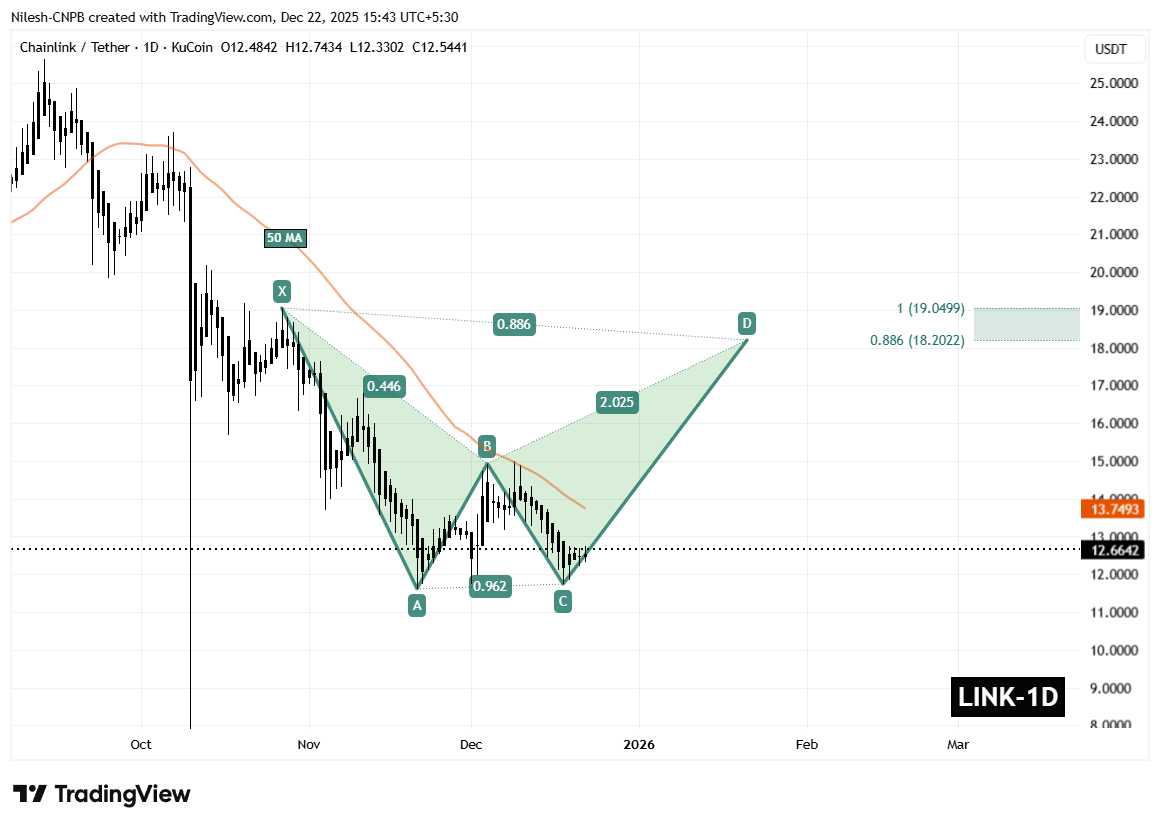
Chainlink (LINK) Daily Chart/Coinsprobe (Source: Tradingview)
Price is now trading just below the 50-day moving average, currently positioned near $13.74. This level is acting as short-term dynamic resistance, and the chart shows price compressing beneath it. A daily close above the 50 MA would be an important technical confirmation, signaling that buyers are regaining control and that the harmonic expansion is gaining traction.
What’s Next for LINK?
If bulls manage to reclaim and hold above the 50-day MA, the harmonic structure projects a potential upside move toward the Potential Reversal Zone (PRZ) between $18.20 and $19.04. This area aligns closely with the 0.886 and 1.0 Fibonacci extensions, which often act as completion zones for Bearish Bat patterns. Reaching this zone would represent a meaningful recovery from current levels and a clear shift in short-term momentum.
That said, the bullish setup remains conditional. A failure to hold the C-level support near $11.73 would invalidate the harmonic structure and could reopen the door to further consolidation or renewed downside pressure before any sustainable recovery takes place.
For now, LINK sits at an important technical crossroads. With whale accumulation increasing and price stabilizing above a well-defined support base, the coming sessions may prove critical in determining whether this setup evolves into a broader upside move or remains a temporary relief rally.
Disclaimer: The views and analysis presented in this article are for informational purposes only and reflect the author’s perspective, not financial advice. Technical patterns and indicators discussed are subject to market volatility and may or may not yield the anticipated results. Investors are advised to exercise caution, conduct independent research, and make decisions aligned with their individual risk tolerance.
Disclaimer: The information on this page may come from third parties and does not represent the views or opinions of Gate. The content displayed on this page is for reference only and does not constitute any financial, investment, or legal advice. Gate does not guarantee the accuracy or completeness of the information and shall not be liable for any losses arising from the use of this information. Virtual asset investments carry high risks and are subject to significant price volatility. You may lose all of your invested principal. Please fully understand the relevant risks and make prudent decisions based on your own financial situation and risk tolerance. For details, please refer to
Disclaimer.
Related Articles
Ripple CTO: Current XRP Price May Deviate from Market Expectations, but Will Be Corrected in the Long Term
Ripple Chief Technology Officer David Schwartz stated that despite XRP's role in the payments space and rising institutional adoption, its current price of approximately $1.50 may be undervalued, noting that market participants will exploit pricing discrepancies to correct the price.
GateNews17m ago
Bitcoin Breaks Below $71,000, Peter Brandt Warns of Two-Way Movement Risk
On March 19th, Bitcoin's price fell below $71,000, declining approximately 5% within 24 hours. Ethereum, Solana, and Dogecoin all dropped 5% to 6%, with total market capitalization evaporating over $100 billion. Senior traders point out that Bitcoin exhibits both bullish and bearish technical patterns, and macroeconomic factors are affecting market sentiment, with short-term trends remaining uncertain.
GateNews35m ago
Cardano (ADA) trades within a multi-year accumulation zone, with analysts monitoring its potential upside.
Cardano (ADA) is currently trading in the support zone of $0.18 to $0.25, which has historically bounced multiple times. Analysts point out that if this support holds and breaks through the downtrend line, ADA could rally to $1 and $3, representing gains of 270% and 1,011% respectively. Maintaining support is key to a bullish outlook.
GateNews36m ago
Bitcoin Briefly Falls Below $70,000 Mark During Asian Session as Fed Hawkishness and Macro Uncertainty Weigh on Market Volatility
Bitcoin fell below 70,000 on March 19, touching approximately 69,537, reflecting market concerns about the Federal Reserve maintaining high interest rates. Bitcoin subsequently rebounded to around 70,180, demonstrating psychological support at the 70,000 level. Despite improved market fund inflows, cryptocurrencies continue to face challenges amid global macroeconomic pressures, with 70,000 becoming a critical near-term level.
区块客44m ago
MICA Daily | Is the Fed Worried About Inflation Getting Out of Control? US Stocks Decline, BTC Tests $71,000 Again
Yesterday, BTC fell from $73,000 to $71,000 due to declining US stocks and deteriorating Middle East conditions, with risk-off sentiment heating up in the market. The Federal Reserve kept interest rates unchanged, with Powell emphasizing that the US employment market and energy crisis make decision-making difficult, indicating uncertain economic prospects ahead that could impact both stock and crypto markets.
区块客49m ago
The Federal Reserve maintains interest rates, Bitcoin is pressured near $70,000, and the Iran conflict escalation increases market uncertainty.
The Federal Reserve kept its benchmark interest rate unchanged on March 19, with a voting result of 11 to 1. Chairman Powell pointed out that the situation in the Middle East and rising oil prices introduce uncertainties to the economy, and short-term inflation expectations have been raised to 2.7%. The market response was notable, with risk assets performing poorly. Analysts advise paying attention to future interest rate movements.
GateNews56m ago
