Date: Sun, Dec 21 2025 | 05:34 AM GMT
The broader cryptocurrency market has experienced choppy and directionless price action over the past several weeks, a phase that began following the sharp sell-off on October 10. That correction pushed **Bitcoin (BTC) **down from sub-$120,000 levels to the current $88,000 area, leaving traders cautious and risk appetite subdued. Over the last 60 days alone, BTC has declined by nearly 18%, reinforcing a short-term bearish narrative across the market.
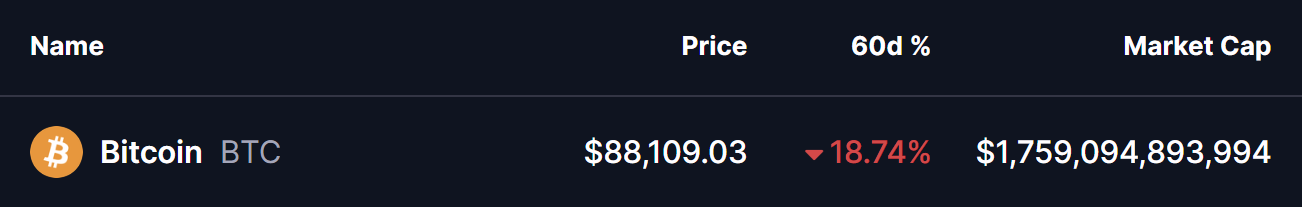
Source: Coinmarketcap
Despite the ongoing weakness, the higher-timeframe technical picture is beginning to suggest something more constructive. Price behavior on the daily chart now resembles a familiar structure from earlier this year, raising the possibility that downside momentum may be fading and that Bitcoin could be approaching a potential trend reversal rather than an extended continuation lower.
Fractal Setup Hints at a Bullish Reversal
On the 3 day timeframe chart shared by crypto analyst CRG, Bitcoin’s current price action closely mirrors a pattern that played out during March and April 2025. At that time, Bitcoin topped near the $108,000 level before entering a sharp corrective phase that dragged price down into the $74,000–$76,000 range. While the decline appeared aggressive, momentum indicators told a different story beneath the surface.
As price pushed to marginally lower lows, the Relative Strength Index (RSI) failed to confirm the weakness. Instead, it formed a clear higher low, signaling a bullish divergence. This divergence marked a loss of downside momentum and ultimately preceded a strong recovery that carried Bitcoin back above $108,000, followed by a continuation toward fresh highs.
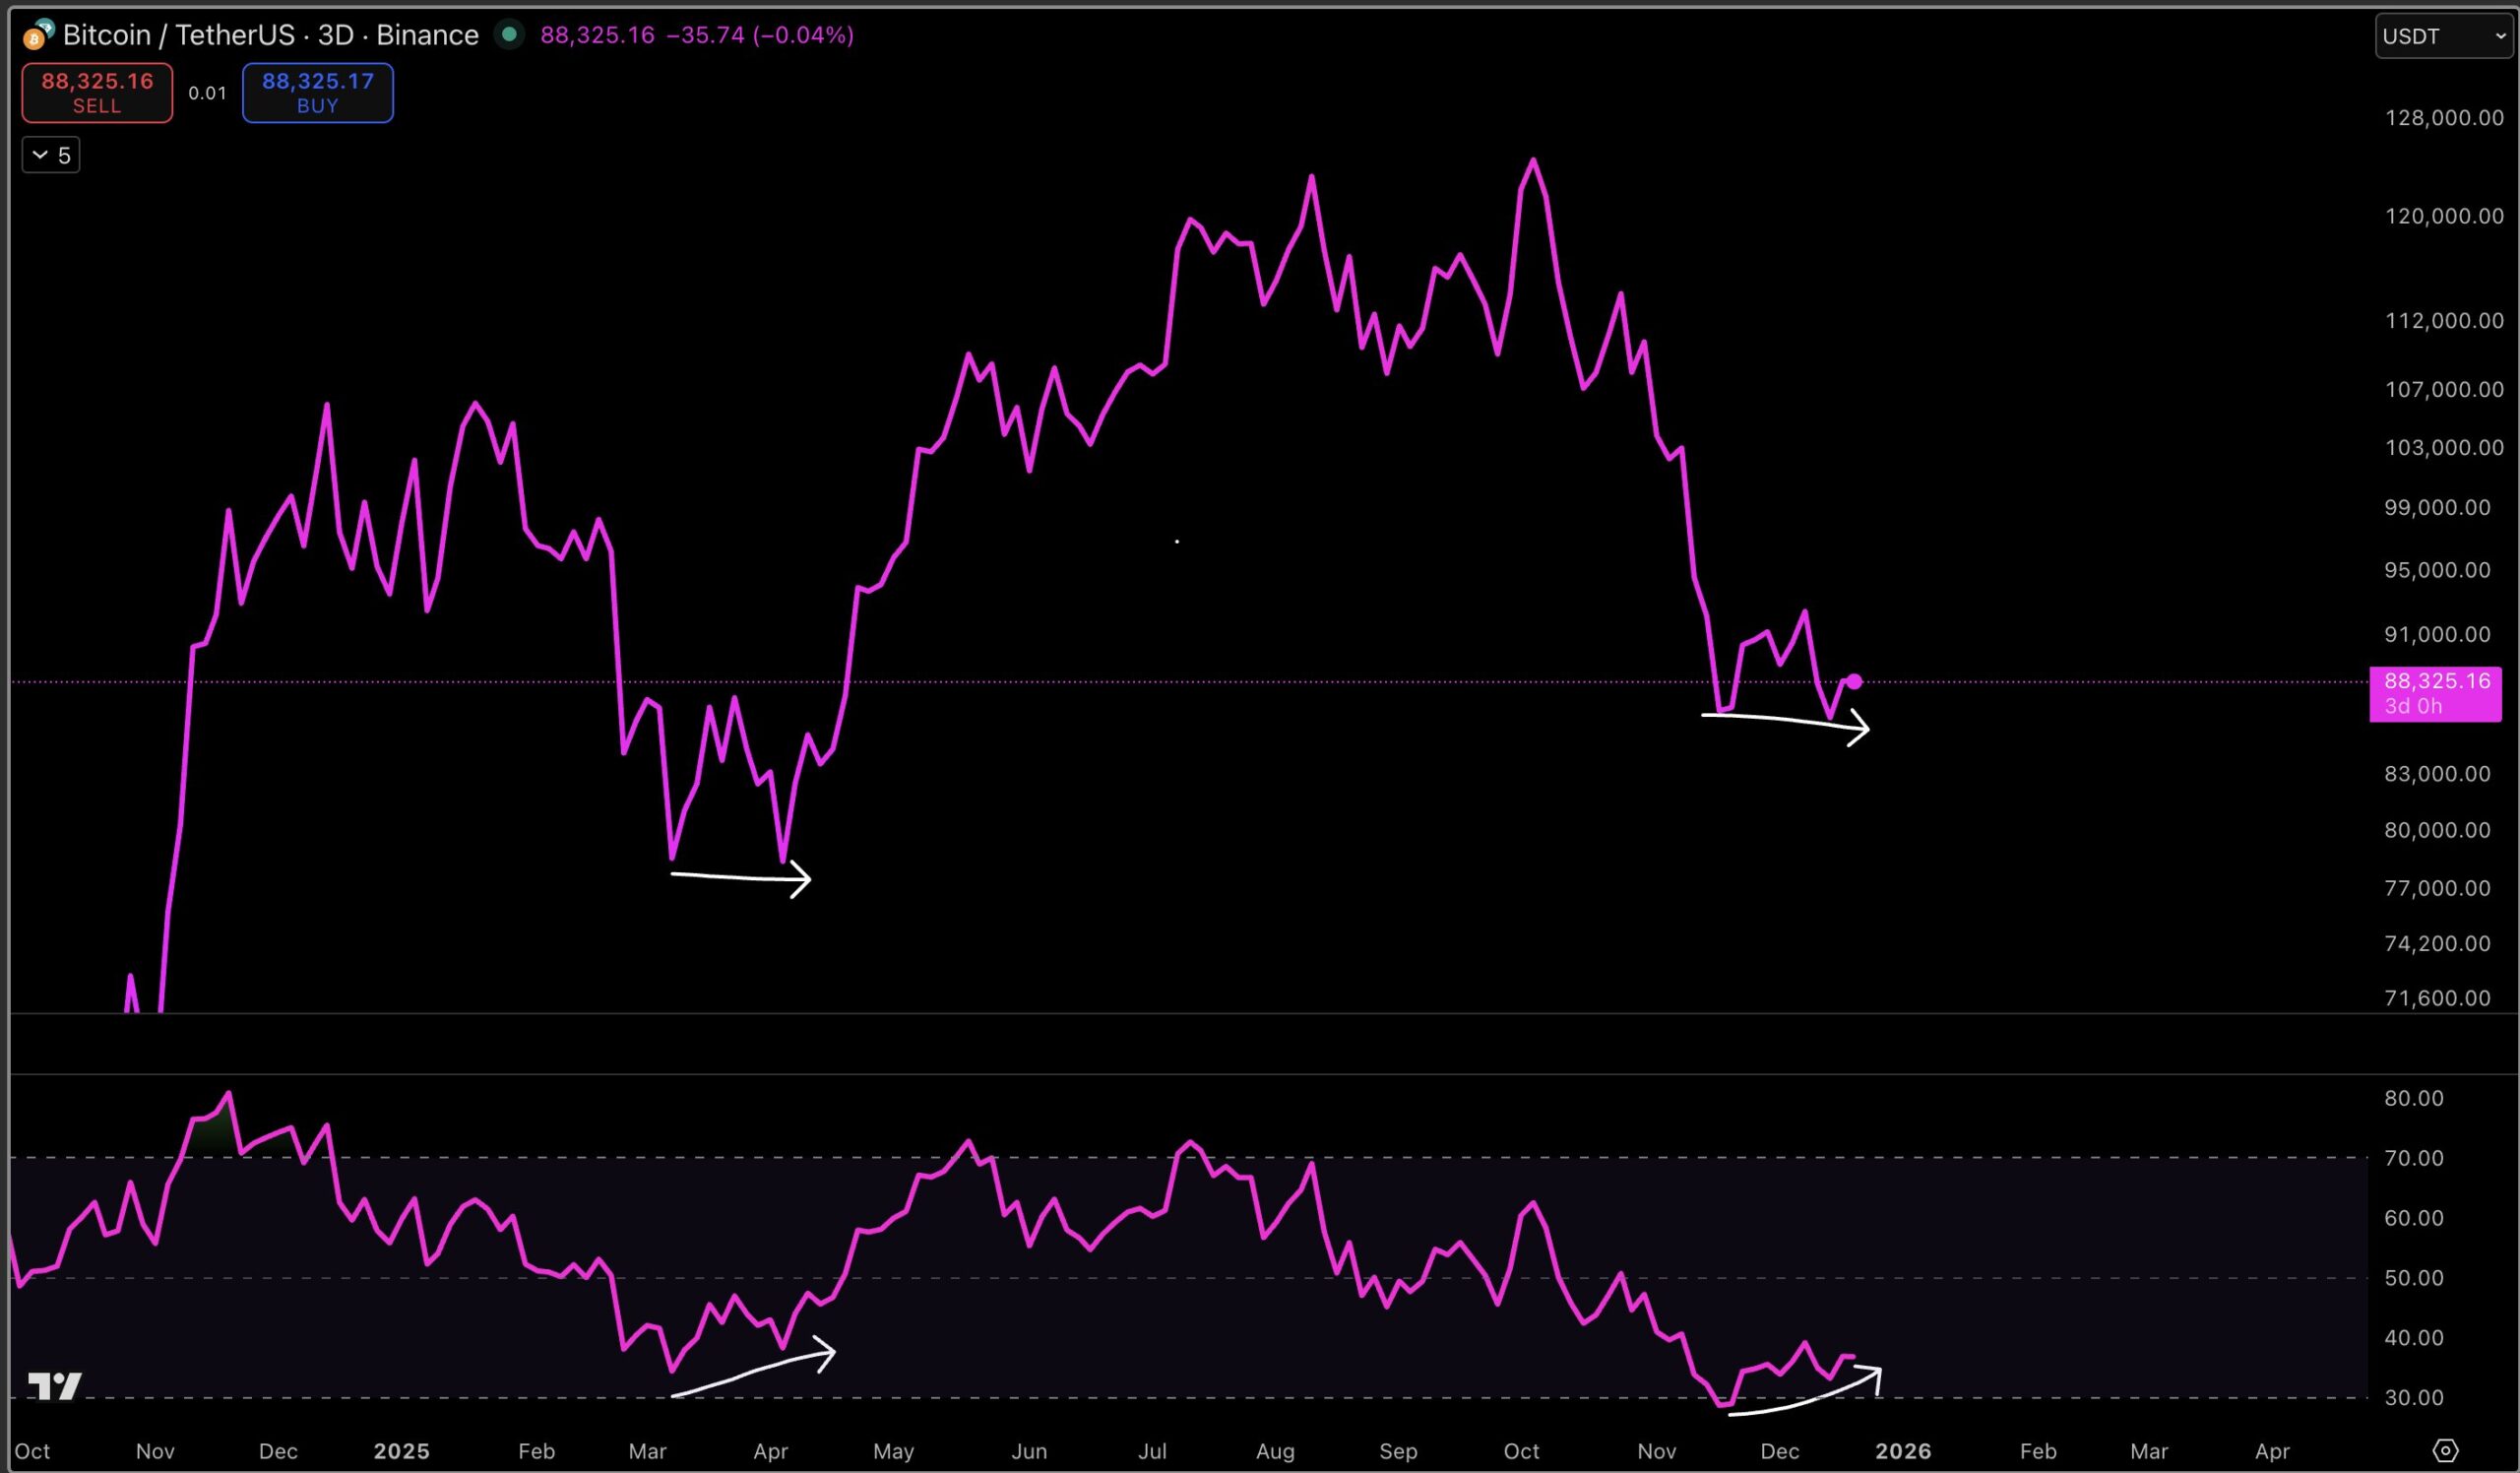
Bitcoin (BTC) Chart/Credits: @MacroCRG (X)
Fast forward to the present structure, and the similarities are striking.
After peaking in the $120,000–$125,000 zone, Bitcoin once again experienced a sharp sell-off, this time finding support just below $81,000. Since then, price has stabilized and begun consolidating around $88,000, struggling to reclaim higher resistance levels but, importantly, failing to extend meaningfully lower. This lack of downside follow-through mirrors the earlier fractal almost point for point.
Momentum is once again reinforcing the comparison. While price briefly dipped to comparable or slightly lower levels, the RSI did not follow. Instead, it printed a higher low, signaling that bearish pressure is weakening despite continued price compression. This exact momentum behavior was present during the previous corrective phase, just before Bitcoin transitioned into its next impulsive move higher.
What’s Next for BTC?
If the current fractal continues to unfold in a similar manner, the $81,000–$90,000 range may ultimately be viewed not as a breakdown zone, but as a final consolidation area before Bitcoin attempts another move toward six-figure prices. A sustained reclaim of the $95,000–$100,000 region would serve as the first meaningful confirmation that the market is following the prior script.
That said, fractals are not predictive guarantees. They do not offer precise price targets or timelines. Instead, they provide context by highlighting repeating market behavior. When similar structures emerge under similar conditions—especially when confirmed by momentum divergence—the probability of a comparable outcome increases. In the previous instance, that outcome was continuation higher after a period of sideways consolidation.
For now, the message from the chart remains clear. Downside pressure appears to be weakening, momentum is stabilizing, and Bitcoin is behaving in much the same way it did before its last major expansion. While the market may feel quiet and uncertain, history shows that these periods of compression often precede significant directional moves.
Disclaimer: The views and analysis presented in this article are for informational purposes only and reflect the author’s perspective, not financial advice. Technical patterns and indicators discussed are subject to market volatility and may or may not yield the anticipated results. Investors are advised to exercise caution, conduct independent research, and make decisions aligned with their individual risk tolerance.
Disclaimer: The information on this page may come from third parties and does not represent the views or opinions of Gate. The content displayed on this page is for reference only and does not constitute any financial, investment, or legal advice. Gate does not guarantee the accuracy or completeness of the information and shall not be liable for any losses arising from the use of this information. Virtual asset investments carry high risks and are subject to significant price volatility. You may lose all of your invested principal. Please fully understand the relevant risks and make prudent decisions based on your own financial situation and risk tolerance. For details, please refer to
Disclaimer.
Related Articles
Bitcoin Price Forecast Next Week: Is the Fed Holding Back Market Gains?
Bitcoin (BTC) is fluctuating around the $70,000 mark as of Saturday, down nearly 3% from the start of the week, ending a two-week consecutive recovery streak. The momentum
TapChiBitcoin14m ago
Bitcoin mining difficulty drops to 133.79 T, down 7.76%
Gate News reported that on March 21, according to CloverPool data, Bitcoin mining difficulty completed adjustment at block height 941,472 at 05:54 today. Mining difficulty decreased to 133.79 T, with a downward adjustment of 7.76%, marking the second largest decline within 2026. The current network hashrate stands at 933.51 EH/s. Analysis shows that the next Bitcoin mining difficulty adjustment is expected to occur in 14 days, with a potential decline of 0.4%.
GateNews25m ago
Bitcoin Tests a $70K Level as Inflation Fears Surge
Bitcoin is grappling with a shift in momentum after failing to sustain a rally above $76,000, slipping back under $70,000 as crude oil prices rise and inflation concerns roil risk markets. The move underscores how macro forces—oil, policy expectations, and stock weakness—continue to shape the
CryptoBreaking46m ago
Strategy CEO: Morgan Stanley's 2% Bitcoin ETF allocation would bring $160 billion in capital inflows
Morgan Stanley's wealth management assets under management are approximately $8 trillion. The firm recommends a Bitcoin allocation of 0-4%. If allocated at 2%, this would bring $160 billion in capital inflows. Morgan Stanley has also submitted an amended filing for a Bitcoin spot ETF called "Morgan Stanley Bitcoin Trust" and has raised $1 million in seed funding.
GateNews1h ago
While the world watches oil prices, an important cash buffer of the Fed has been depleted
The macro risk of Bitcoin is rooted in the nearly depleted liquidity buffer within the financial system rather than oil price fluctuations. With the Fed's reverse repo mechanism losing effectiveness, Bitcoin's reliance on macro liquidity increases, raising concerns about potential market shocks and their impact.
TapChiBitcoin1h ago
