Date: Fri, Dec 19 2025 | 12:15 PM GMT
The broader cryptocurrency market has been showing relative strength despite concerns around the Japan rate hike, while easing U.S. inflation has helped both Bitcoin (BTC) and Ethereum (ETH) remain in the green. Against this backdrop, Bitcoin Cash (BCH) has quietly moved into the spotlight, posting a notable upside move.
BCH has climbed nearly 9% recently, but the bigger story appears to be unfolding on the chart itself. Price action is now forming a structure that often precedes larger trend reversals, suggesting that the recent rally may be more than just a short-term bounce.
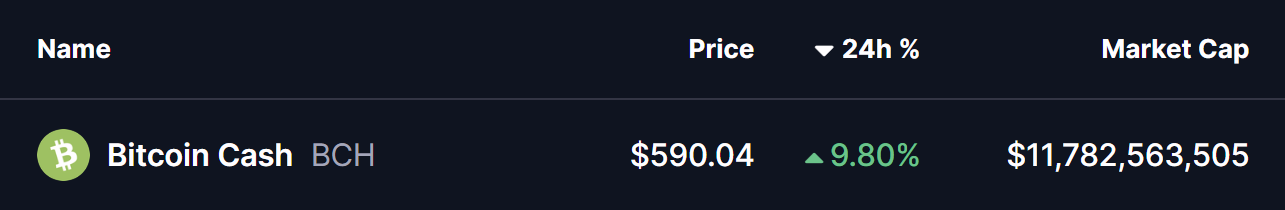
Source: Coinmarketcap
Rounding Bottom in Play?
On the daily timeframe, Bitcoin Cash appears to be carving out a rounding bottom formation — a classic bullish reversal pattern that reflects a gradual shift from distribution to accumulation. This pattern typically develops after a prolonged correction, as selling pressure fades and buyers slowly regain control.
The setup began after BCH faced a firm rejection near the $630 region in September 2025. That rejection triggered a sharp decline, dragging price down toward the $446.9 area. Importantly, sellers failed to push price significantly lower from there, and strong demand emerged at those levels. Over time, BCH stabilized, volatility compressed, and price began to curl higher, completing the rounded base structure.
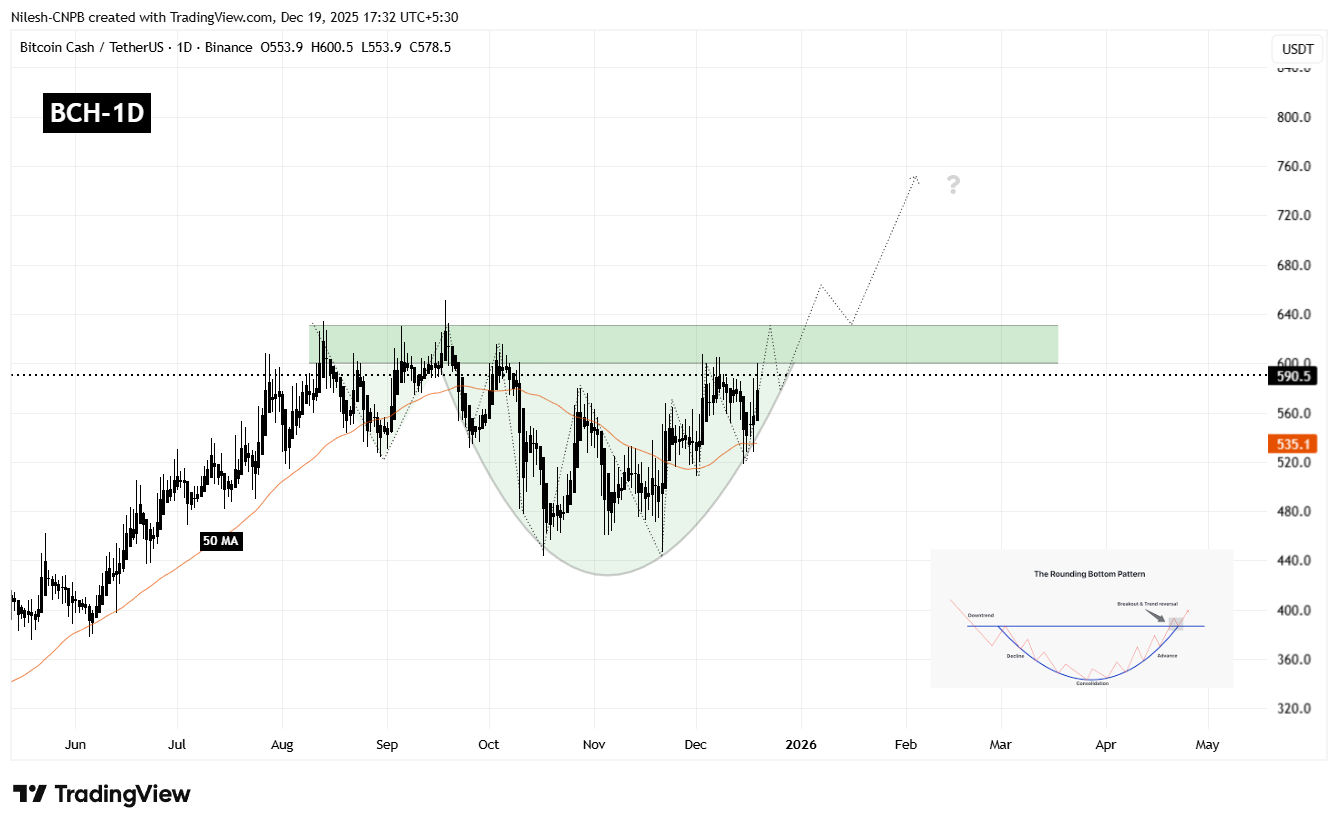
Bitcoin Cash (BCH) Daily Chart/Coinsprobe (Source: Tradingview)
Currently, BCH is trading around the $590 mark and pressing up against a well-defined resistance zone between $600 and $630. This area represents the neckline of the rounding bottom pattern and has capped price advances multiple times in the past, making it the most critical level to watch in the near term.
What’s Next for BCH?
A clean daily close above the $600–$630 resistance zone would confirm the bullish rounding bottom breakout. If that breakout is followed by a successful retest of the same zone as support, it would significantly strengthen the bullish case and suggest that a new upward leg is underway.
Based on the depth of the rounding structure, the projected upside target points toward the $800–$820 region. Reaching that zone would imply a potential upside of roughly 35–40% from current levels, aligning with the measured move typically associated with this pattern.
However, patience remains important. Before any confirmed breakout, BCH could still experience short-term pullbacks, including a dip toward the rising base of the rounding structure or the 50-day moving average, which has been acting as dynamic support during the recovery. Such pullbacks would not necessarily invalidate the bullish setup, as long as price continues to hold above the higher low structure.
Until a decisive breakout and retest occur, traders may want to remain cautious and avoid chasing price. The $600–$630 zone remains the line in the sand that will determine whether BCH transitions into a sustained bullish phase or remains range-bound for longer.
Disclaimer: The views and analysis presented in this article are for informational purposes only and reflect the author’s perspective, not financial advice. Technical patterns and indicators discussed are subject to market volatility and may or may not yield the anticipated results. Investors are advised to exercise caution, conduct independent research, and make decisions aligned with their individual risk tolerance.
Disclaimer: The information on this page may come from third parties and does not represent the views or opinions of Gate. The content displayed on this page is for reference only and does not constitute any financial, investment, or legal advice. Gate does not guarantee the accuracy or completeness of the information and shall not be liable for any losses arising from the use of this information. Virtual asset investments carry high risks and are subject to significant price volatility. You may lose all of your invested principal. Please fully understand the relevant risks and make prudent decisions based on your own financial situation and risk tolerance. For details, please refer to
Disclaimer.
Related Articles
Bitcoin macro risks spike as Ukraine throws a spanner in Trump's plan to stabilize oil markets
Ukraine's drone strikes have exacerbated oil market instability during the Iran war, complicating Trump's efforts to stabilize prices. This disruption risks prolonged high oil prices, leading to inflation and potential Fed rate hikes, which could challenge cryptocurrency stability.
CoinDesk8m ago
Bitcoin Drawdowns Deepen As Recovery Periods Extend Toward 300 Days
_Each 10% Bitcoin drawdown adds ~80 days, with the current recovery timeline estimated at nearly 300 days._
_Q1 2026 Bitcoin options expiry covers ~40% of open interest, with max pain anchored near $75,000._
_MARA sold 15,133 BTC at $65,300, posting a ~$236M loss while saving $88M via
LiveBTCNews10m ago
None
1
SuperCryptoWahaha6666615m ago
Ukraine's raid disrupts the oil market, Trump's plan is thwarted, and Bitcoin faces the risk of falling below $65,000.
Geopolitical conflicts are reshaping global financial markets, with the situations in Iran and Ukraine leading to rising energy prices, affecting the Federal Reserve's interest rate hike expectations and Bitcoin's value. Analysis indicates that rising energy costs will drive inflation, and the market is focused on Bitcoin's support levels.
GateNews19m ago
JPMorgan Says Bitcoin Shows Safe-Haven Demand During Iran War as Gold, Silver Weaken
Bitcoin has demonstrated greater resilience than traditional safe-haven assets during the Iran war, attracting net inflows and showing stronger liquidity conditions while gold and silver have faced sharp outflows and position unwinds, according to JPMorgan analysts led by managing director Nikolaos Panigirtzoglou.
CryptopulseElite24m ago
Bitunix Analyst: War Delay and Liquidity Contraction Resonance, BTC Stuck in 65K–72K Liquidation Zone
Global market performance looks stable on the surface, but internal imbalances remain. Geopolitical risks still exist. Countries are withdrawing liquidity and stabilizing their domestic currencies through different measures; the inflation logic has shifted somewhat, and a strengthening U.S. dollar reflects liquidity being withdrawn. In the crypto market, BTC is consolidating within a range-bound, choppy zone, with price volatility kept in check. In the short term, it’s necessary to watch for changes in the macro environment to find a trend breakout.
BlockBeatNews24m ago
