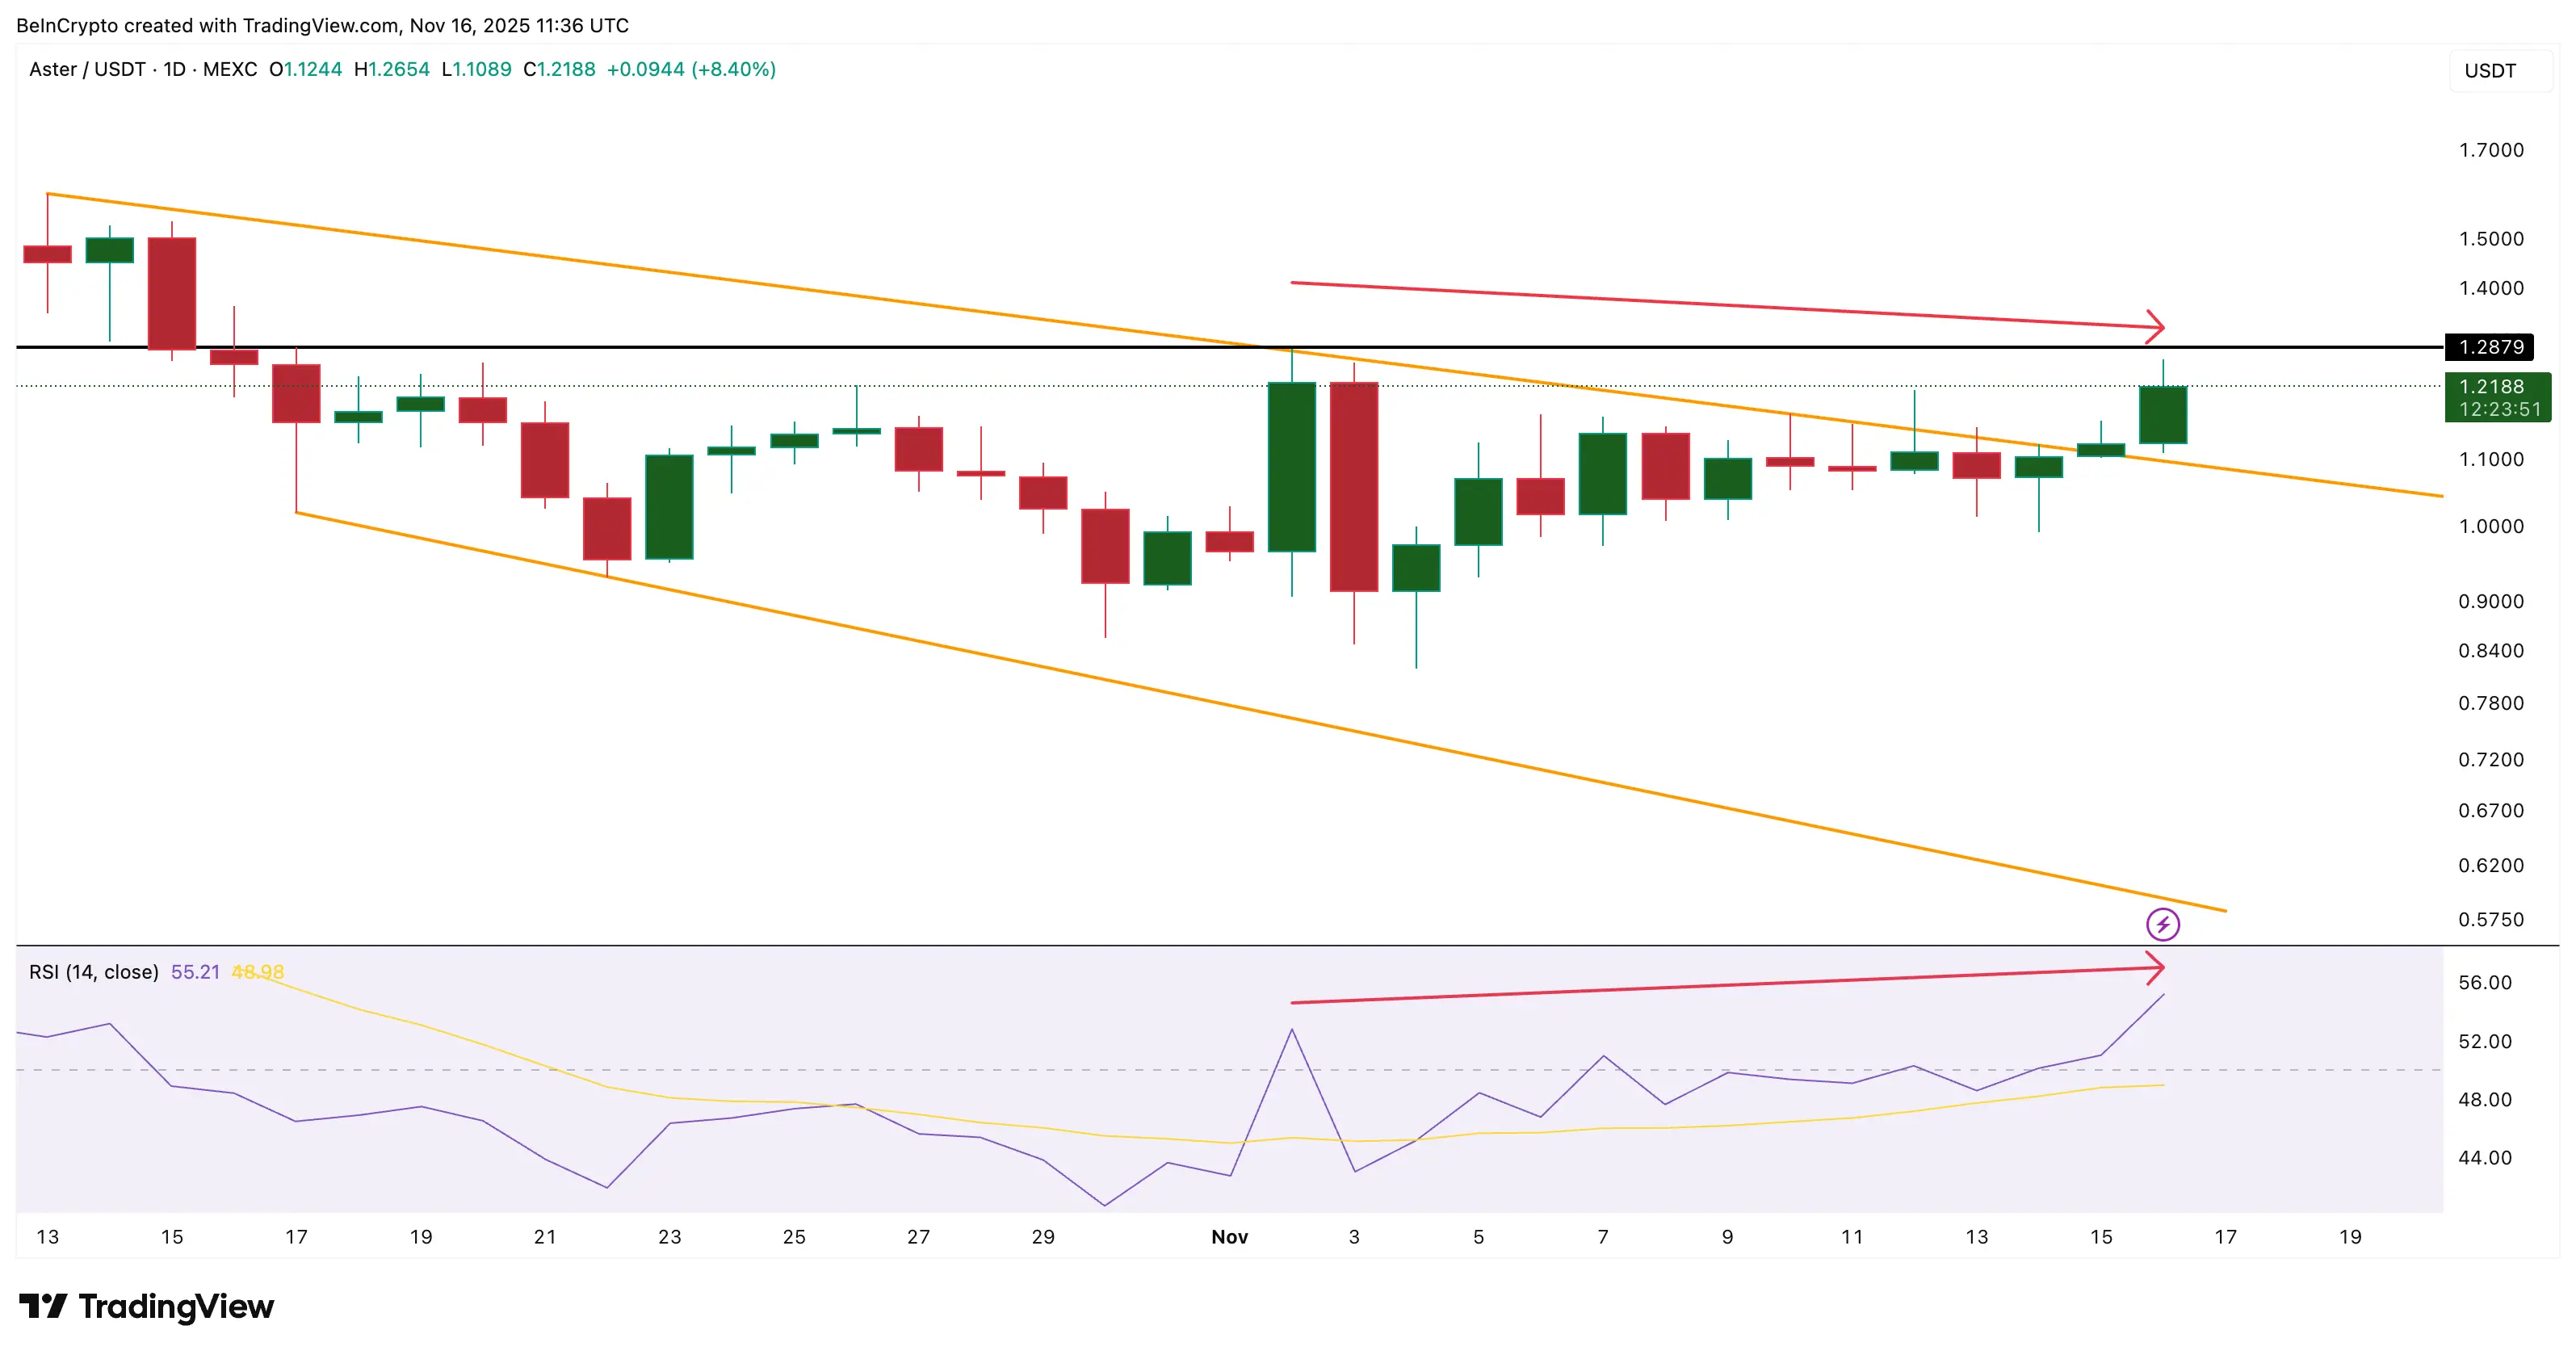
The price of ASTER has increased by more than 8% today and has seen an increase of about 12% over the past week. This Token has just broken down from a falling wedge pattern, a technical signal that often indicates a bullish trend is forming.
However, despite recording an impressive increase, some warning signs have begun to appear. Two momentum divergences along with a large long position on the liquidation map suggest that the current bullish trend may not last. The question now is whether ASTER can maintain its upward momentum or will have to face a short-term correction.
Momentum is bullish, but technical divergences are warning.
The first concern arises from the RSI indicator. RSI is a momentum oscillator that measures the speed and change of price movements and reflects the internal strength of a bullish trend. During the period from November 2 to November 16, the price of ASTER created lower highs while the RSI recorded higher highs, forming a hidden bearish divergence. This indicates that despite increasing buying pressure, the price is not reflecting this proportionately, often serving as an early signal of a correction.
 ASTER shows RSI divergence | Source: TradingViewThe Money Flow Index (MFI), which combines price and volume to track buying pressure as the price falls, is also sending similar signals. From November 11 to November 16, the price made higher lows but the MFI formed lower lows, indicating that buying pressure as the price falls is weakening.
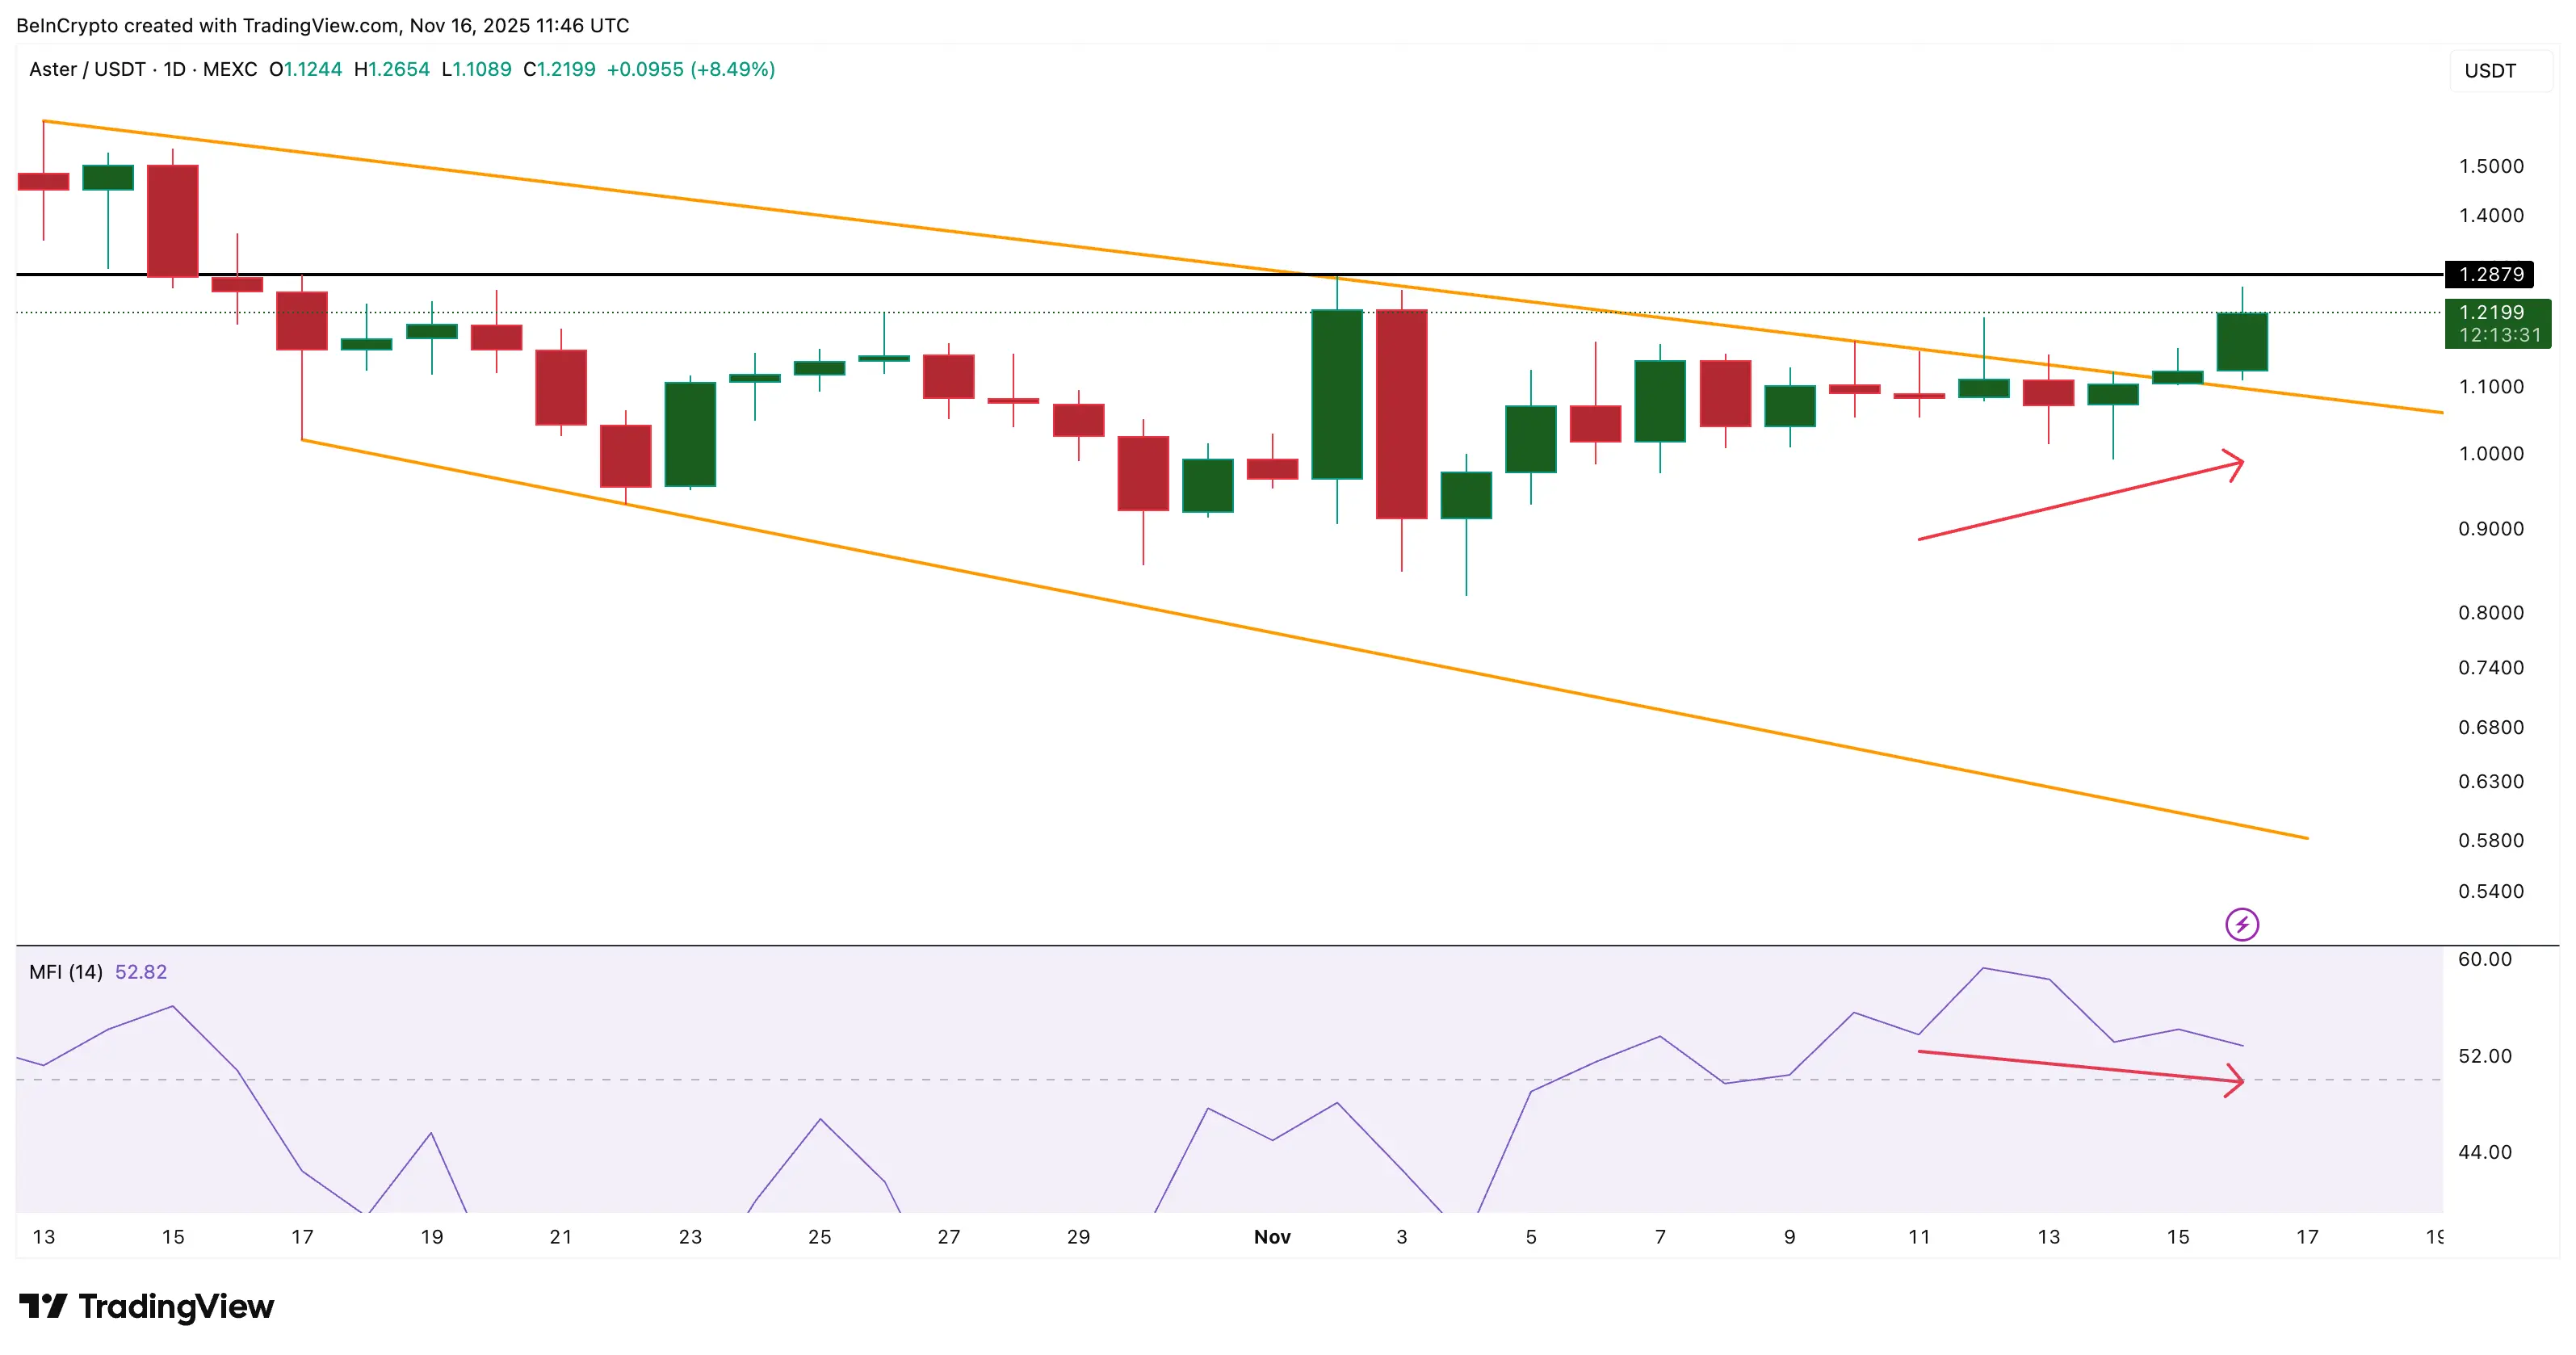 Buying activity as the price falls is slowing down | Source: TradingViewBoth of these divergences send a common message: the buying force is strong enough to help ASTER break the falling wedge pattern, but not strong enough to confirm a sustainable bullish trend. To completely eliminate all divergence signals and assert true strength, ASTER needs to close the daily candle above $1.28.
Large long positions increase the risk of correction
The greater risk comes from leverage factors. According to the liquidation map of ASTER-USDT on Binance, the total value of long positions at risk of liquidation is up to 25.86 million USD, while the short position is only 6.06 million USD.
This means that the long positions are far exceeding the short ones, more than four times. When the bullish trend is built on excessive long positions, a slight decline in the price of ASTER could lead to a risk of mass liquidation for these positions. When the long liquidation orders are triggered, forced selling pressure will cause the price to drop significantly.
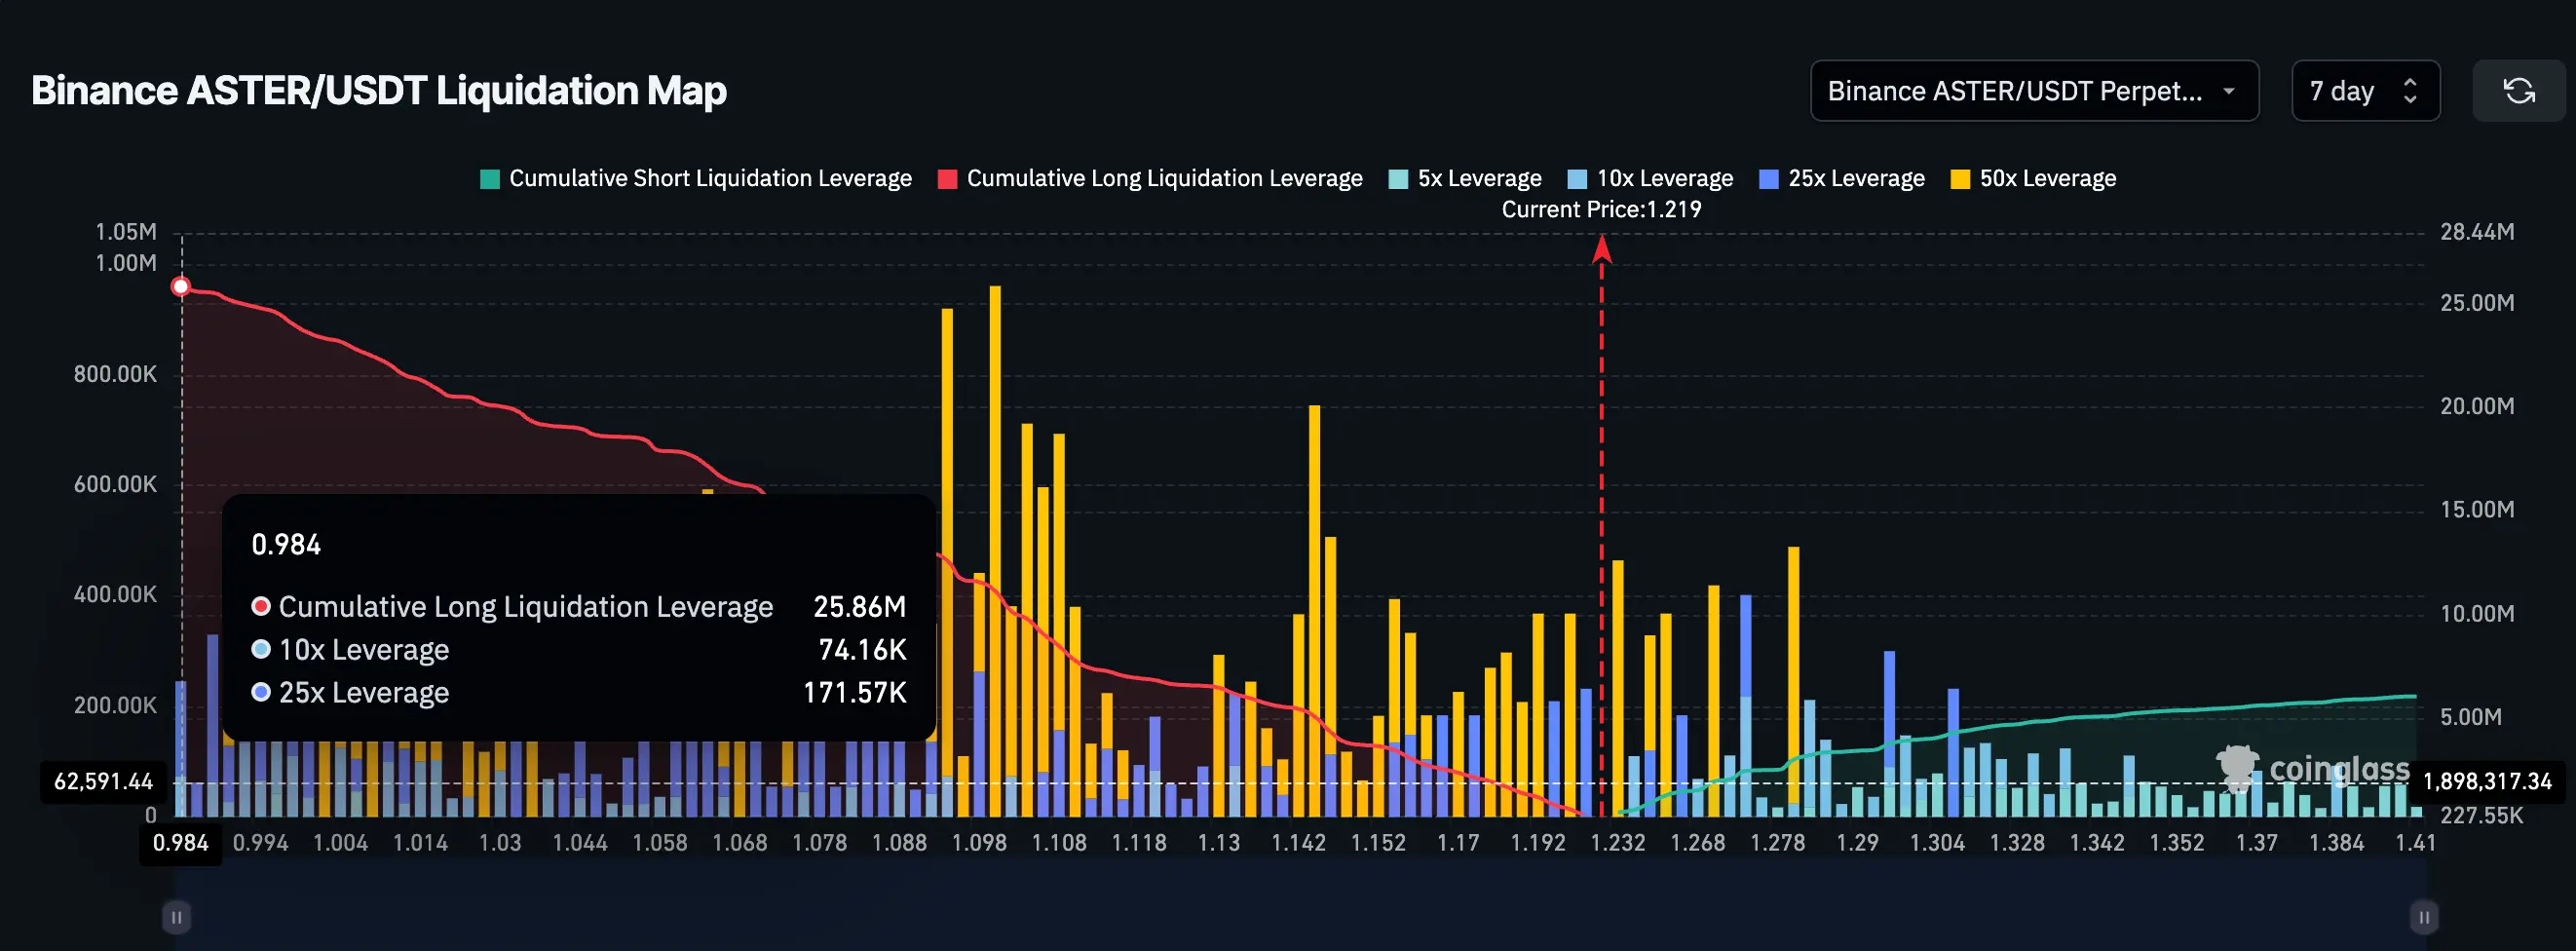 The liquidation map leans towards long | Source: CoinglassThis factor combined with momentum divergence further increases the risk of a deep correction. If momentum weakens and the price starts to fall, ASTER may face a sharp decline due to the long side having too much dominance – this is the hidden risk behind the current bullish move.
ASTER needs to break $1.28 to confirm the bullish trend
The price chart of ASTER also clearly reflects this tension. Although it has broken down the falling wedge pattern, the bullish trend is only truly confirmed when the price surpasses the $1.28 mark. This is an important threshold that marks the transition from an unstable breakdown to a clear trend change.
If the divergence signals take effect and the price begins to adjust, the first support level that ASTER needs to maintain is $1.09. Successfully protecting this threshold will help the price only adjust slightly.
On the contrary, if it loses $1.09, the price could continue to fall to the $0.99 area – where many long positions are concentrated and susceptible to liquidation on the Binance map. As the price enters this area, selling pressure will increase significantly due to the mass liquidation of long positions.
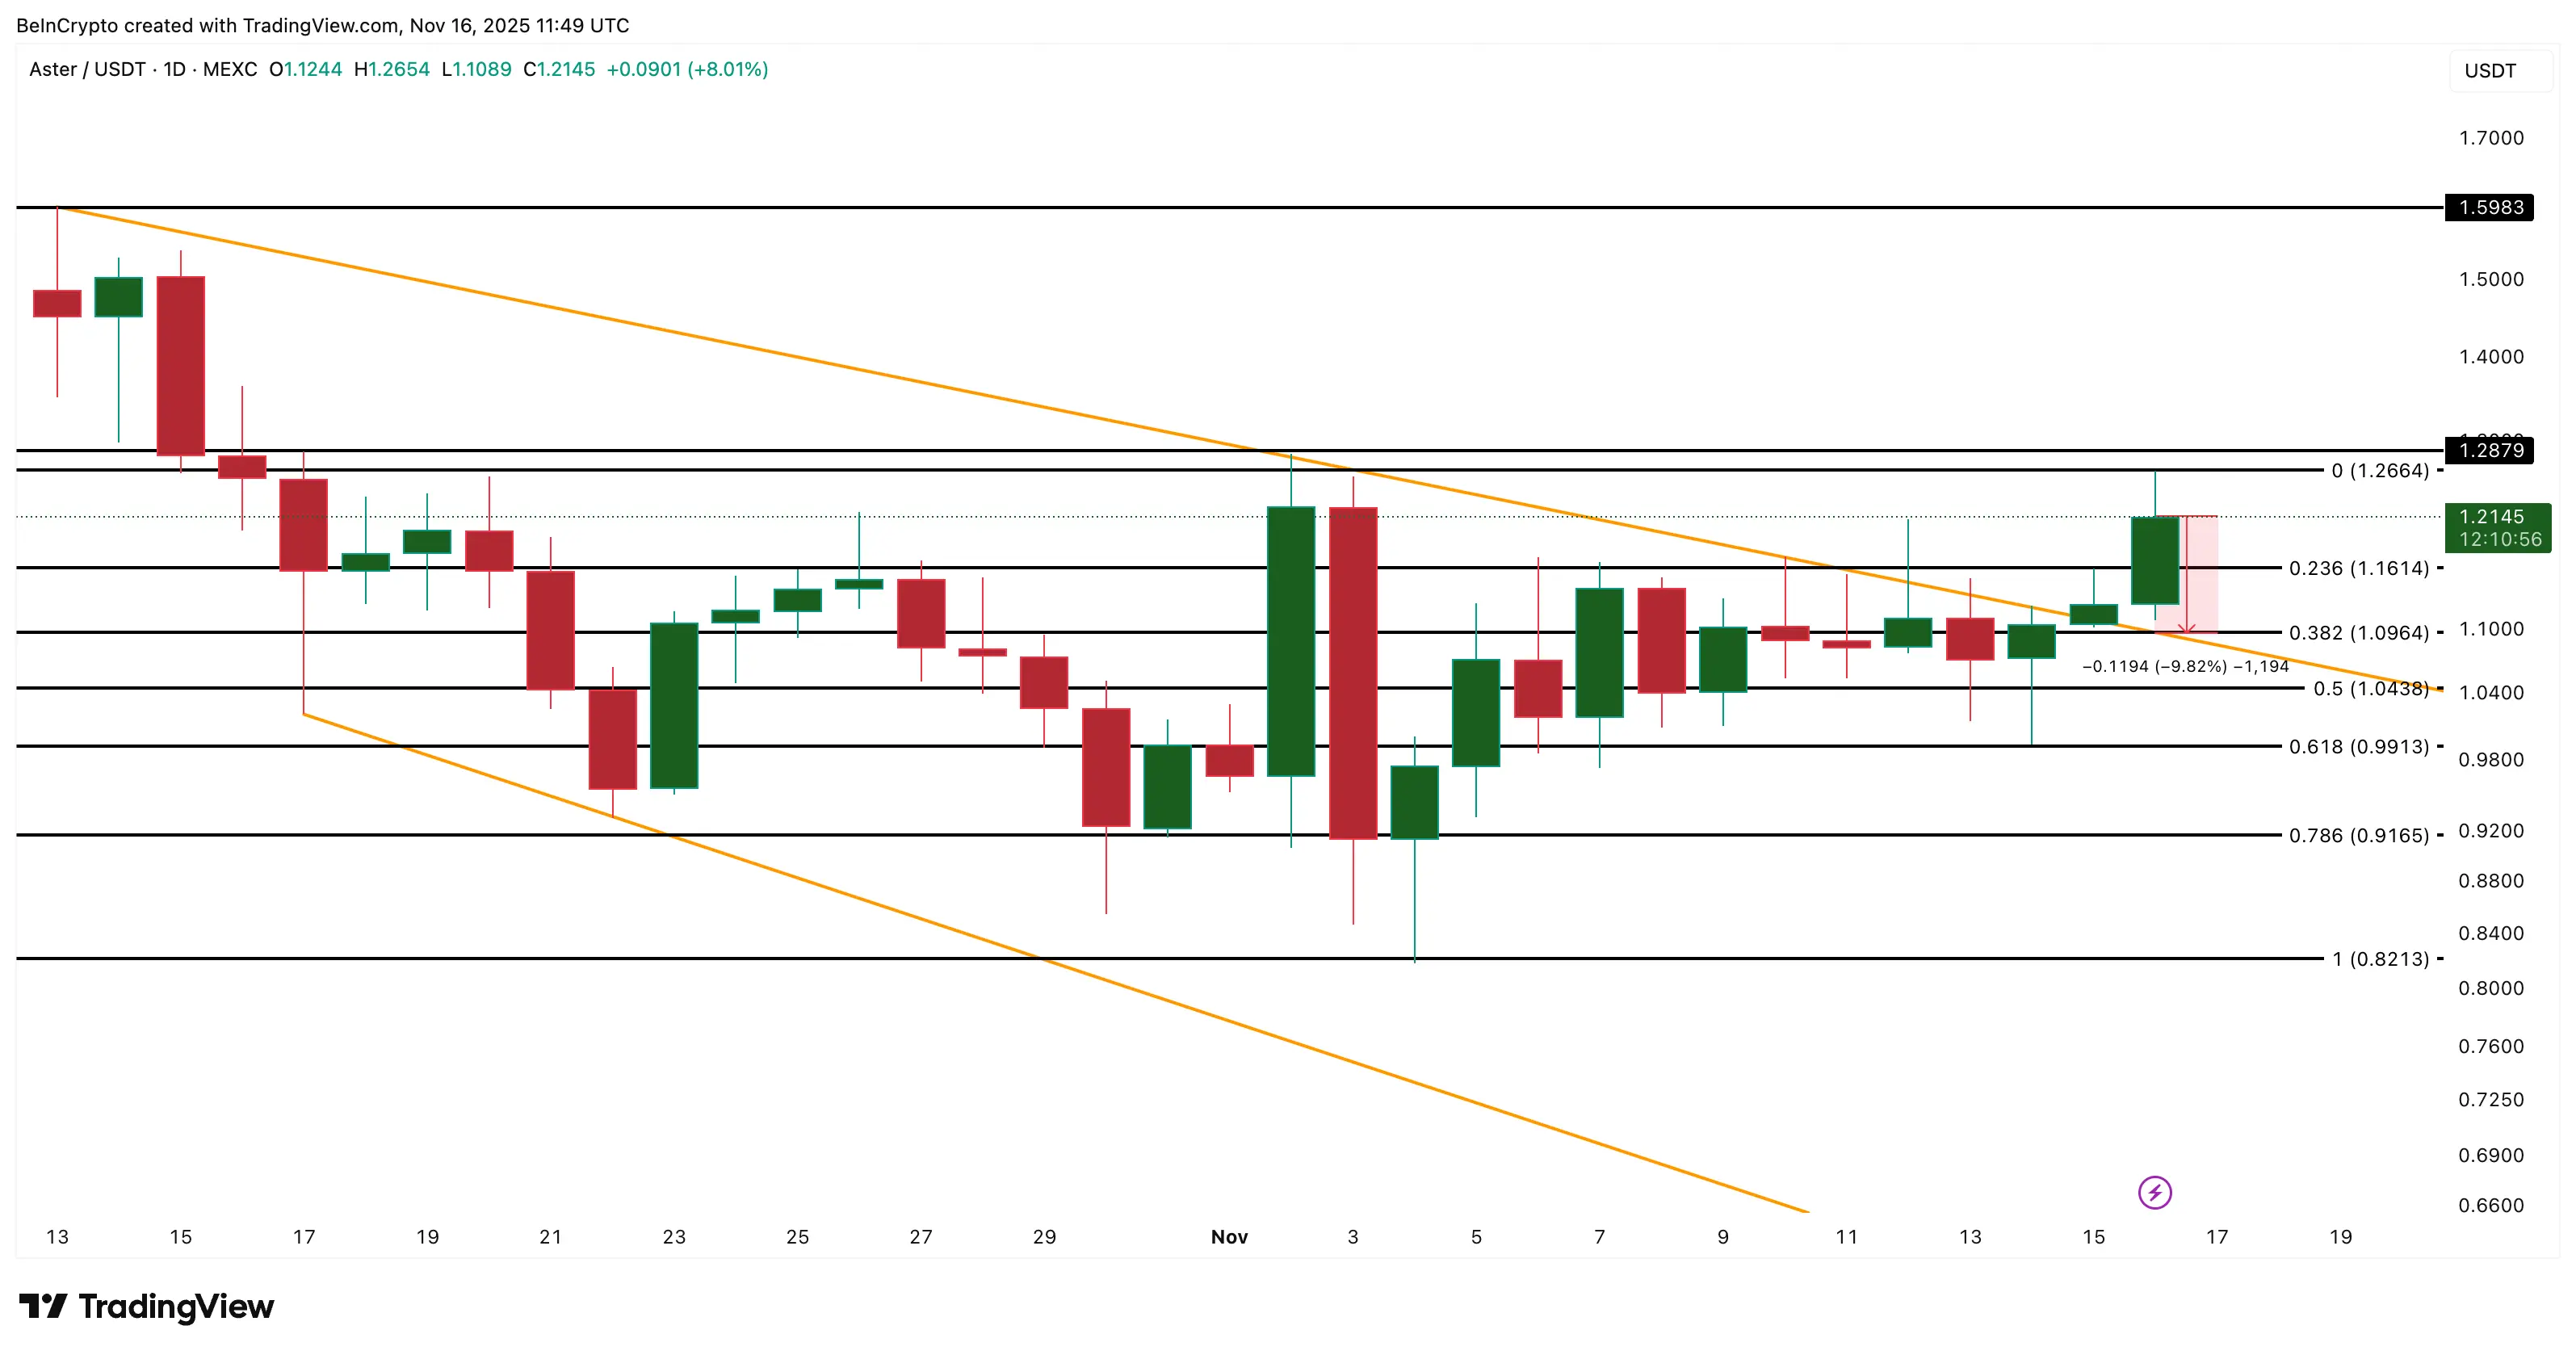 ASTER Price Analysis | Source: TradingViewIn the event that ASTER closes above $1.28, the divergence signals will be invalidated and the price may head towards the $1.59 area, the next important resistance level on the chart.
Mr. Giáo
Disclaimer: The information on this page may come from third parties and does not represent the views or opinions of Gate. The content displayed on this page is for reference only and does not constitute any financial, investment, or legal advice. Gate does not guarantee the accuracy or completeness of the information and shall not be liable for any losses arising from the use of this information. Virtual asset investments carry high risks and are subject to significant price volatility. You may lose all of your invested principal. Please fully understand the relevant risks and make prudent decisions based on your own financial situation and risk tolerance. For details, please refer to
Disclaimer.
Related Articles
XRP Rises 4% as Ripple Partnership and ETF Inflows Drive Recovery
XRP rose 4% to $1.41, boosted by Ripple's partnership with Kyobo Life and increasing institutional interest. Broader market gains and positive community engagement also contributed, though XRP remains 63% below its peak. Key support is at $1.38.
GateNews2h ago
ETH/BTC ratio rebounds—are institutional funds rotating? A deep dive into structural signals in the crypto market
BTC breaks through $75,000; the Iran–Israel ceasefire and fresh highs in U.S. stocks lift risk assets, but the options market remains somewhat cautious. The ETH/BTC ratio rebounds, signaling capital rotation.
GateInstantTrends3h ago
Crypto Market Rebounds 1.5% to $2.54T as Bitcoin Leads Rally Amid Tech Surge and Policy Progress
The crypto market rebounded 1.5% to $2.54 trillion, led by Bitcoin's 7% gain amid easing geopolitical tensions and strong ETF inflows. Analysts predict further gains if Bitcoin surpasses $76K resistance.
GateNews3h ago
Bitcoin bull market index rises to 40 points; Bloomberg: the U.S. and Iran are considering extending the ceasefire agreement by two weeks
Bitcoin’s price as of April 16 is approaching $74,700. The Bullish Sentiment Index (BSI) has risen to 40 points, indicating a rebound in market sentiment. The United States and Iran are evaluating options to extend the current ceasefire agreement, and they are also discussing navigation issues in the Strait of Hormuz, as diplomatic negotiations continue.
MarketWhisper9h ago
Bitcoin holds steady at 74K, and FOMO sentiment is heating up as U.S. stocks hit a record high
Benefiting from positive news about the U.S.-Iran peace agreement, the stock market surged sharply, with the Nasdaq index and the S&P 500 index reaching record highs. Bitcoin remained steady at 74K, market sentiment improved, and the Fear & Greed Index rose to 55. Investor FOMO toward the stock market intensified, and the total market capitalization in the crypto market increased overall, indicating genuine buy-side interest.
ChainNewsAbmedia10h ago
