Bitcoin (BTC) has gone through many ups and downs in October, continuously fluctuating between new highs and notable lows. However, this volatility does not necessarily reflect the beginning of a bear market.
Market data shows that new interest is gradually forming, and even Bitcoin may exceed expectations regarding the “cycle” in the near future.
Roadmap to the milestone of $150,000
The path to $150,000 for Bitcoin is still entirely feasible, based on the correlation between the destroyed coin value index (VCDD) and the spent output profit ratio (SOPR), which fluctuates within defined ranges.
There are four main analysis zones, but the two focal areas are: Gamma + Epsilon—threshold for long-term holders (LTH) and Delta + Epsilon—threshold for short-term holders (STH).
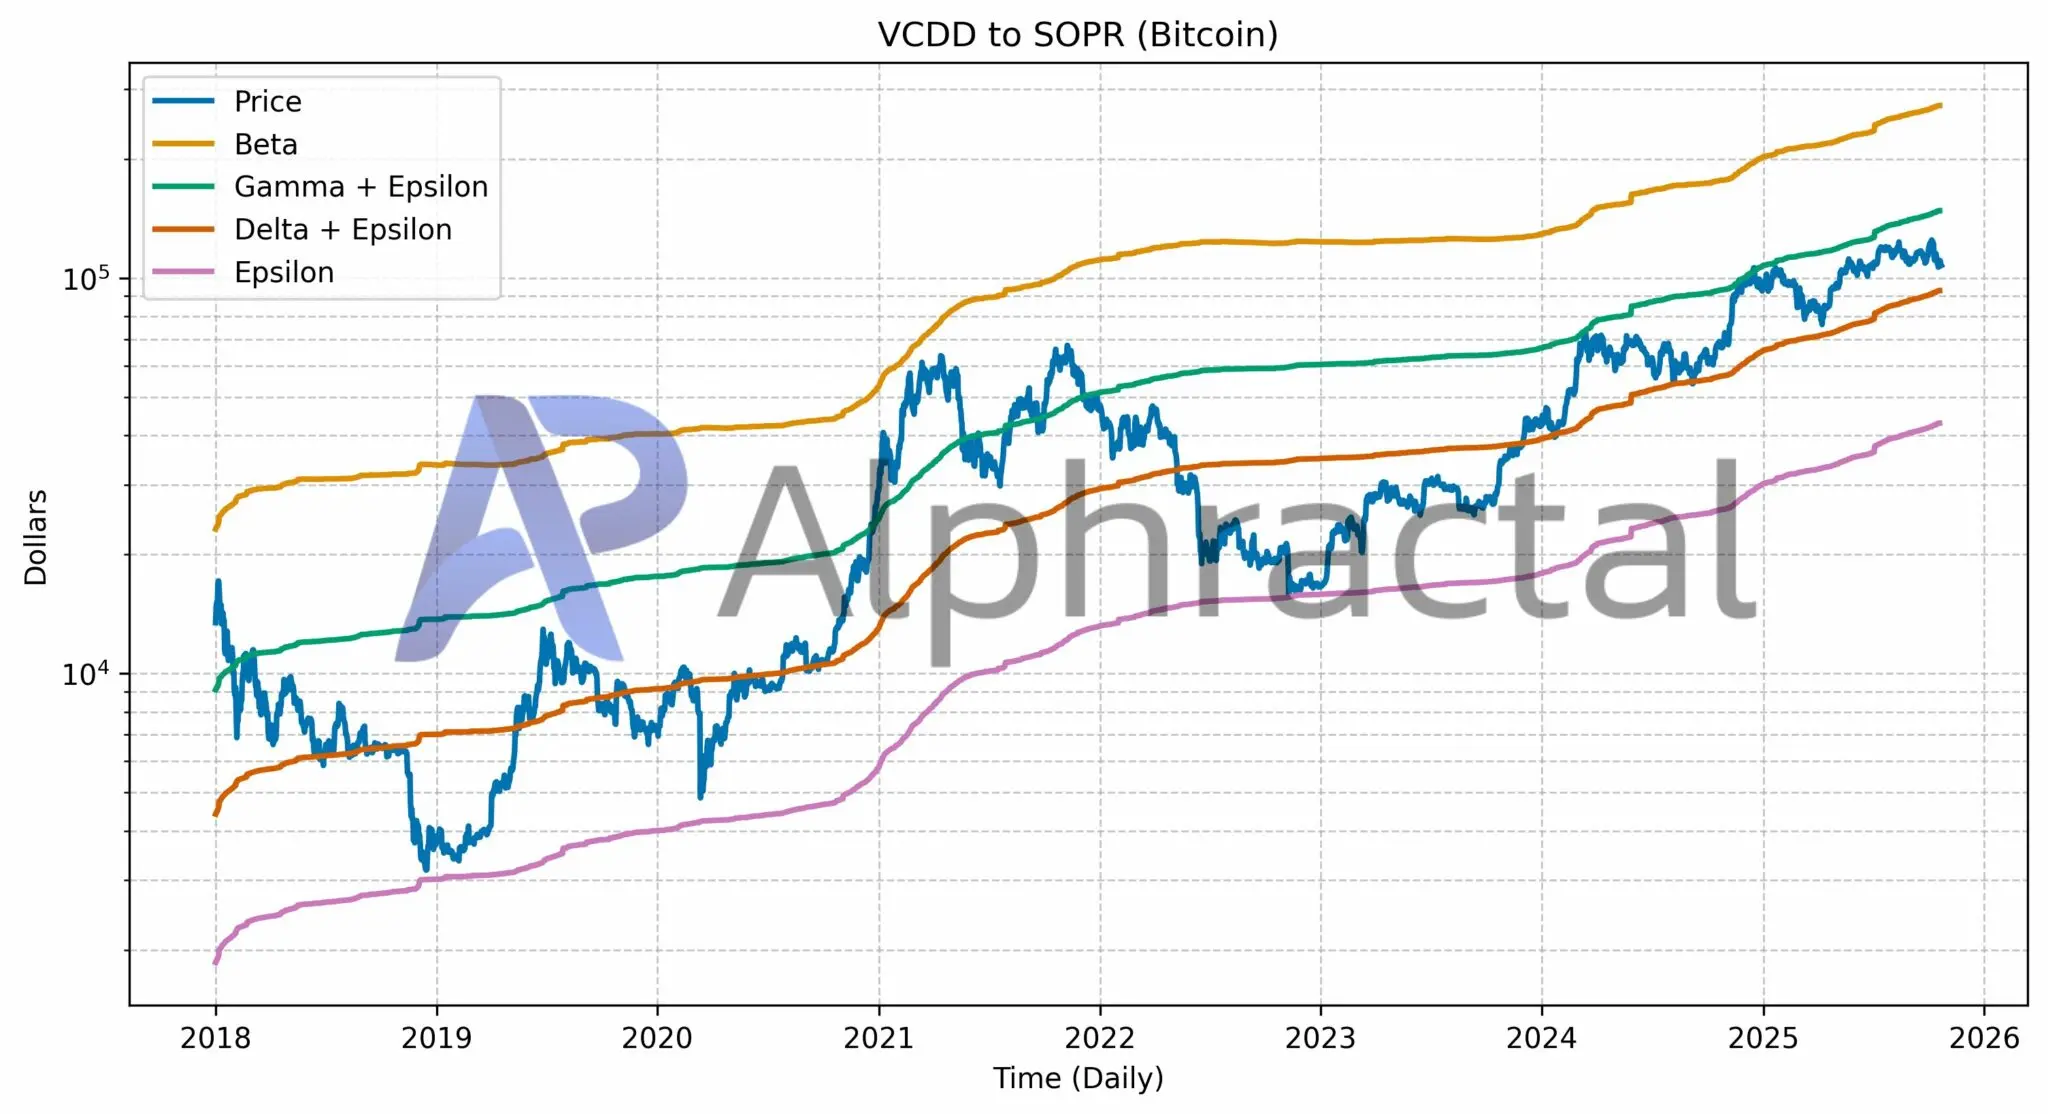 Source: AlphractalCurrently, the LTH threshold is around $147,937, acting as a resistance zone where bullish momentum often faces a correction. In contrast, the STH threshold around $92,902 serves as an important support zone, with history showing that every time this area is tested, it triggers strong bullish rallies.
In this cycle, Bitcoin has been continuously fluctuating between the two price zones above. Recently, the price has been trending towards the STH support zone.
If Bitcoin reacts strongly at this support zone, the price may break through the LTH level thanks to new capital flowing into the market. On the contrary, if it breaks the STH level, the price may continue to adjust downwards before recovering.
Which trend will dominate?
Coinphoton has analyzed important signals to assess the movement trend of Bitcoin as it approaches the STH support zone.
The Binary CDD index ( shows the number of days the coin has been destroyed. ) currently indicates a slightly negative outlook as some large investors move their holdings—likely to sell.
The CDD index at 1 indicates that these investors have just transferred tokens, implying that short-term selling activity is occurring.
 Source: CryptoQuantHowever, the analysis of the Net Realized Profit/Loss index shows that recent sell-offs have not yet reached the capitulation threshold. According to blockchain analytics firm Swissblock, selling pressure is showing signs of easing. They stated:
“Upcoming inflation data may create short-term volatility; however, selling pressure usually lessens after the market absorbs this information.”
Is the traditional cycle of Bitcoin about to end?
Recent data suggests that Bitcoin's traditional four-year cycle may be coming to an end. According to the Efficient Market Hypothesis, the participation of large institutions has changed Bitcoin's cyclical behavior as it gradually becomes a global asset.
The market analyst with the nickname Arc Physicist stated:
“If Bitcoin is truly evolving into a global asset, growth cycles may last longer. The fact that the higher support level ( LTH ) is still being held may be a sign that a strong bull run has not yet really begun.”
Currently, with selling pressure decreasing and no signs of capitulation appearing, a new growth phase for Bitcoin is still highly anticipated.
Mr. Teacher
Disclaimer: The information on this page may come from third parties and does not represent the views or opinions of Gate. The content displayed on this page is for reference only and does not constitute any financial, investment, or legal advice. Gate does not guarantee the accuracy or completeness of the information and shall not be liable for any losses arising from the use of this information. Virtual asset investments carry high risks and are subject to significant price volatility. You may lose all of your invested principal. Please fully understand the relevant risks and make prudent decisions based on your own financial situation and risk tolerance. For details, please refer to
Disclaimer.
Related Articles
Bitcoin Barely Avoids Equaling Worst Red Monthly Streak: What’s Next for April?
After another volatile month fueled by the war moves in the Middle East, bitcoin managed to scrape above the surface at the end and finished with a minor increase.
The focus has now turned to April and Q2, and _CryptoPotato_ turned to a leading expert about their take on the matter and what
CryptoPotatoJust Now
Bitcoin Finally Scores Green Monthly Candle - U.Today
Bitcoin, the leading cryptocurrency by market cap, has now scored a month in the green, breaking a long streak of red candles on the monthly chart
The bulls managed to eke out a very modest 1.84% during March, which ended up being a rather volatile month
The leading cryptocurrency was
UToday16m ago
F2Pool Co-Founder Says Thai Condo Bought for 2,900 BTC Was Sold for Just 7 Bitcoin
Wang Chun, co-founder of F2Pool, sold a condo in Thailand for 7 BTC, which he originally bought for 2,900 BTC in 2015. This transaction highlights Bitcoin's significant long-term opportunity cost, illustrating the risks early adopters faced when spending Bitcoin instead of holding it.
CryptoNewsFlash16m ago
Strategy preferred shares STRC raised funds yesterday that can be used to buy 2724 BTC
Gate News reports that, on April 1, according to monitoring by BitcoinTreasuries.NET, the preferred stock STRC issued by Strategy yesterday raised funds that can purchase 2,724 bitcoins.
GateNews30m ago
The Texas legislature will include prediction markets and cryptocurrency in its 2027 legislative priorities
Texas Senate vice governor Dan Patrick announced that the forecast market, cryptocurrency, and blockchain research will be priorities for the next legislative session, aiming to advance the Texas conservative agenda. Texas will evaluate cryptocurrency ATMs and strengthen coordination of federal regulatory efforts, while also focusing on the legal compliance of prediction markets. In addition, Patrick proposed studying the impact of artificial intelligence on the workforce. Texas markets and investors will closely watch the development of relevant policies.
GateNews30m ago
