Is $28K Imminent For BTC In The Next Few Days? (Bitcoin Price Analysis)
CryptoPotato
Bitcoin’s price has exhibited significant volatility recently, surpassing its previous minor swing high while simultaneously encountering substantial rejection. Nonetheless, the price is approaching a crucial area, with the overall price action signalling a bearish outlook.
Technical Analysis
By Shayan
The Daily Chart
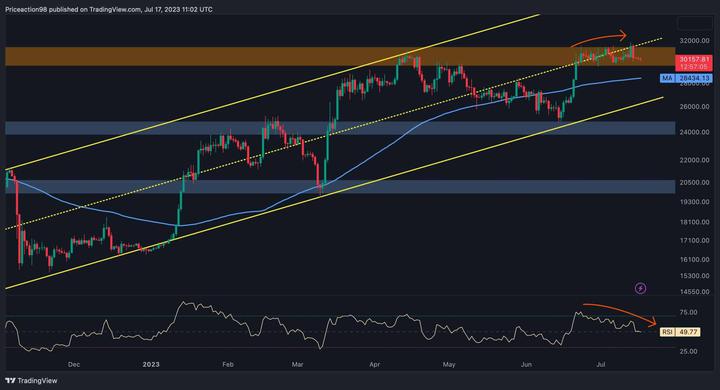
A thorough analysis of Bitcoin’s daily chart reveals the formation of an evident bearish double-top pattern near the major resistance region of $30K. Additionally, the price is facing significant dynamic resistance from the middle-trendline of the ascending channel. It is worth noting that this robust dynamic level has been hindering further price appreciation for several months.
Furthermore, a noticeable divergence between the price and the RSI indicator indicates a shift in the market condition from an uptrend state to a possible downtrend. In case the selling pressure dominates the market, Bitcoin’s next target would be the 100-day moving average situated around the $28K level.
Nonetheless, it seems likely that a rejection from the substantial resistance at $30K is imminent based on Bitcoin’s recent price action.
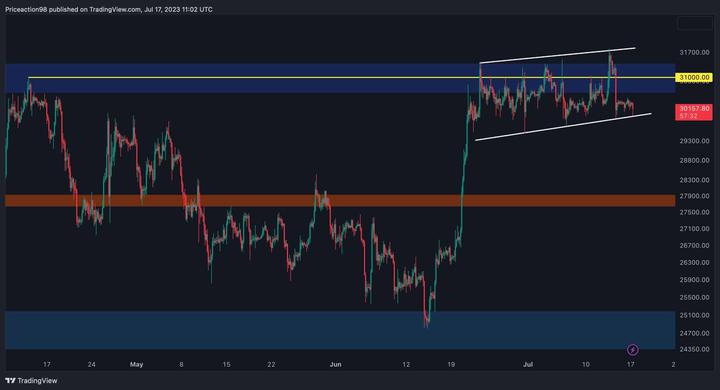
The 4-hour chart demonstrates that Bitcoin’s price has entered an extended consolidation range following its arrival at the important price zone of $30K. Notably, this critical price range aligns with Bitcoin’s previous significant swing high, developed on April 14th, which has served as strong resistance due to increased supply.
Meanwhile, the price has formed an ascending wedge pattern, typically indicating a potential reversal. Most recently, the price experienced a sharp surge, reaching the upper boundary of the wedge, only to face rejection and undergo a rapid decline. However, a break below the lower edge of the wedge suggests the possibility of a mid-term reversal.
Ultimately, in the event of a rejection, Bitcoin’s next target would be the static support region around $28K.
By Shayan
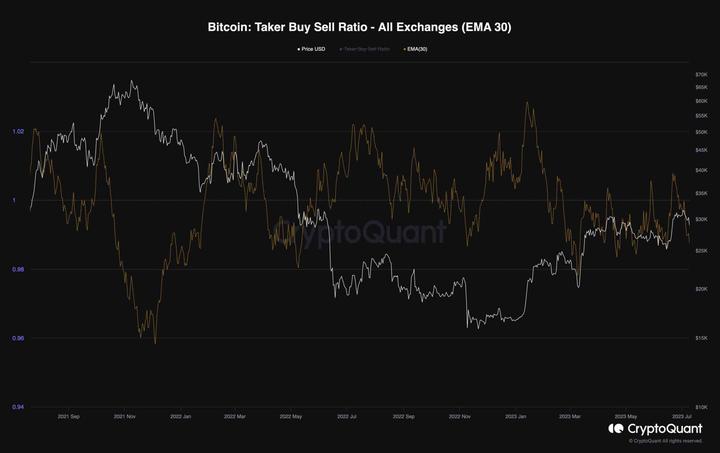
Bitcoin’s price has been volatile, especially after a significant upward surge that brought it close to the crucial resistance level of $30K. This surge has sparked substantial speculation regarding Bitcoin’s ability to successfully break through this resistance barrier. It is advisable to closely examine the futures market to gain valuable insights into the overall market sentiment.
The provided chart illustrates the Bitcoin taker buy-sell ratio, which serves as an essential indicator of the intensity of long and short positions.
Lately, this particular metric has been fluctuating consistently below 1, following a sharp decline. However, there have been no signs of recovery thus far. This signifies that futures traders predominantly maintain a pessimistic outlook on Bitcoin, with their short positions potentially pushing downward pressure on the price in the short term.
免责声明:本页面信息可能来自第三方,不代表 Gate 的观点或意见。页面显示的内容仅供参考,不构成任何财务、投资或法律建议。Gate 对信息的准确性、完整性不作保证,对因使用本信息而产生的任何损失不承担责任。虚拟资产投资属高风险行为,价格波动剧烈,您可能损失全部投资本金。请充分了解相关风险,并根据自身财务状况和风险承受能力谨慎决策。具体内容详见声明。
评论
0/400
暂无评论