
PEPE has spent weeks sliding, then it started doing something traders always watch closely. The drop looks tired near a zone that has already been tested many times. Pepe Whale, known as @PepeEthWhale on X, summed it up in one line that fits the chart well. PEPE is “flirting with exhaustion” right on a demand shelf, and that demand shelf is the whole story right now.
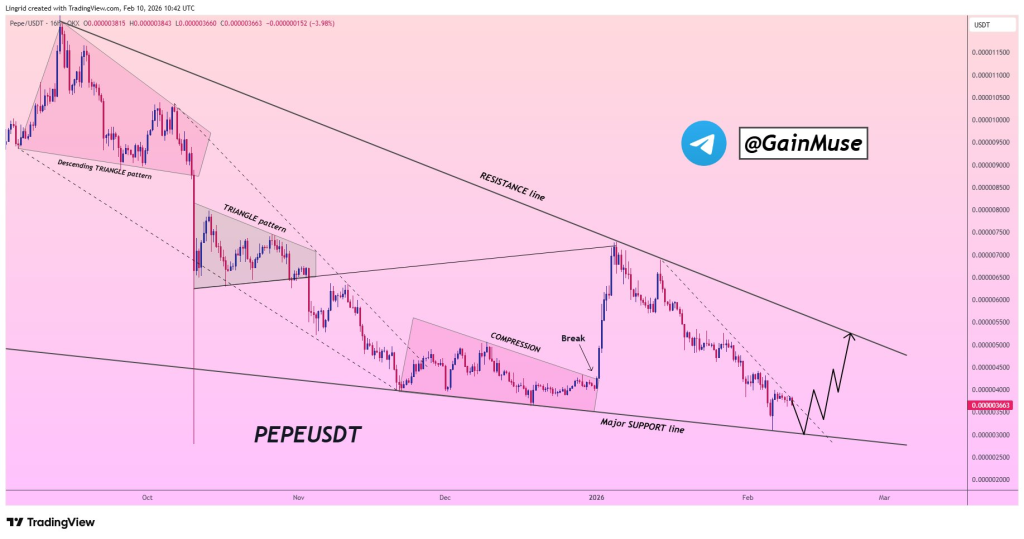
Pepe Whale says the selloff has slowed as PEPE sinks into a long-tested support band. The chart shows that same area as a major support line that price has respected through multiple swings. Price is sitting close to that base again, and that is why the $0.0000030 level matters.
Support zones like this often create a simple question. Does price bounce quickly, or does it start living below support and turn the shelf into resistance. Pepe Whale flags that risk clearly. The bullish bounce idea fails if PEPE loses acceptance at the major support and keeps printing below it.
@PepeEthWhale / X
The Chart Shows An Extended Decline That Ends In Tight Compression
PEPEUSDT on the chart is drawn inside a larger downtrend. A long resistance line slopes down from the left side of the chart, and price keeps failing near that ceiling. Several sections are marked as triangle style structures, and the middle of the chart highlights compression where candles tighten near the bottom.
Compression near support can act like a spring. Buyers and sellers trade smaller ranges until one side forces a move. Pepe Whale points to that same setup. An extended decline. Compression along major support. A bullish bias that depends on reaction from demand.
Bitcoin and Crypto Could Fall Further as Donald Trump’s New Actions Rattle Global Markets_**
PEPE Needs A Clean Push Toward $0.0000050 To Confirm Recovery
A bounce alone will not be enough to change the mood. PEPE has to prove that buyers can reclaim key checkpoints overhead. Pepe Whale highlights resistance around $0.0000050, and the chart backs that up because price previously reacted near that region before the next leg down.
A realistic recovery path looks like this. PEPE holds above the support shelf near $0.0000030. Price then climbs back toward the descending resistance area, and it challenges the $0.0000050 zone. That level becomes the first real test of strength, because it sits inside a broader downtrend structure.
Analyst Points to Rare ONDO Price Setup That Could Change Investor Fortunes_**
PEPE still looks fragile, yet the current area offers a clear map. Pepe Whale has already outlined the invalidation point and the upside checkpoint. Price will decide soon, and meme coin charts usually do not stay quiet for long.
Disclaimer: The information on this page may come from third parties and does not represent the views or opinions of Gate. The content displayed on this page is for reference only and does not constitute any financial, investment, or legal advice. Gate does not guarantee the accuracy or completeness of the information and shall not be liable for any losses arising from the use of this information. Virtual asset investments carry high risks and are subject to significant price volatility. You may lose all of your invested principal. Please fully understand the relevant risks and make prudent decisions based on your own financial situation and risk tolerance. For details, please refer to
Disclaimer.
Related Articles
PEPE Consolidates Above $0.05324 Support as Momentum Strengthens and Resistance Near $0.05336 Holds
PEPE has a tight intraday price compression with a support level of $0.053243 and resistance level of $0.053363.
A RSI of 64.13 represents the moderate bullish momentum whereas MACD history is slightly positive, which indicates the gradual buying momentum.
The price is at $0.053364
CryptoNewsLand20h ago
PEPE Stalls After 15% February Drop — Is a Breakout Coming Soon?
PEPE is consolidating near $0.0000033 after a 15% February decline.
Resistance at $0.0000038 blocks recovery despite easing selling pressure.
Breakdown below $0.0000028 support could trigger another downside move.
PepeCoin — PEPE, traders now face a quieter market after a sharp February
CryptoNewsLand03-14 05:36
PEPE Consolidates Above $0.05324 Support as Momentum Strengthens and Resistance Near $0.05336 Holds
PEPE has a tight intraday price compression with a support level of $0.053243 and resistance level of $0.053363.
A RSI of 64.13 represents the moderate bullish momentum whereas MACD history is slightly positive, which indicates the gradual buying momentum.
The price is at $0.053364
CryptoNewsLand03-13 16:40
PEPE Price at $0.053259 as Tight Range and Falling Volume Shape Short-Term Market Activity
PEPE was traded at $0.053259 and has recorded a 3.0 percent fall in value but it is within a thin band of support and resistance.
The market exhibited a volume of 235.15M in 24 hour trading, which is a decline of 19.16% reflecting less trading activity.
Technical indicators are not
CryptoNewsLand03-12 19:36
PEPE Consolidates Above $0.05324 Support as Momentum Strengthens and Resistance Near $0.05336 Holds
PEPE has a tight intraday price compression with a support level of $0.053243 and resistance level of $0.053363.
A RSI of 64.13 represents the moderate bullish momentum whereas MACD history is slightly positive, which indicates the gradual buying momentum.
The price is at $0.053364
CryptoNewsLand03-12 16:31