Is the Bitcoin bear market not over yet? Traders predict the bottom will truly hit at $50,000.
Bitcoin (BTC) recorded a 3% increase during Sunday’s trading session, but many professional investors remain skeptical about whether BTC’s sharp correction has truly ended.
The Early Surrender Phase of Bitcoin “Still Not Here”
According to data from TradingView, the BTC/USD pair broke above $71,000, marking a 20% increase from the 15-month low set last Friday.
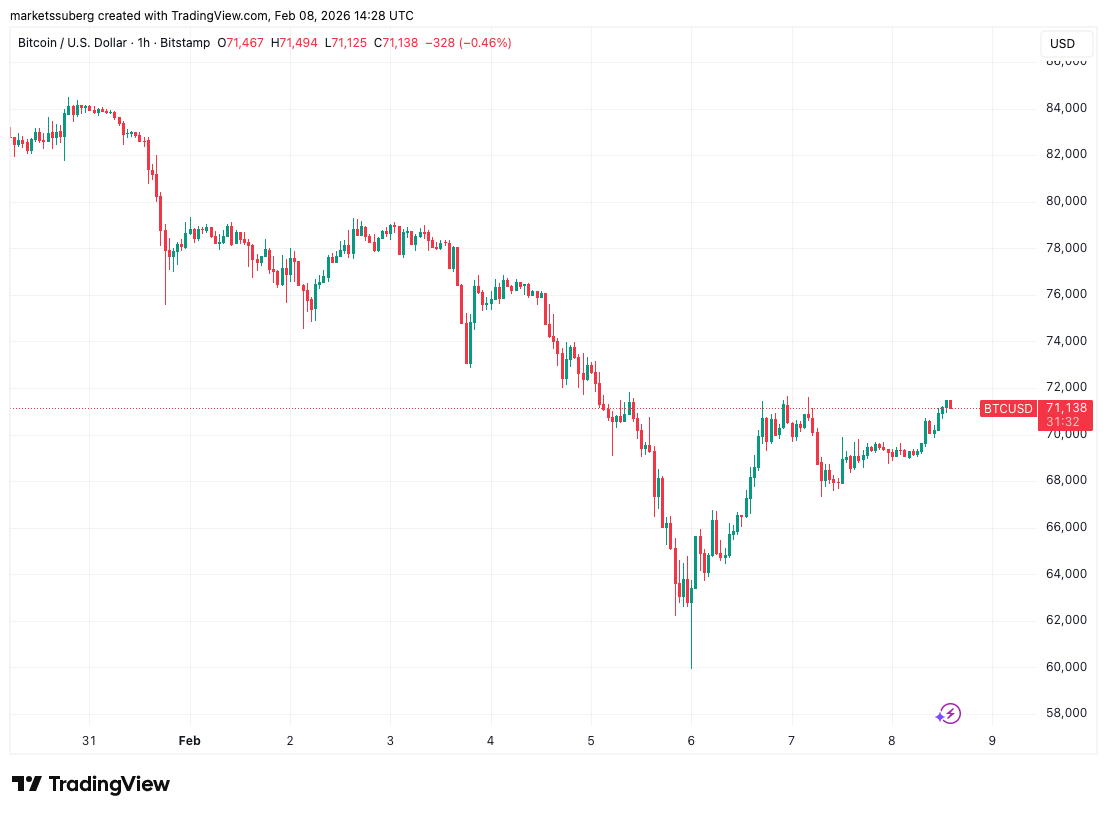 BTC/USD chart on a 1-hour timeframe | Source: Cointelegraph/TradingView As the weekly trading session nears its end, Bitcoin continues to exhibit its characteristic volatility, while the investor community maintains a high level of skepticism about the sustainability of this recovery.
Independent analyst Filbfilb shared a comparison chart on X platform, contrasting Bitcoin’s current price movements with the 2022 bear market, and did not offer positive signals for the bulls.
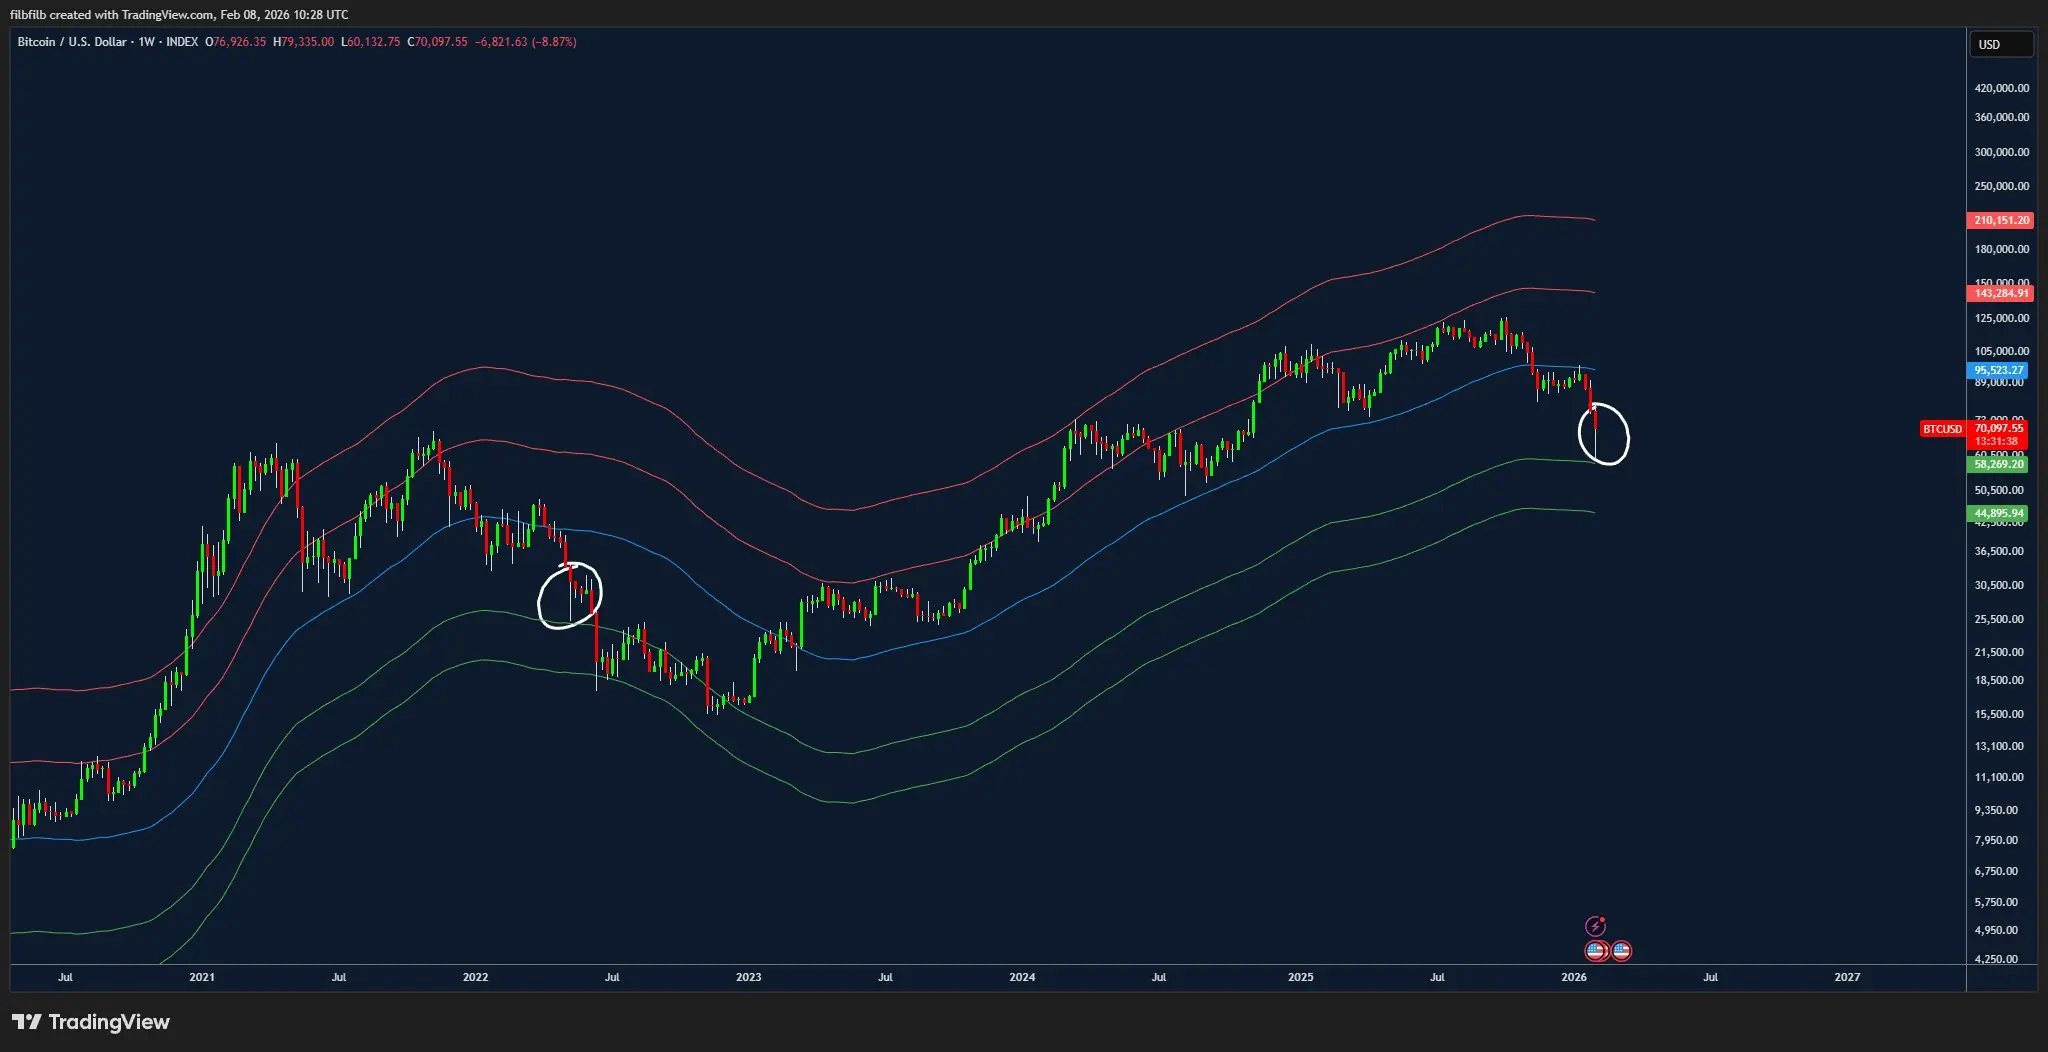 BTC/USD weekly chart | Source: Filbfilb/X “I will not try to sugarcoat this situation in any way, but simply present what the chart is showing,” he commented alongside the chart showing the spot price versus the 50-week exponential moving average (EMA) at $95,300.
Analyst Tony Severino also shared a similar view, based on multiple technical indicators, concluding that setting new lows seems almost unavoidable.
“The final surrender phase of $BTC has not yet occurred,” trader BitBull affirmed, referencing the 2022 scenario similar to Filbfilb.
“A true bottom will be formed below the $50,000 level, where most ETF investors will be in a loss.”
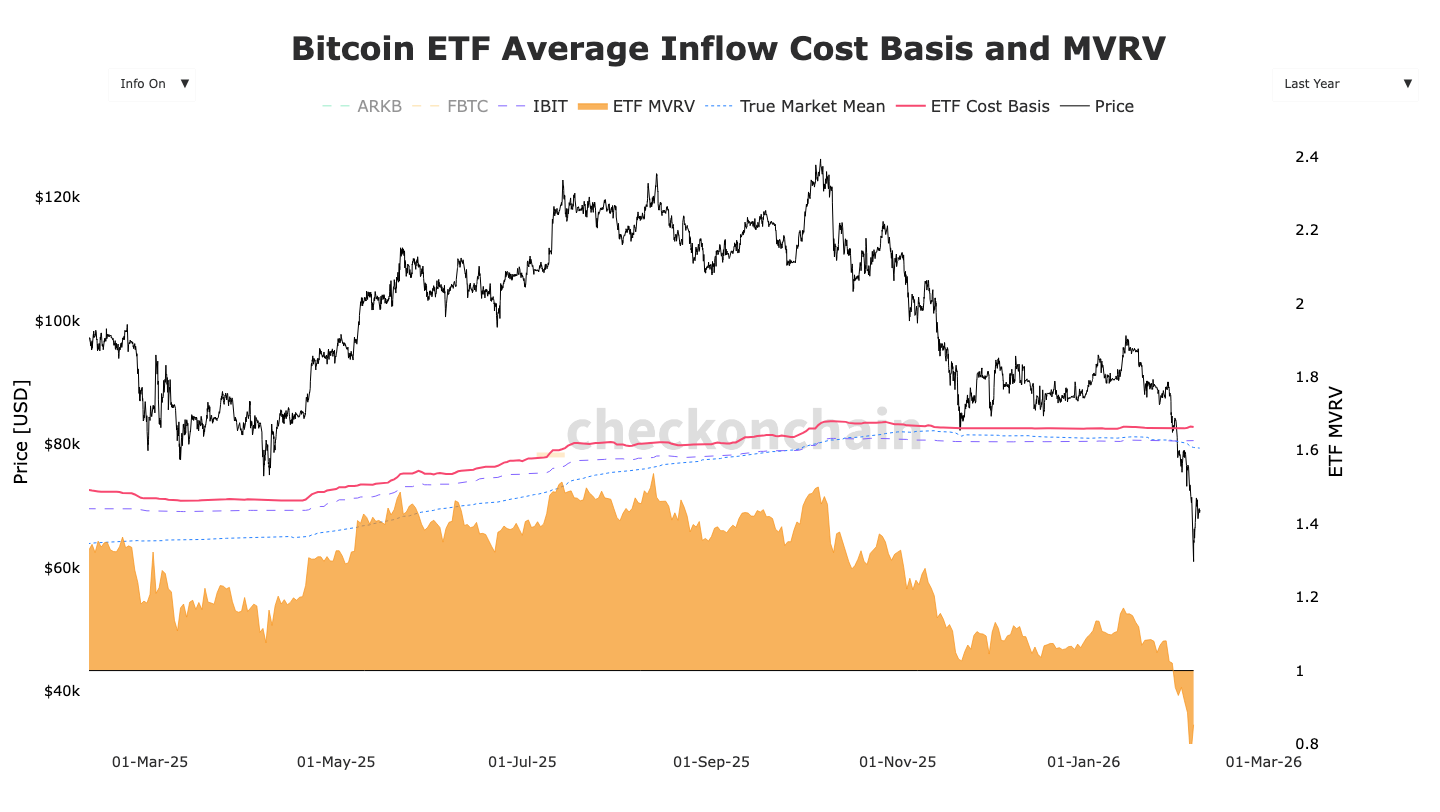 Data on US Bitcoin spot ETFs
| Source: Checkonchain According to Checkonchain data, US-based Bitcoin spot ETFs currently have an average purchase price of $82,000.
Repeating Price Action Scenario for BTC
Previously, Coinphoton reported a key characteristic of the Bitcoin bear market, based on two important trend lines: the simple moving average (SMA) and the 200-week exponential moving average (EMA).
Together, they form a “cloud” support zone between $58,000 and $68,000.
In the latest weekend market analysis, Caleb Franzen – founder of Cubic Analytics – argued that at this price range, the “ghost” of 2022 is still present.
“In May 2022, Bitcoin retested the 200-week MA cloud. The bullish side confirmed ‘That’s enough, we’ve retested the long-term moving average and can now continue the upward trend.’ The price immediately rebounded in this zone, creating a long wick and closing above the midpoint of the weekly range,” he explained.
“However, that rally then weakened… The price returned to the 200-week MA cloud a few weeks later, failed to recover, and subsequently broke through the cloud in June 2022. What we are witnessing now is what? The first test of the 200-week MA cloud with a long wick.”
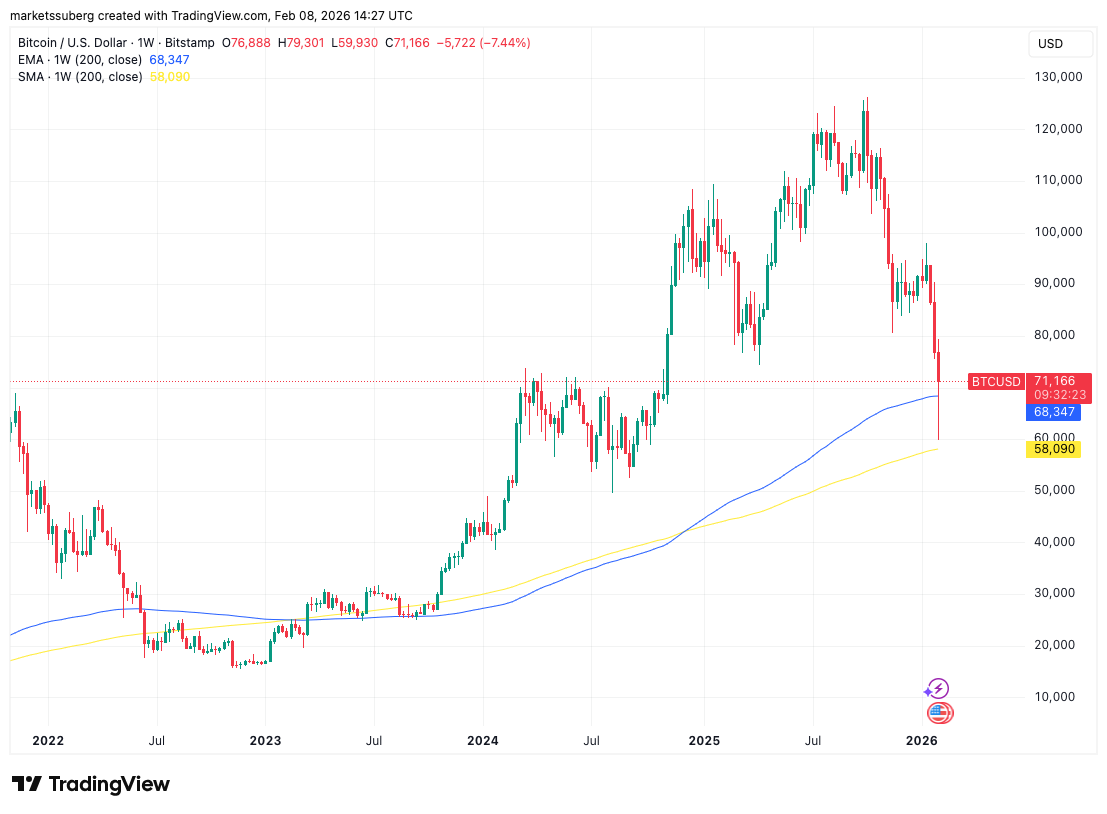 Weekly BTC/USD chart with 200-day moving average (200 SMA) and 200-day exponential moving average (200 EMA) | Source: Cointelegraph/TradingView Franzen noted that the market may not exactly replicate the previous bear market.
“The reality is, no one can predict exactly what will happen next,” he cautiously admitted.
Related Articles
Here’s the XRP Price If Bitcoin Enters a Real 2026 Crypto Winter
Whale Alert Founder: BTC's potential profit level has fallen back to late 2023, possibly approaching a three-year profit cycle turning point
Bitcoin ETFs Record $127.65M Daily Outflow, Ethereum and Solana ETFs Show Mixed Performance
BTC 15-minute increase of 1.17%: Safe-haven funds flow back and futures leverage resonance drive the rebound