
Key Takeaways
-
Bitcoin has dropped into a major 10-month support zone between $74,500–$78,600
-
The weekly chart shows a developing head and shoulders structure
-
BTC has corrected nearly 40% from its all-time high near $121,900
-
Reclaiming the 100-week MA around $87,263 could trigger a move toward $109,568
-
A breakdown below support may expose BTC to deeper downside toward the $49,000 region
Bitcoin has entered a critical phase in early February 2026, sliding into a zone that hasn’t been meaningfully tested in nearly ten months. After weeks of sustained selling pressure, BTC has dropped into the $74,500–$78,600 support range, an area that previously acted as a strong base during April-2025.
As of February 2, 2026, Bitcoin is trading near $76,614, down 2.24% over the past 24 hours, with an intraday low touching $74,551. On a broader scale, BTC is now down 12.45% year-to-date, erasing a large portion of the late-2025 rally and pushing market sentiment back into caution mode.
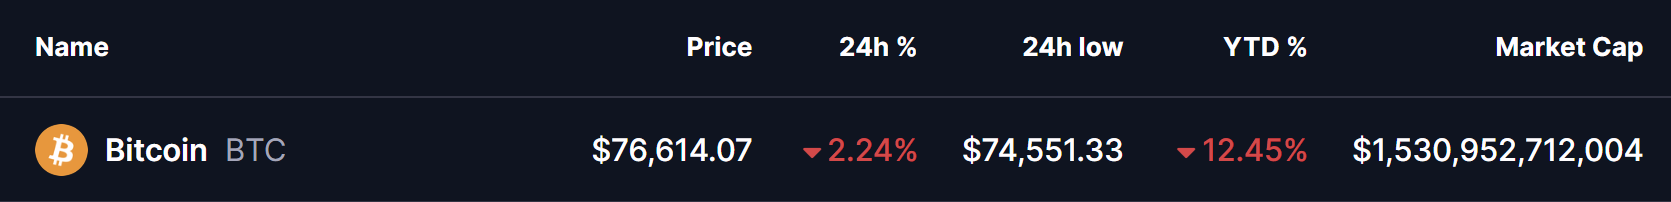
Source: Coinmarketcap
Yet, while price action looks heavy on the surface, the weekly chart structure suggests this move may be more than just panic-driven selling.
A Head and Shoulders Structure Near Completion
On the weekly timeframe, Bitcoin is carving out a developing head and shoulders pattern, a classic structure that often marks a major transition in trend. The “head” of the pattern formed near Bitcoin’s all-time high region around $121,900, from where BTC has corrected roughly 40% at its worst point.
The recent breakdown below the 100-week moving average, currently near $87,263, accelerated downside momentum and dragged price directly into the neckline support zone between $74,500 and $78,600.
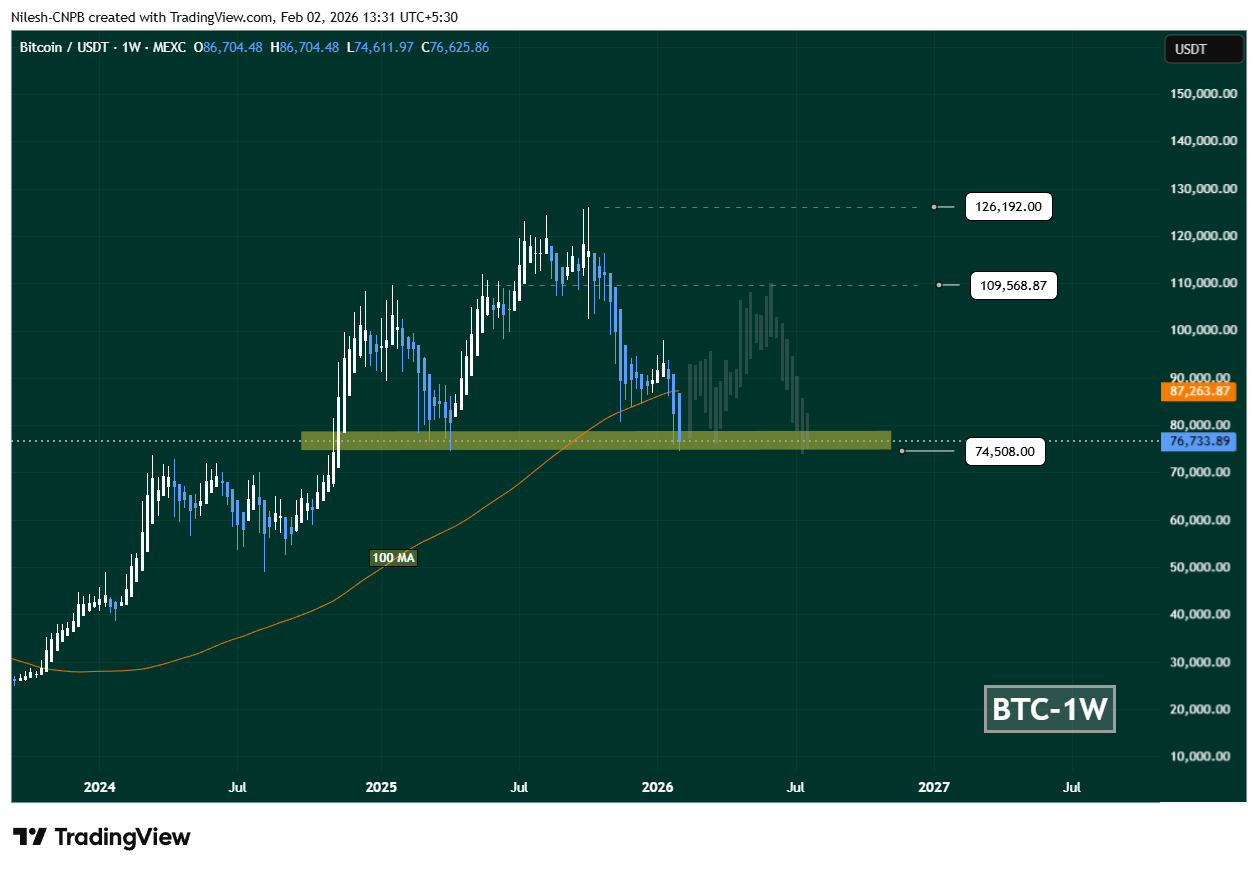
Bitcoin (BTC) Weekly Chart/Coinsprobe (Source: Tradingview)
This neckline is not just a random horizontal level. Historically, it has acted as a high-demand area, absorbing selling pressure and triggering strong rebounds. The latest weekly candle shows a clear downside wick into this zone, hinting that selling momentum may be weakening as buyers cautiously step in.
Liquidity Clusters Hint at a Potential Upside Magnet
Adding weight to the rebound narrative, Coinglass data highlights over $2.60 billion in liquidity stacked above the $87,000 region. This cluster creates a potential upside magnet if price manages to stabilize and reclaim key resistance levels.
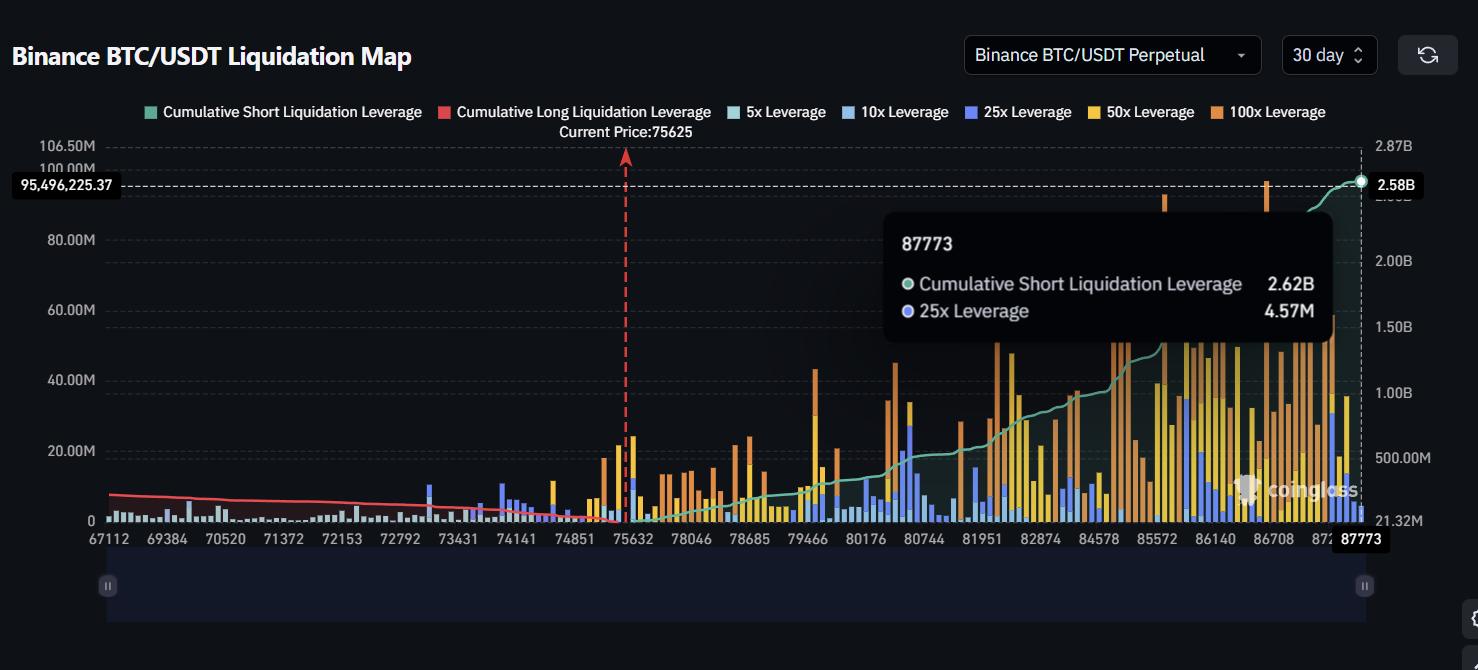
Source: Coinglass
From a market mechanics perspective, such liquidity zones often attract price once downside pressure cools, especially after a prolonged corrective move like the one Bitcoin has just experienced.
What the Chart Suggests Going Forward
If Bitcoin manages to defend the neckline support and reclaims the 100-week MA near $87,263, momentum could shift meaningfully in favor of bulls. In that scenario, a recovery toward the $109,568 region becomes technically plausible — representing a potential 40%+ upside move from current levels.
Such a rally would likely form the right shoulder of the larger head and shoulders structure, leaving BTC at a critical decision point between trend continuation or renewed consolidation.
On the flip side, failure to hold the $74,500–$78,600 zone would significantly weaken the structure. A clean breakdown below this area could open the door to a deeper correction toward the $49,000 region, where the next major liquidity pocket and historical support reside.
The Market’s Defining Moment
For now, Bitcoin is sitting at a make-or-break level. The neckline zone remains the battlefield where bulls and bears are actively fighting for control. How price reacts here will likely set the tone for the next major trend — whether that’s a relief rally driven by liquidity hunts or a continuation of the broader corrective phase.
One thing is clear: this is not a level the market can ignore.
Disclaimer: The views and analysis presented in this article are for informational purposes only and reflect the author’s perspective, not financial advice. Technical patterns and indicators discussed are subject to market volatility and may or may not yield the anticipated results. Investors are advised to exercise caution, conduct independent research, and make decisions aligned with their individual risk tolerance.
About Author: Nilesh Hembade is the Founder and Lead Author of Coinsprobe, with over 5 years of experience in the cryptocurrency and blockchain industry. Since launching Coinsprobe in 2023, he has been providing daily, research-driven insights through in-depth market analysis, on-chain data, and technical research.
Disclaimer: The information on this page may come from third parties and does not represent the views or opinions of Gate. The content displayed on this page is for reference only and does not constitute any financial, investment, or legal advice. Gate does not guarantee the accuracy or completeness of the information and shall not be liable for any losses arising from the use of this information. Virtual asset investments carry high risks and are subject to significant price volatility. You may lose all of your invested principal. Please fully understand the relevant risks and make prudent decisions based on your own financial situation and risk tolerance. For details, please refer to
Disclaimer.
Related Articles
The 'Hyperbolic' Era Ends: Wintermute Report Reveals Structural Shift for Bitcoin
Over the past decade, bitcoin mining thrived on predicting price surges after halvings. However, a new report by Wintermute indicates this reliance has ended as bitcoin matures into an institutional asset, disrupting previous profitability cycles.
Diminishing Returns in the Post-Institutional
Coinpedia7m ago
Spot Bitcoin ETFs Push Inflows to Five-Day Streak, First in 2026
US spot Bitcoin ETFs posted their first five-day inflow streak of 2026, tallying roughly $767.32 million for the week and signaling renewed investor appetite for physical-exposure products amid a volatile macro backdrop. Net inflows on Friday reached $180.33 million, extending a trend that began
CryptoBreaking32m ago
过去24小时全网爆仓2.79亿美元,空单爆仓占比超五成
Gate News 消息,3 月 14 日,据 CoinAnk 数据,过去 24 小时全网爆仓 2.79 亿美元,其中多单爆仓 1.32 亿美元,空单爆仓 1.47 亿美元,空单爆仓占比略高。从币种来看,比特币爆仓约 1.28 亿美元,以太坊爆仓约 5892 万美元。
GateNews1h ago
加密货币恐慌指数升至16,市场仍处「极度恐慌」状态
Gate News 消息,3 月 14 日,据 Alternative 数据,今日加密货币恐慌与贪婪指数小幅升至 16,上月均值为 5,市场仍处于「极度恐慌」状态。恐慌指数阈值为 0-100,其计算包含以下指标:波动性(25%)、市场交易量(25%)、社交媒体热度(15%)、市场调查(15%)、比特币在整个市场中的比例(10%)及谷歌热词分析(10%)。
GateNews1h ago
Top Analyst Reveals Bitcoin (BTC) Roadmap and Key Price Levels For the Next 2 Years
Bitcoin has declined greatly after reaching a new all-time high of $126,000 in 2025. Since then, the price has been reacting to negative economic developments and trading mostly between $60,000 and $74,000 during the past 2 months.
Current market action shows BTC holding near $70,000 as
CaptainAltcoin1h ago
BTC Accumulation Patterns Emerge After $67K Slide
BTC shows accumulation as whales maintain balanced exchange-to-whale ratios, signaling potential market stabilization.
Exchange reserves decline, indicating investors move Bitcoin into private wallets for long-term holding.
Technical indicators suggest consolidation near trendline
CryptoNewsLand2h ago