
Key Takeaways
-
Solana has dropped nearly 15% weekly, tracking broader altcoin weakness
-
SOL is testing a major support zone near $95, repeatedly defended by buyers
-
The weekly chart shows a descending triangle pattern
-
A hold above $95 keeps the rebound scenario intact
The broader altcoin market has come under heavy selling pressure over the past few days. Ethereum (ETH) has dropped more than 18%, dragging sentiment across major assets lower. Solana (SOL) hasn’t been spared, shedding nearly 15% on the week, though it is now showing early signs of stabilization with modest recovery attempts.
While short-term sentiment remains fragile, a closer look at SOL’s weekly chart suggests price has reached a technically important area — one that could act as the foundation for a potential bounce if buyers continue to step in.
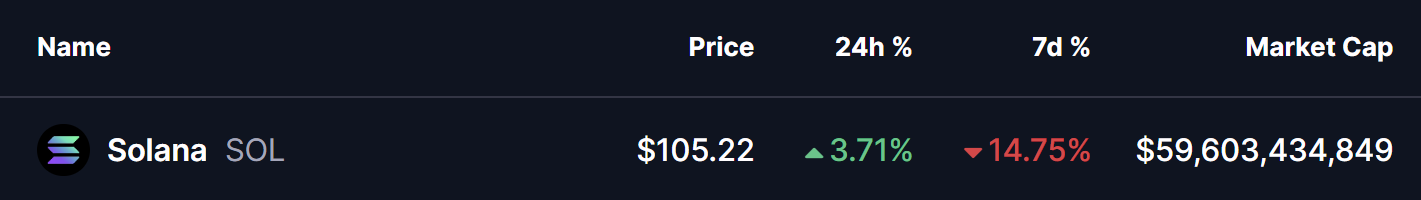
Source: Coinmarketcap
Descending Triangle Takes Shape
From a structural standpoint, Solana appears to be trading within a large descending triangle pattern on the weekly timeframe. This formation is characterized by lower highs pressing against a relatively flat support zone, reflecting sustained selling pressure over time.
Although descending triangles are often viewed as bearish, the context here is important. When price repeatedly tests a strong base without breaking down, it can also signal accumulation rather than distribution, especially during broader market corrections.
During the latest leg lower, SOL dipped into the lower boundary of the triangle, finding demand near the $95 level. Buyers reacted decisively at this zone, pushing price back toward the $105 area. This response suggests that bulls are actively defending the structure and are not yet ready to surrender control.
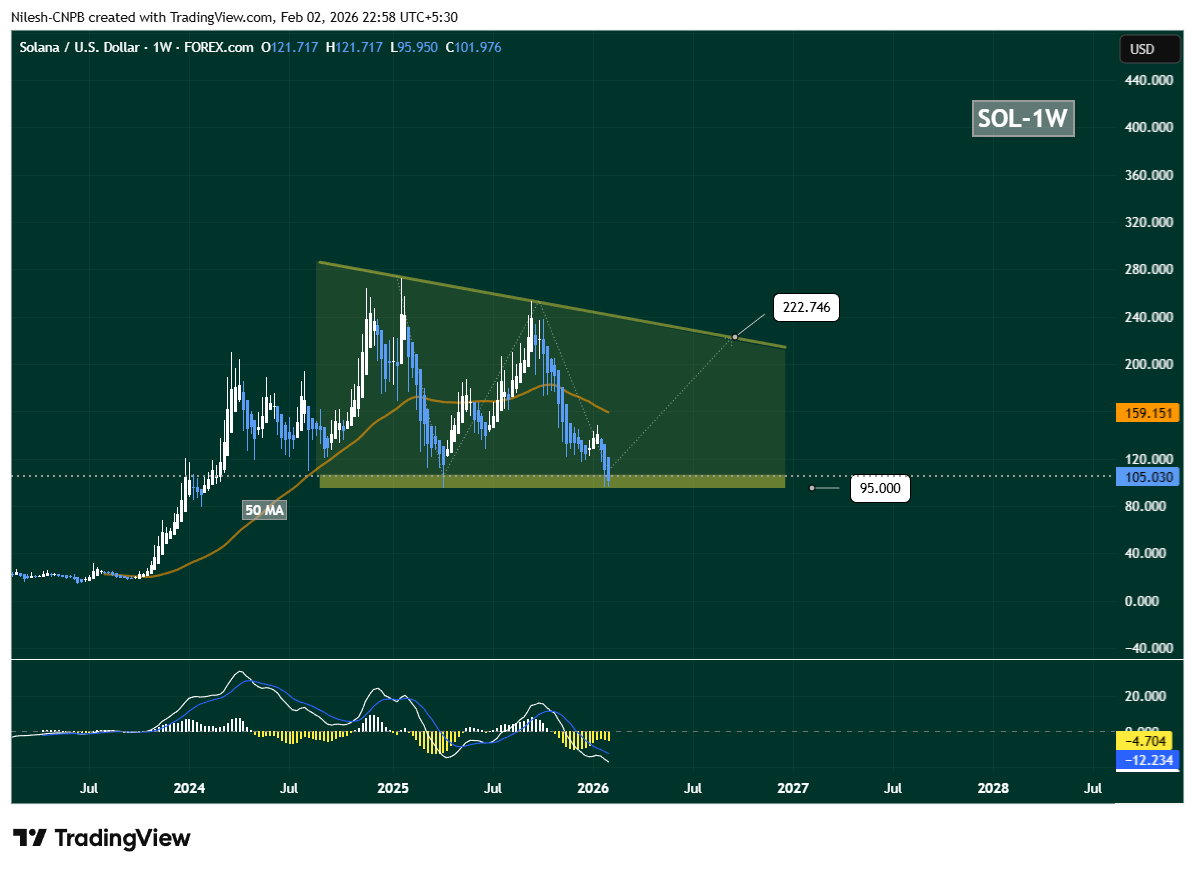
Solana (SOL) Weekly Chart/Coinsprobe (Source: Tradingview)
The repeated defense of the $95 region reinforces its role as a critical accumulation zone. As long as SOL holds above this level, the broader technical structure remains intact.
What’s Next for SOL?
If SOL continues to defend the $95 support zone, the descending triangle structure remains valid. Sustained holding above this base keeps the door open for a rebound attempt, particularly if price begins printing higher daily or weekly closes.
A key level to watch on any recovery is the 50-week moving average, which currently sits above price and acts as dynamic resistance. A successful reclaim of this moving average could allow SOL to gradually work its way toward the upper boundary of the triangle near $222.74 — a move that would represent a meaningful recovery from current levels.
On the downside, a decisive weekly close below $95 would weaken the bullish case. Such a breakdown could invalidate the structure and expose SOL to either a deeper pullback or an extended consolidation phase.
Bottoming MACD Hints at Momentum Shift
Adding to the constructive setup, the weekly MACD is showing early signs of bottoming. While momentum remains negative, the histogram has begun to flatten, and selling pressure appears to be losing strength. Historically, similar MACD behavior near major support zones has preceded trend stabilization or relief rallies.
Although this is not yet a confirmed bullish crossover, it does suggest that downside momentum may be exhausting, aligning with the strong buyer response seen near the $95 support.
Final Outlook
For now, Solana is sitting at a make-or-break level. As long as the $95 zone holds and momentum continues to stabilize, the conditions for a bounce remain on the table. The coming weeks will be crucial in determining whether SOL can turn this defensive stand into a broader recovery — or whether sellers regain control and force a deeper reset.
Disclaimer: The views and analysis presented in this article are for informational purposes only and reflect the author’s perspective, not financial advice. Technical patterns and indicators discussed are subject to market volatility and may or may not yield the anticipated results. Investors are advised to exercise caution, conduct independent research, and make decisions aligned with their individual risk tolerance.
About Author: Nilesh Hembade is the Founder and Lead Author of Coinsprobe, with over 5 years of experience in the cryptocurrency and blockchain industry. Since launching Coinsprobe in 2023, he has been providing daily, research-driven insights through in-depth market analysis, on-chain data, and technical research.
Disclaimer: The information on this page may come from third parties and does not represent the views or opinions of Gate. The content displayed on this page is for reference only and does not constitute any financial, investment, or legal advice. Gate does not guarantee the accuracy or completeness of the information and shall not be liable for any losses arising from the use of this information. Virtual asset investments carry high risks and are subject to significant price volatility. You may lose all of your invested principal. Please fully understand the relevant risks and make prudent decisions based on your own financial situation and risk tolerance. For details, please refer to
Disclaimer.
Related Articles
Solana Approaches Major Triangle Breakout With $373 Target in Focus
Price action shows a tightening structure between descending resistance and a rising long-term support trendline.
The chart highlights $373.42 as a potential liquidity level if price breaks above the descending resistance.
The rising base trendline continues stabilizing price after the l
CryptoNewsLand1h ago
Today's US cryptocurrency ETF net inflows: BTC 2227, ETH 11681, SOL 88561
Gate News Update: On March 16, according to Lookonchain monitoring, today's cryptocurrency ETF capital inflows in the United States are as follows: Bitcoin ETF net inflow of 2227 BTC, Ethereum ETF net inflow of 11681 ETH, Solana ETF net inflow of 88561 SOL.
GateNews2h ago
Best Crypto to Buy Now: As ETH Breaks $2,100, Whales Rotate Into AlphaPepe and Solana for Unprece...
The second weekend of March 2026 has officially shifted the market into a new gear. For months, the $2,100 level was a psychological and technical brick wall for Ethereum (ETH), but as of today, that resistance has been blown out of the water. With ETH now comfortably holding its ground above that m
BlockChainReporter2h ago
In the past 24 hours, the entire network liquidated $296 million, with short positions accounting for nearly 80% of the total.
Gate News report: On March 16, according to CoinAnk data, the network liquidated a total of $296 million in the past 24 hours, of which long positions liquidated approximately $63.5177 million and short positions liquidated approximately $233 million. By cryptocurrency: Bitcoin liquidated approximately $101 million, Ethereum liquidated approximately $98.6204 million, SOL liquidated approximately $16.2673 million, and on-chain crude oil synthetic asset XYZ:CL liquidated approximately $7.1913 million.
GateNews4h ago
