Silver has been a mess lately. Big swings, fast reversals, and price action that keeps shaking out both sides. One day it looks strong, the next day it looks broken. That kind of tape pulls attention toward the metal itself and away from everything linked to it.
That’s why Otavio Costa flagged something most traders ignore during chaos: the silver miners-to-silver ratio. His point is simple. When silver gets all the headlines, miners can get left behind. And when that gap stretches to an extreme, it can mark a turning point.
- What Costa Posted, In Plain English
- What the Chart Is Measuring
- The “Margins Like Tech” Line
- The Risk That Can Break the Thesis
What Costa Posted, In Plain English
Costa’s tweet is a direct hit at sentiment.
Not long ago, the crowd was obsessed with silver clearing $50. Now silver is above that area, yet miner valuations don’t look like they’re pricing in a strong metals tape at all. He also highlights something that matters more than hype: costs. Some producers, he says, are running at sub-$15/oz costs even with higher silver prices. That’s a wide operating spread.
His message isn’t “miners can’t lose.” It’s “the market is pricing miners like it’s still a weak environment, even though the underlying metal price is much higher than it used to be.”
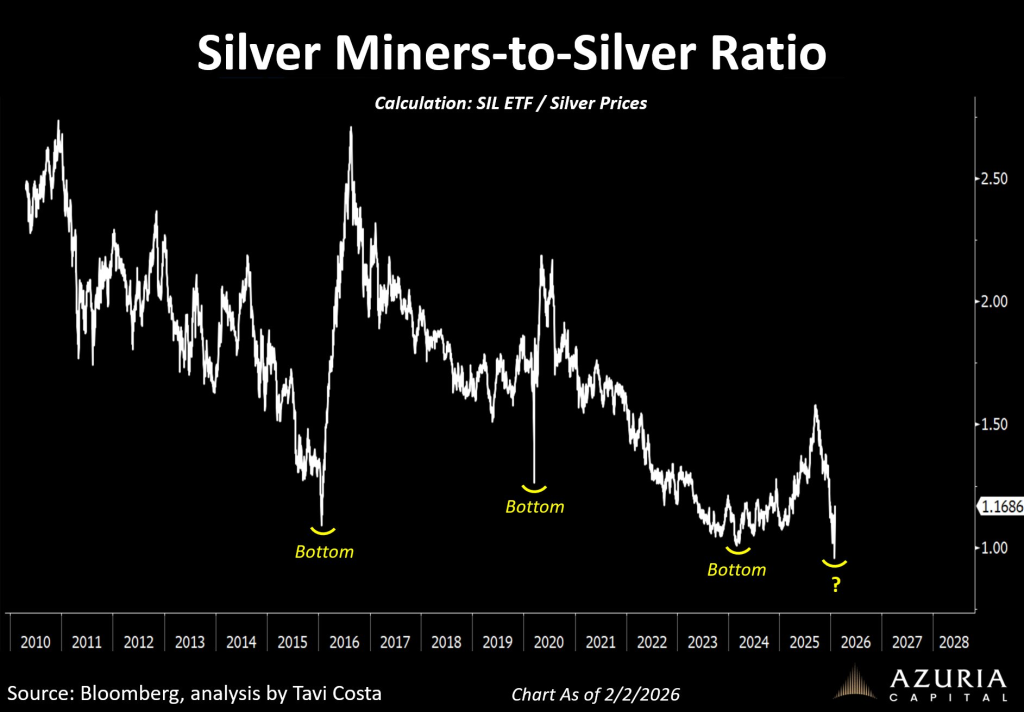
What the Chart Is Measuring
The chart title tells you the whole method:
Silver Miners-to-Silver Ratio
Calculation: SIL ETF / Silver Prices
Source: X/@TaviCosta
So this is not a chart of silver. It’s a relative performance chart. It tracks whether miners are outperforming or underperforming the metal.
- Ratio rising = miners are beating silver
- Ratio falling = miners are lagging silver
This matters because miners are leveraged to the metal in more ways than one. If silver holds up and operating costs stay controlled, miner earnings can expand fast. When the market starts pricing that in, miners can move harder than the metal.
Costa marks several “Bottom” zones on the chart. The ratio hit major lows around past stress periods and then bounced sharply after.
That pattern is the core idea here: extreme pessimism in miners can create a reset point. Miners often get punished for reasons that have little to do with the current silver price—equity market risk, financing fears, dilution worries, political risk, operational headlines. When investors get defensive, miners can be dumped even if the metal stays elevated.
A ratio near historic lows suggests one thing: the market has been willing to pay up for silver exposure, but not for the businesses digging it out of the ground.
Read also: Why Silver Price Just Had a Historic Crash: Paper Shorts Crushed the Market in a Coordinated Hit
The “Margins Like Tech” Line
Costa’s “tech-like margins” line is meant to wake people up.
If a producer’s all-in costs are near $15 and the realized price is far above that, the business can throw off serious cash. That’s the theory. The market usually rewards that setup, but it often waits for proof—clean quarters, improving guidance, stronger balance sheets, and capital returns.
The ratio being crushed implies the market is not paying for that possibility yet. It’s pricing miners like the good times are fragile.
This ratio needs miners to stop bleeding relative to the metal.
A few things typically push the ratio higher:
- Silver stabilizes instead of whipping around daily
- Risk appetite returns to equities
- Miners start printing stronger financial results
- Costs stay contained and guidance holds up
If those pieces line up, miners can start catching up fast.
The Risk That Can Break the Thesis
This is not a free trade.
Miners carry risks the metal doesn’t: jurisdiction issues, production misses, cost inflation, hedging mistakes, dilution, and broad stock market selloffs that hit everything with a ticker. Even if silver holds, miners can stay cheap longer than most expect.
That’s the real warning inside the chart. A low ratio can signal value, but it can also signal that investors don’t trust the sector.
If silver calms down and the tape stops punishing risk, miners don’t need a miracle to re-rate. They just need the market to stop treating them like a problem and start treating them like a business with real cash flow potential.
That’s the bet behind the tweet. Game on, but with eyes open.
Read also: Gold, Stocks, and Bitcoin Are Falling -Here’s What Might Be Breaking Behind the Scenes
Disclaimer: The information on this page may come from third parties and does not represent the views or opinions of Gate. The content displayed on this page is for reference only and does not constitute any financial, investment, or legal advice. Gate does not guarantee the accuracy or completeness of the information and shall not be liable for any losses arising from the use of this information. Virtual asset investments carry high risks and are subject to significant price volatility. You may lose all of your invested principal. Please fully understand the relevant risks and make prudent decisions based on your own financial situation and risk tolerance. For details, please refer to
Disclaimer.
Related Articles
Bitcoin Trades Narrow Range As Resistance Holds Near $71K
Bitcoin is trading around $70,335, showing a 2.13% decline in 24 hours. Analysts note a resistance near $71,400 and a consolidation phase, with traders awaiting a decisive breakout above or below established support and resistance levels.
CryptoBreaking6m ago
BTC 15-minute rise of 0.60%: ETF capital inflows and technical breakout resonance drive short-term momentum
2026-03-13 12:45 to 2026-03-13 13:00 (UTC), BTC achieved a +0.60% return within 15 minutes, with a price range of 72341.6-72888.0 USDT and a volatility amplitude of 0.76%. Short-term price oscillations noticeably intensified. Due to abundant trading volume, market attention rose rapidly, reflecting a phase of strengthened buying power.
The primary drivers of this movement are continuous net inflows into ETFs and a technical breakout of key structures. In March 2026, BTC spot ETFs attracted capital inflows as high as 1.6 billion dollars in a single week.
GateNews59m ago
DeFi enters a "winter of yields": liquidity stagnation, leverage contraction, and the disappearance of arbitrage opportunities
The DeFi market entered an "interest rate winter" since September 2025, with deposit rates for major stablecoins declining sharply and supply-demand imbalances causing liquidity congestion. The rate decline reflects reduced capital demand and a lack of high-return opportunities. Stablecoin lending demand has dropped significantly, with market risk appetite shifting toward more stable investment channels. In response to this situation, the Sky protocol demonstrates competitiveness and adaptability by introducing real-world assets to enhance yields. The low interest rates during this phase can be viewed as an opportunity for DeFi market transformation.
区块客1h ago
"Seeking a Sword by Marking a Boat" - Style Coin Price Predictions Go Viral: The Practical Logic and Flaws of Mystical Prophecies
Author: Frank, PANews
Whenever the market enters a confusing phase of going nowhere, people try to use a "cutting the boat to seek the sword" method of historical retrospection to predict the next market movement. In such cases, people often see from these theories and charts that history always repeats itself, and seem to automatically overlay and verify future price movements with a certain period in the past.
This coincidence seems to have a magical effect and is often verified. Some bloggers claim this prediction method has an accuracy rate of 75%~80%.
Does this "cutting the boat to seek the sword" style price prediction that repeatedly goes viral on social media help the market identify stages, or is it just packaging noise as prophecy?
From "Tick Fractals" to "History Rhyming"
The peak operation regarding predictions of October 2025 market tops is an analyst named CryptoBullet, who created a method called "ti
区块客1h ago
Surviving Oscillating Markets: How Retail Investors Can Minimize Losses? Capital Flow Trends and Practical Guide
Author: MyToken
In the crypto market, sentiment often emerges more easily than logic. When "volatility" becomes the norm for the broader market and "anxiety" becomes the prevailing mindset among retail investors, a discussion on how to "lose less money" carries more practical significance than any macro narrative presentation.
Recently, the renowned data aggregation platform MyToken hosted an AMA event themed "In the Current Market, How Can Retail Investors Lose Less Money? Capital Flow and Practical Guide." The event invited independent trader BTC Bull Demon King and KTX Exchange CMO Christine, who provided puzzled investors with a practical "survival guide" from the perspectives of independent traders and trading platforms respectively.
Below is a highlight recap of this AMA.
---
Market Phase Consensus: Stop Fantasizing About a Bull Run, This is a "Consolidation Phase"
Market positioning is a relatively important issue, as it directly determines the next
PANews2h ago
NAV Price Surges 44.25%: Is a New Trend Emerging?
NAV coin recently surged by 44.25%, reaching $0.032715, amid increased trading activity and fluctuating market conditions. Analysts attribute this rally to rising on-chain activity and shifting sentiment toward altcoins, while traders monitor key price levels for future movements.
Coinfomania4h ago