
Key Takeaways
-
Virtuals Protocol (VIRTUAL) is holding around 20% monthly gains despite short-term market weakness.
-
The 4H chart shows a developing inverse head and shoulders pattern, a classic bullish reversal structure.
-
Price recently faced rejection near the $0.85 neckline, suggesting the right shoulder is still forming.
-
A potential dip toward the $0.78 support zone could complete the pattern and attract buyers.
-
A confirmed breakout above $0.85 may open the door for a stronger upside move, while losing $0.78 could delay the bullish setup.
Virtuals Protocol (VIRTUAL), the native token of the decentralized infrastructure and launchpad powering autonomous AI agents, has been holding up relatively well despite recent market-wide hesitation. The token is still sitting on around 20% monthly gains, although it is trading slightly in the red today in line with broader crypto sentiment.
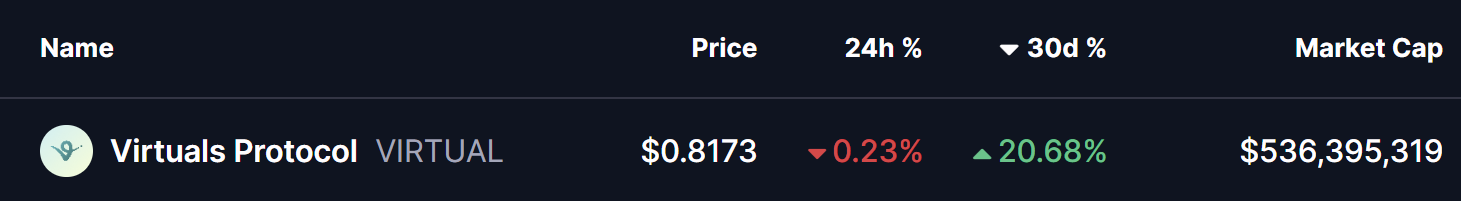
Source: Coinmarketcap
However, when you zoom into the chart, the price action tells a more interesting story. Beneath the short-term weakness, VIRTUAL appears to be building a classic bullish reversal structure, one that could act as the base for a stronger upside move if confirmed.
Inverse Head and Shoulders Pattern Takes Shape
On the 4-hour timeframe, VIRTUAL has carved out a clear inverse head and shoulders pattern, a formation often associated with trend reversals after a prolonged pullback.
-
The left shoulder developed near the $0.80 zone, where buyers initially stepped in.
-
This was followed by a deeper decline toward $0.75, forming the head of the structure and marking the local low.
-
Price then rebounded toward the descending neckline resistance around $0.85, where it faced rejection once again.
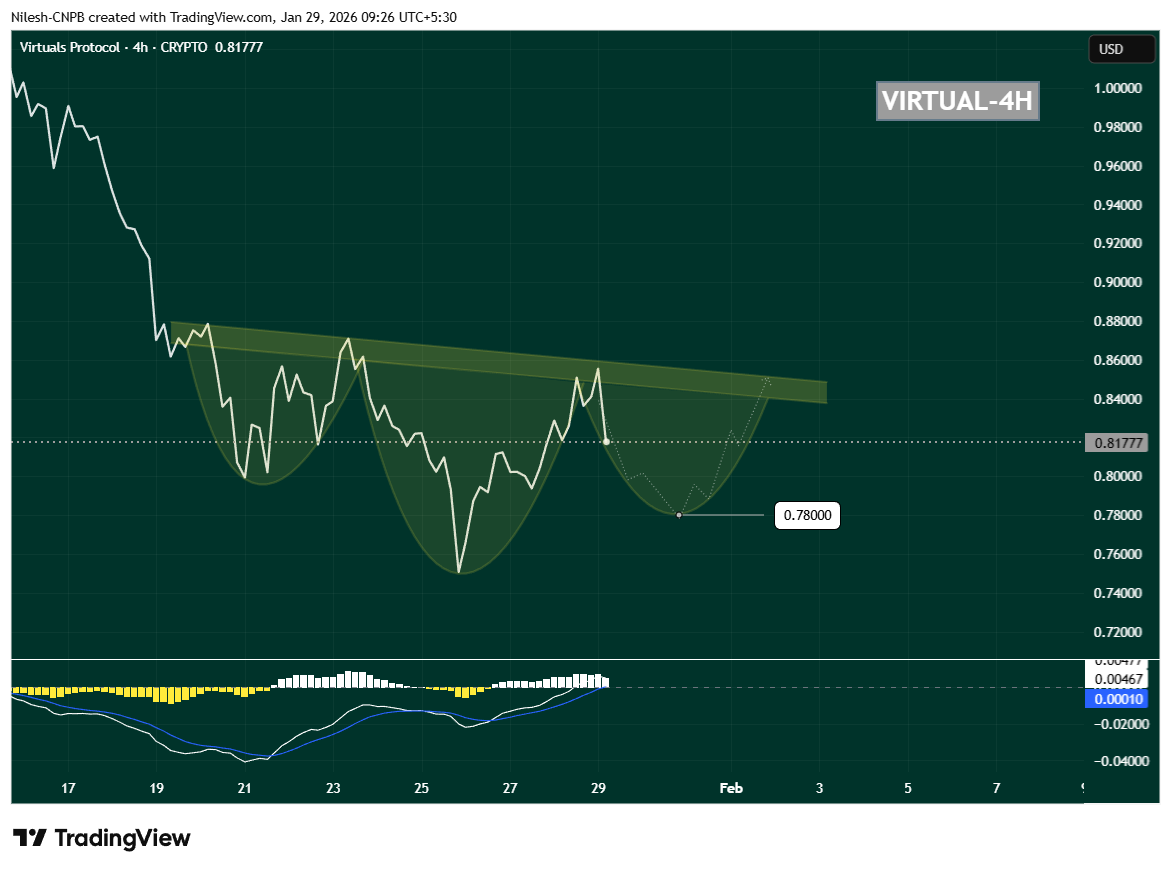
VIRTUAL 4H Chart/Coinsprobe (Source: Tradingview)
Following this rejection, VIRTUAL has started to drift lower and is currently trading near $0.8177, suggesting that the right shoulder may still be forming. This behavior fits well with the textbook structure of the pattern and keeps the bullish setup technically valid for now.
Momentum Signals Support the Setup
Momentum indicators are also worth watching closely. On the same timeframe, the MACD is cooling off and curling downward, reflecting short-term weakness rather than a full trend breakdown. In many cases, this kind of MACD reset during right-shoulder formation actually helps fuel the next impulsive move higher once buyers regain control.
As long as selling pressure remains controlled and price avoids a sharp breakdown, this momentum reset can work in favor of the bulls.
What’s Next for VIRTUAL?
If the pattern continues to play out, VIRTUAL could dip toward the $0.78 region, which aligns well with the projected right-shoulder bottom visible on the chart. This zone may act as a critical demand area where buyers look to step back in.
A strong bounce from this region, followed by renewed buying pressure, would increase the probability of a bullish breakout attempt toward the $0.85 neckline. A clean move above this resistance would confirm the inverse head and shoulders pattern and signal a potential shift back into a short-term uptrend.
On the downside, losing the $0.78 support decisively would weaken the structure and delay the bullish thesis, potentially opening the door for deeper consolidation.
For now, VIRTUAL is at a key technical crossroads. The structure remains constructive, the pattern is intact, and the chart suggests that the next major move—up or down—could arrive once this right shoulder finishes forming. Traders will be watching closely how price reacts around support in the coming sessions.
Disclaimer: The views and analysis presented in this article are for informational purposes only and reflect the author’s perspective, not financial advice. Technical patterns and indicators discussed are subject to market volatility and may or may not yield the anticipated results. Investors are advised to exercise caution, conduct independent research, and make decisions aligned with their individual risk tolerance.
About Author: Nilesh Hembade is the Founder and Lead Author of Coinsprobe, with over 5 years of experience in the cryptocurrency and blockchain industry. Since launching Coinsprobe in 2023, he has been providing daily, research-driven insights through in-depth market analysis, on-chain data, and technical research.
Disclaimer: The information on this page may come from third parties and does not represent the views or opinions of Gate. The content displayed on this page is for reference only and does not constitute any financial, investment, or legal advice. Gate does not guarantee the accuracy or completeness of the information and shall not be liable for any losses arising from the use of this information. Virtual asset investments carry high risks and are subject to significant price volatility. You may lose all of your invested principal. Please fully understand the relevant risks and make prudent decisions based on your own financial situation and risk tolerance. For details, please refer to
Disclaimer.
Related Articles
Bitcoin challenges 75K, Nvidia GTC drives AI token rally
Amid oil price declines, stock markets rebounded, and cryptocurrency market sentiment recovered to neutral levels. Bitcoin touched $74,899, challenging the 75K level. Nvidia's GTC conference drove significant gains in AI-related tokens, with the overall market showing positive momentum.
ChainNewsAbmedia26m ago
ETH Short-term Decline of 0.72%: Sell-side Dominance and Fund Outflow Intensify Risk-off Sentiment
2026-03-16 22:15至22:30(UTC),ETH价格在2355.0至2377.16 USDT区间快速下行,15分钟内收益率为-0.72%,振幅达0.93%。这一波动引发市场关注,交易量与链上活跃度均显著提升,短线波动加剧,情绪趋于谨慎。
本次异动的主要驱动力是急速上涨的卖出交易量与资金流出。ETH主网交易量较此前一小时均值大幅提升18.4%,买卖订单结构发生转变,卖出订单占比跃升至
GateNews1h ago
Michael Saylor Warns Quantum Threat Would Break the Internet - U.Today
Michael Saylor argues that quantum computing poses a universal risk beyond Bitcoin, threatening critical global infrastructure. In response to Chamath Palihapitiya's views on AI and market disruptions, Saylor insists that a transition to Post-Quantum Cryptography will protect Bitcoin and other systems together, emphasizing its resilience as "Digital Capital."
UToday2h ago
Analyst Says Bitcoin Indicators Show Early Signs of Market Recovery
Stablecoin liquidity rose by ~$8B since February, signaling potential improved market trading conditions.
Inter-exchange Flow Pulse turned positive, indicating more Bitcoin moving to derivatives platforms.
Long-term holders retain ~79% of supply, showing gradual supply transfers
CryptoFrontNews3h ago
Bitcoin Surges Above $74K After Rally From $60K Support Level
Bitcoin surged from $60K to nearly $74K, gaining 23% as buyers maintained momentum, indicated by a positive RSI and MACD. Key resistance lies at $74K, with support levels at $72.8K, $71.5K, and $70K. Traders anticipate potential further gains.
CryptoFrontNews3h ago
Here’s the Polkadot Price if the Next Upgrade Triggers a DOT Comeback
Polkadot is doing well in the crypto market right now. The DOT price is going up. People are getting interested in it again. Polkadot is one of the performing cryptos in the recent market turnaround.
On March 16, the DOT price saw a sudden increase of 8.5%, making it one of the top
CaptainAltcoin4h ago
