Cardano price continues to rise, but the familiar scenario repeats itself. Since January 20, ADA has increased by about 7%, at one point surpassing higher levels but then quickly stalling around the $0.35 mark. This is not a trend breakout; rather, it’s just a brief rebound lacking the momentum to sustain the upward movement.
There are three main reasons explaining why Cardano’s rallies keep failing, resulting in the market environment still lacking significant positive changes.
Weak Bullish Divergence Only Leads to Short-Term Rebound
The latest surge of ADA was triggered by a hidden bullish divergence signal on the 12-hour chart. From late December to January 20, ADA’s lows were higher, while the RSI indicator formed lower but very shallow lows.
This indicates that selling pressure has eased slightly, but it doesn’t necessarily mean buying pressure has taken control of the market. Such divergence usually only results in short-term recoveries rather than establishing a sustainable uptrend.
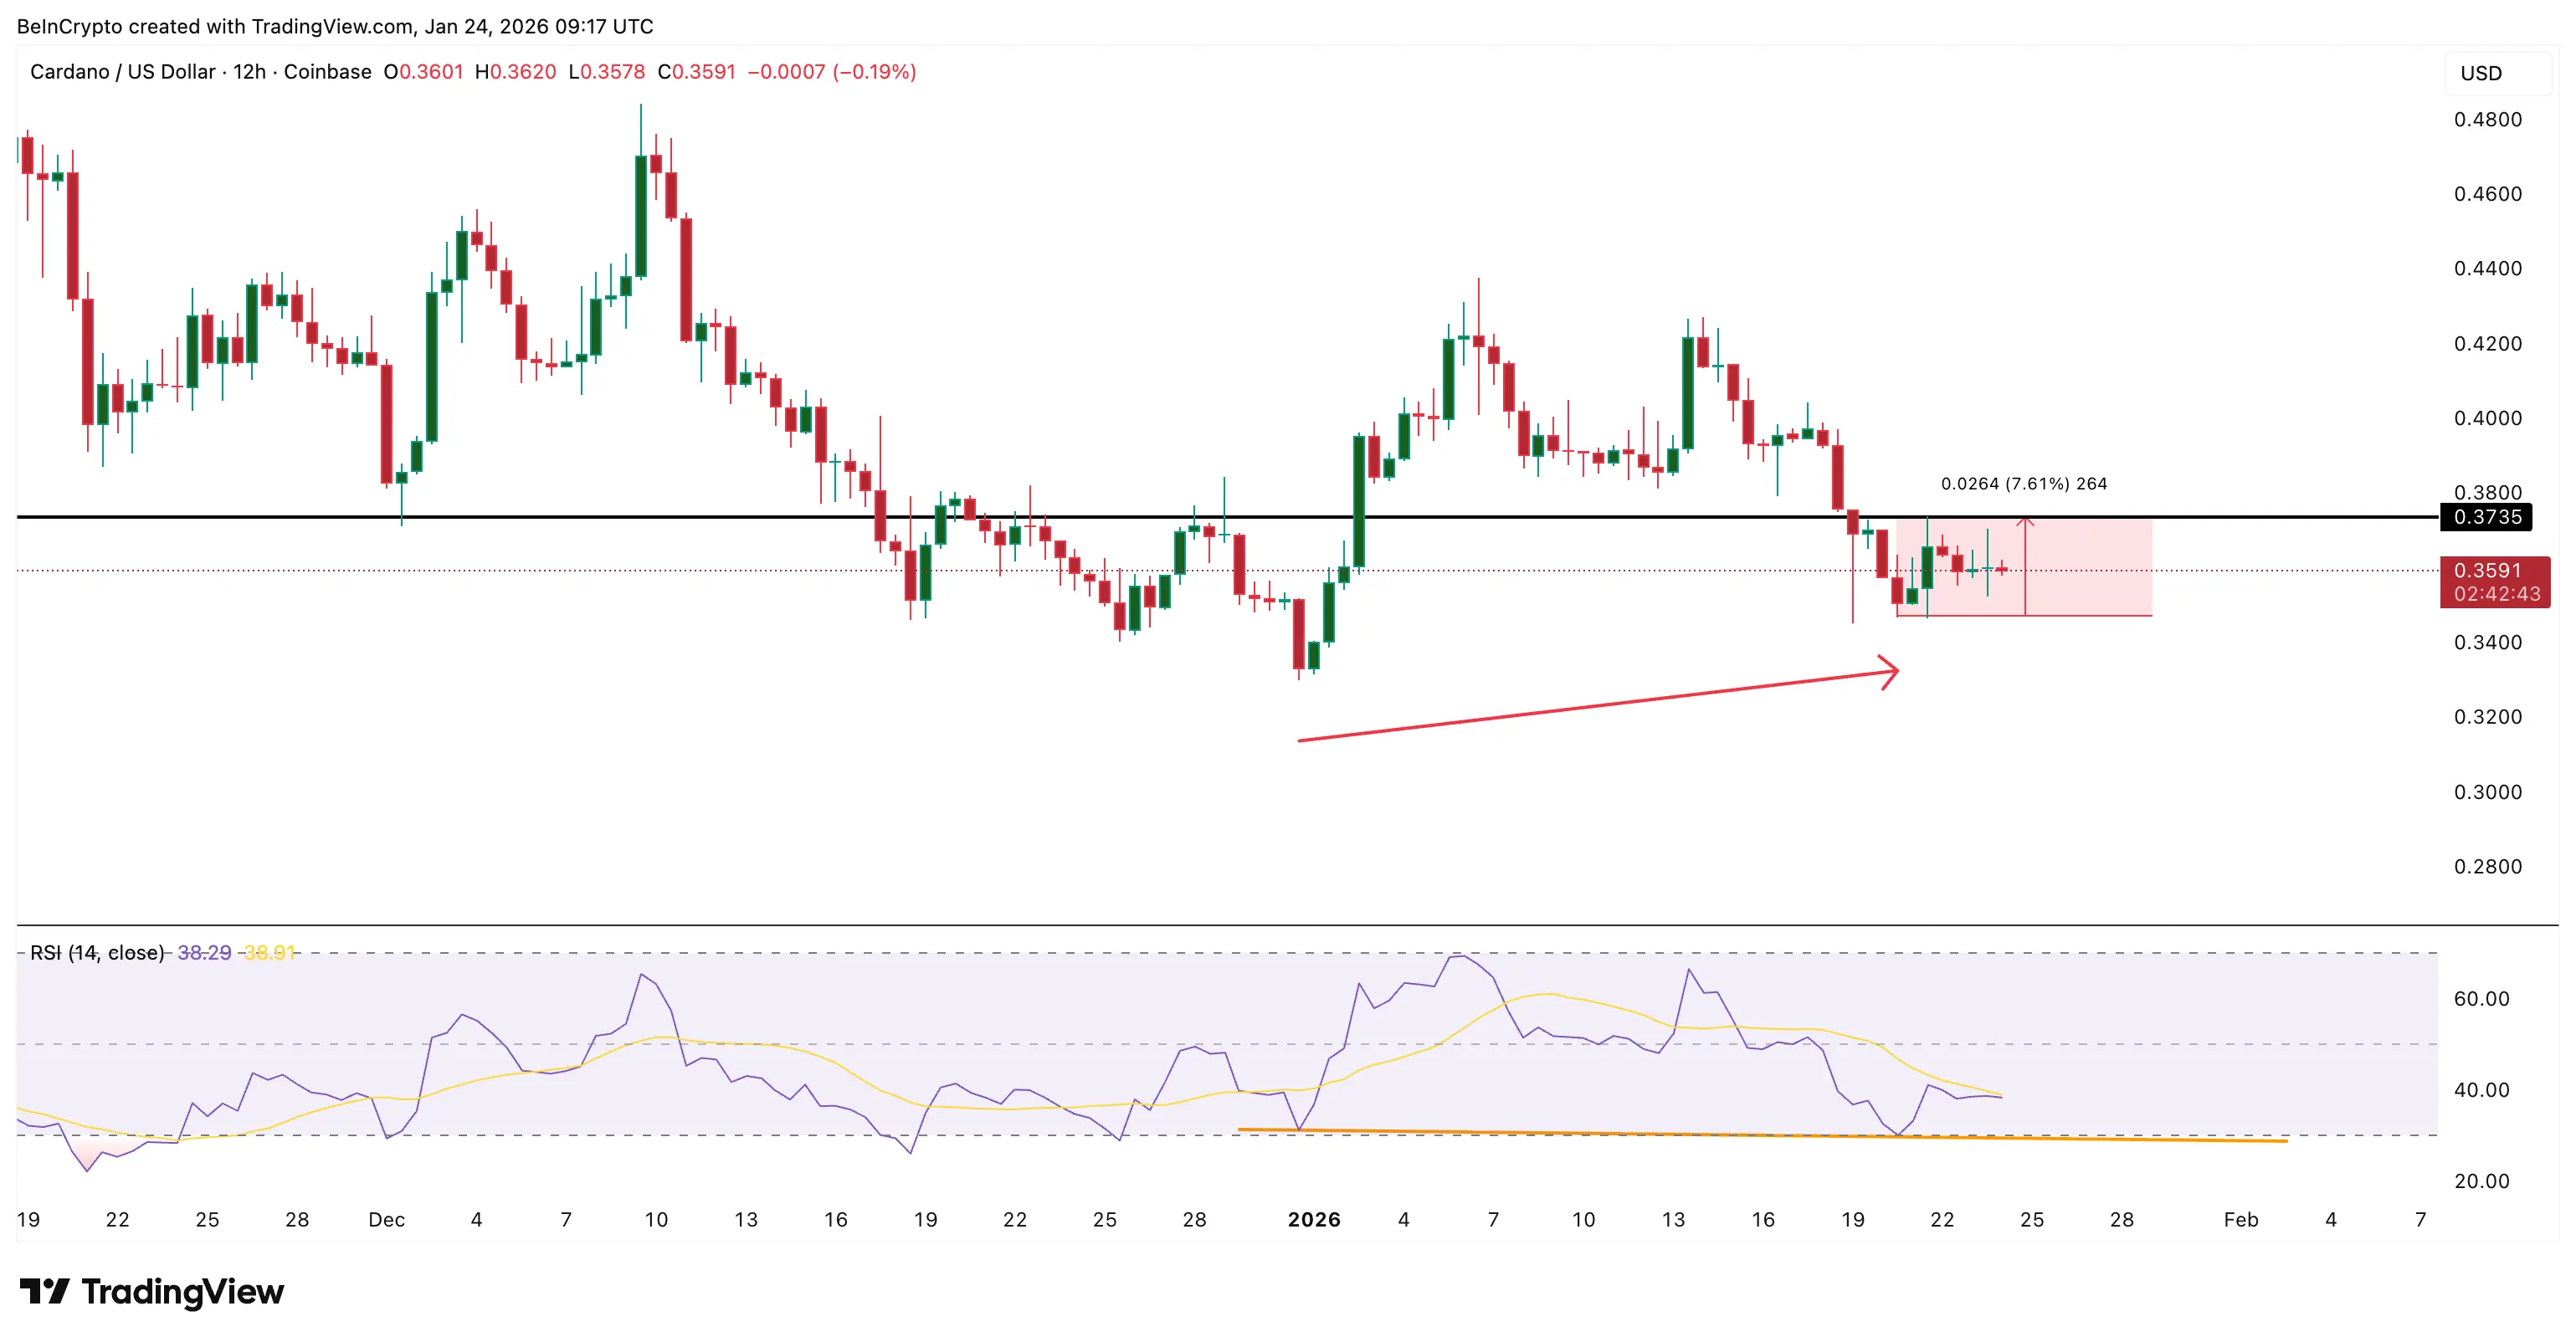 Weak Divergence | Source: TradingView
In reality, this was proven true: Cardano’s price increased about 7% to $0.37 on January 21, but the rally quickly stalled.
Weak Divergence | Source: TradingView
In reality, this was proven true: Cardano’s price increased about 7% to $0.37 on January 21, but the rally quickly stalled.
This period also coincided with the Cardano development activity index reaching a peak of 6.94—the highest in a month. Development activity often underpins confidence in the price, and in mid-January, ADA’s local peak appeared right after development activity hit its high.
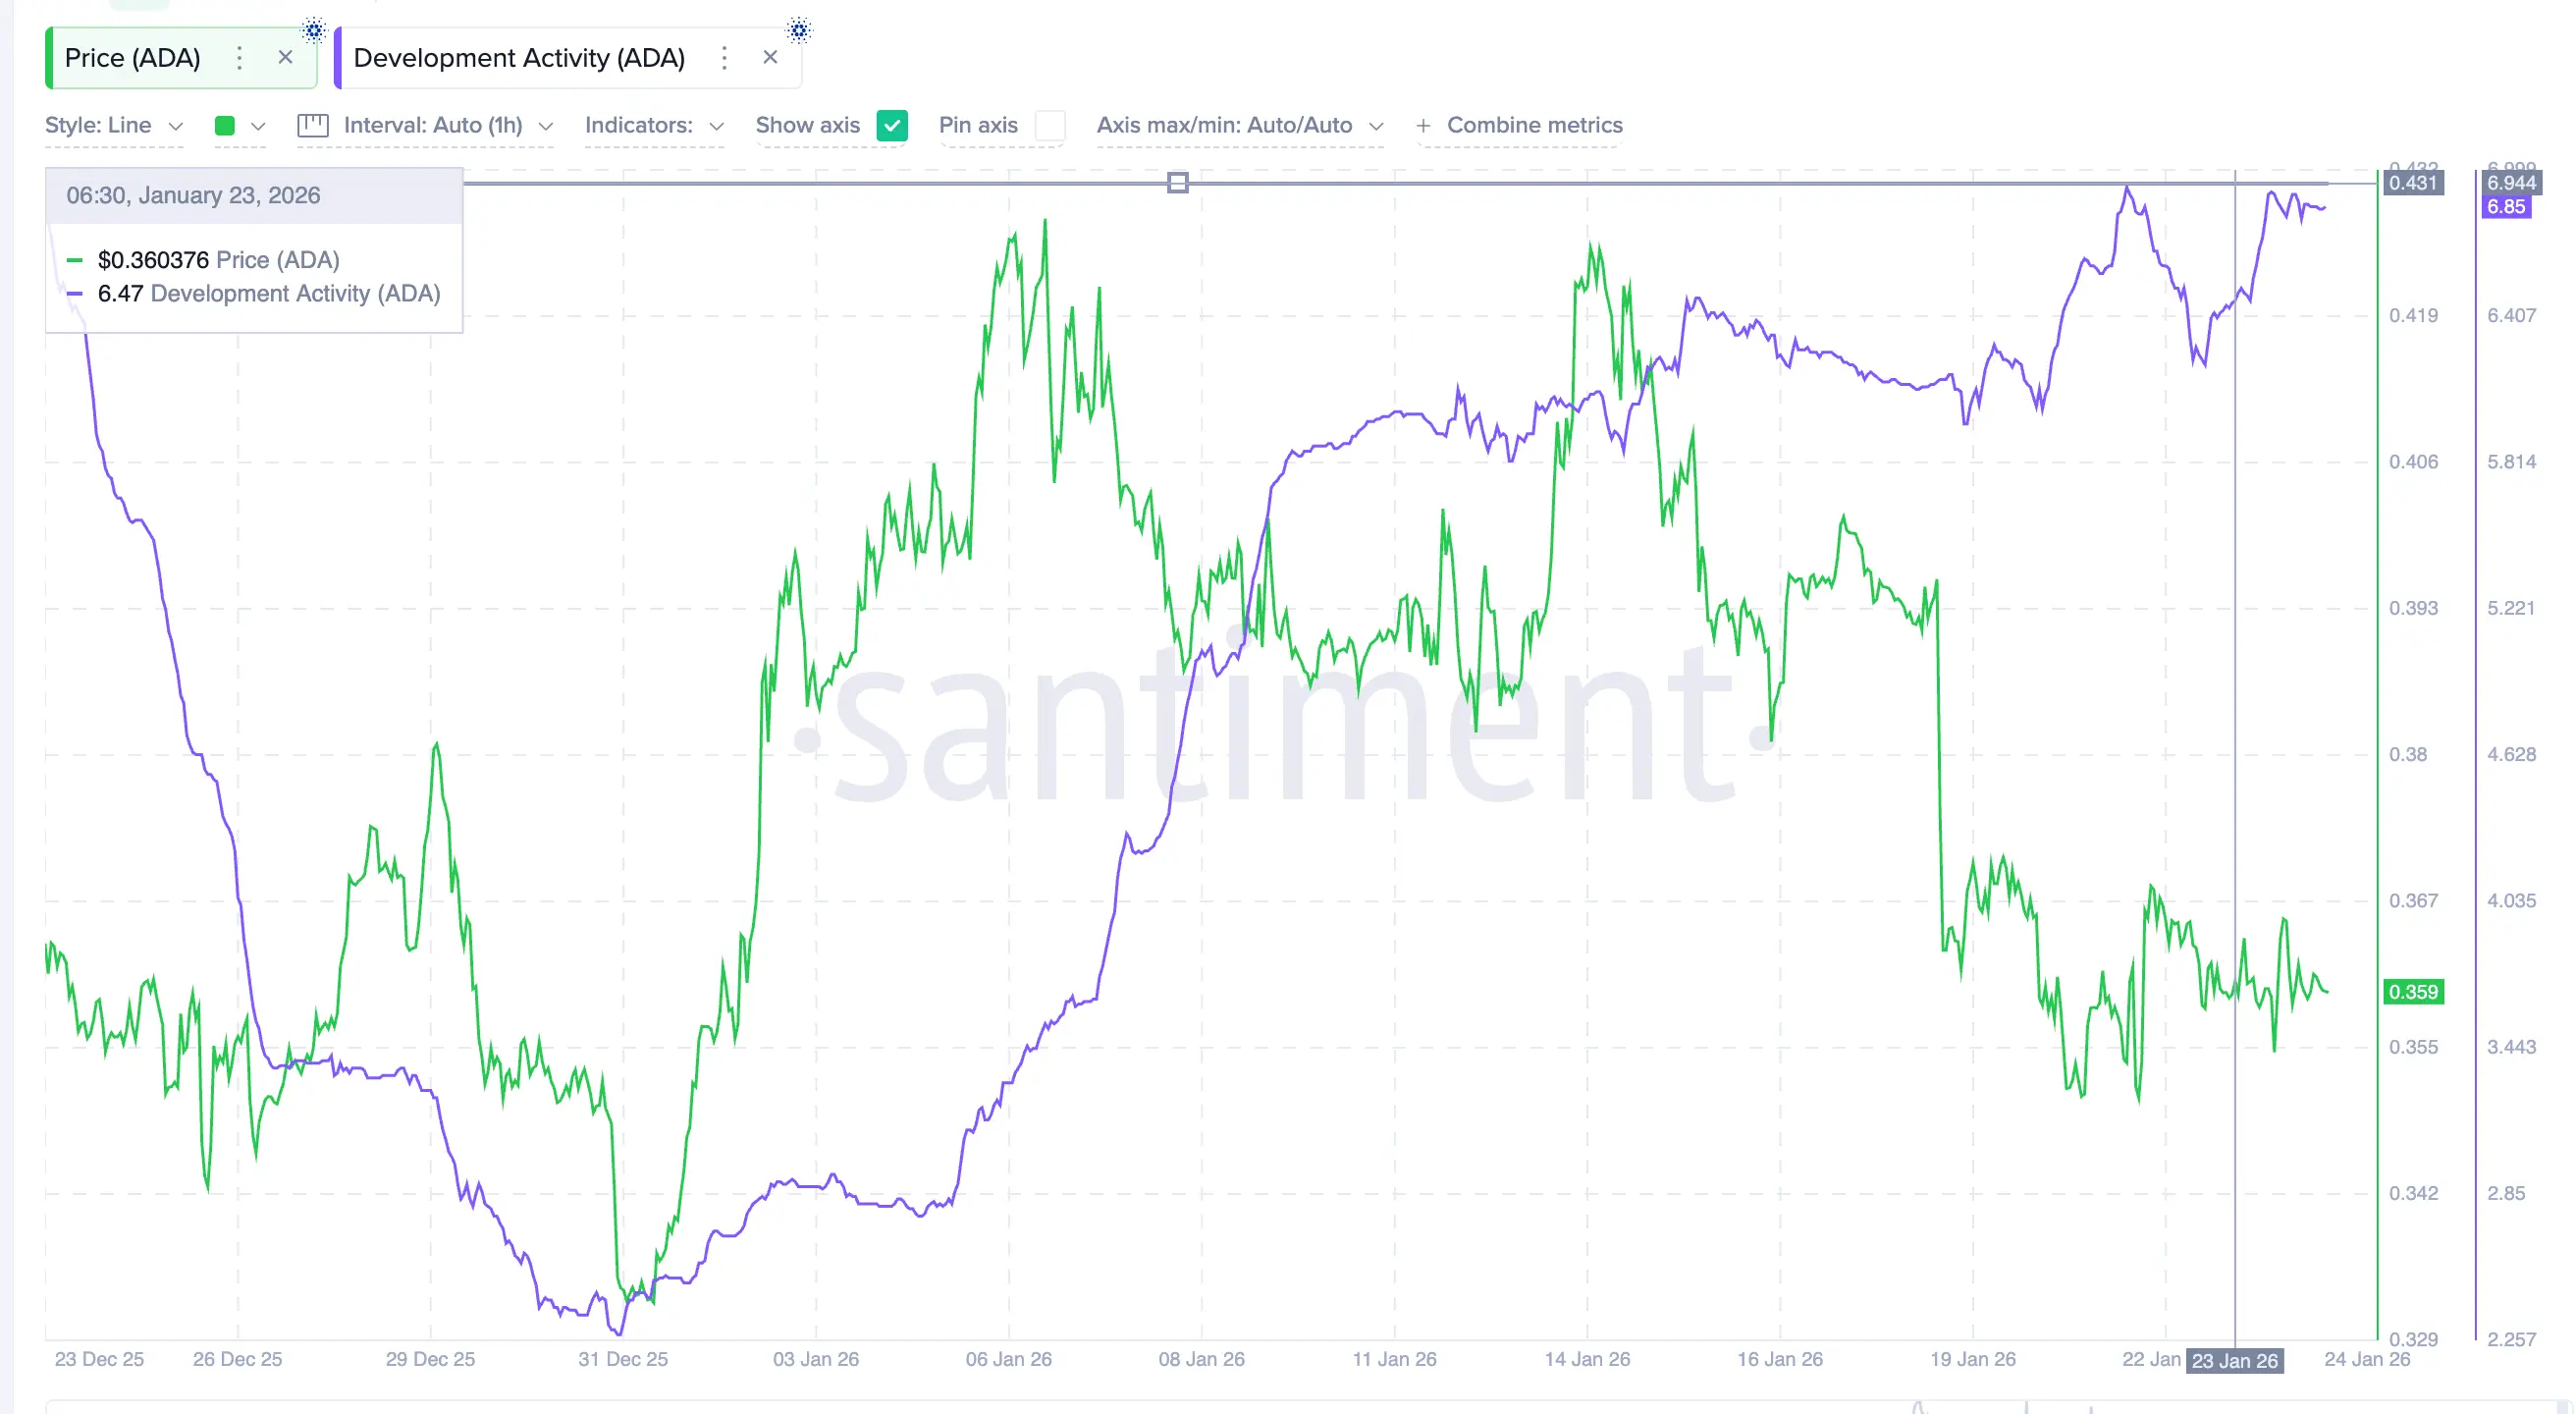 Development activity peaks then declines | Source: Santiment
However, this support didn’t last. When development activity declines, the price also adjusts quickly. Currently, the index has recovered to 6.85 but still hasn’t surpassed the monthly high. The hidden bullish divergence helped prevent a sell-off but hasn’t generated enough demand to sustain the rally when development activity stalls.
Development activity peaks then declines | Source: Santiment
However, this support didn’t last. When development activity declines, the price also adjusts quickly. Currently, the index has recovered to 6.85 but still hasn’t surpassed the monthly high. The hidden bullish divergence helped prevent a sell-off but hasn’t generated enough demand to sustain the rally when development activity stalls.
Profit-taking pressure intensifies with each ADA rebound
A bigger challenge lies in market behavior after each ADA price increase.
The “spent coins age band” indicator shows the movement of coins across all age groups. An increasing indicator value usually means investors are selling and taking profits. Over the past month, each ADA rebound has been accompanied by a sharp increase in profit-taking activity.
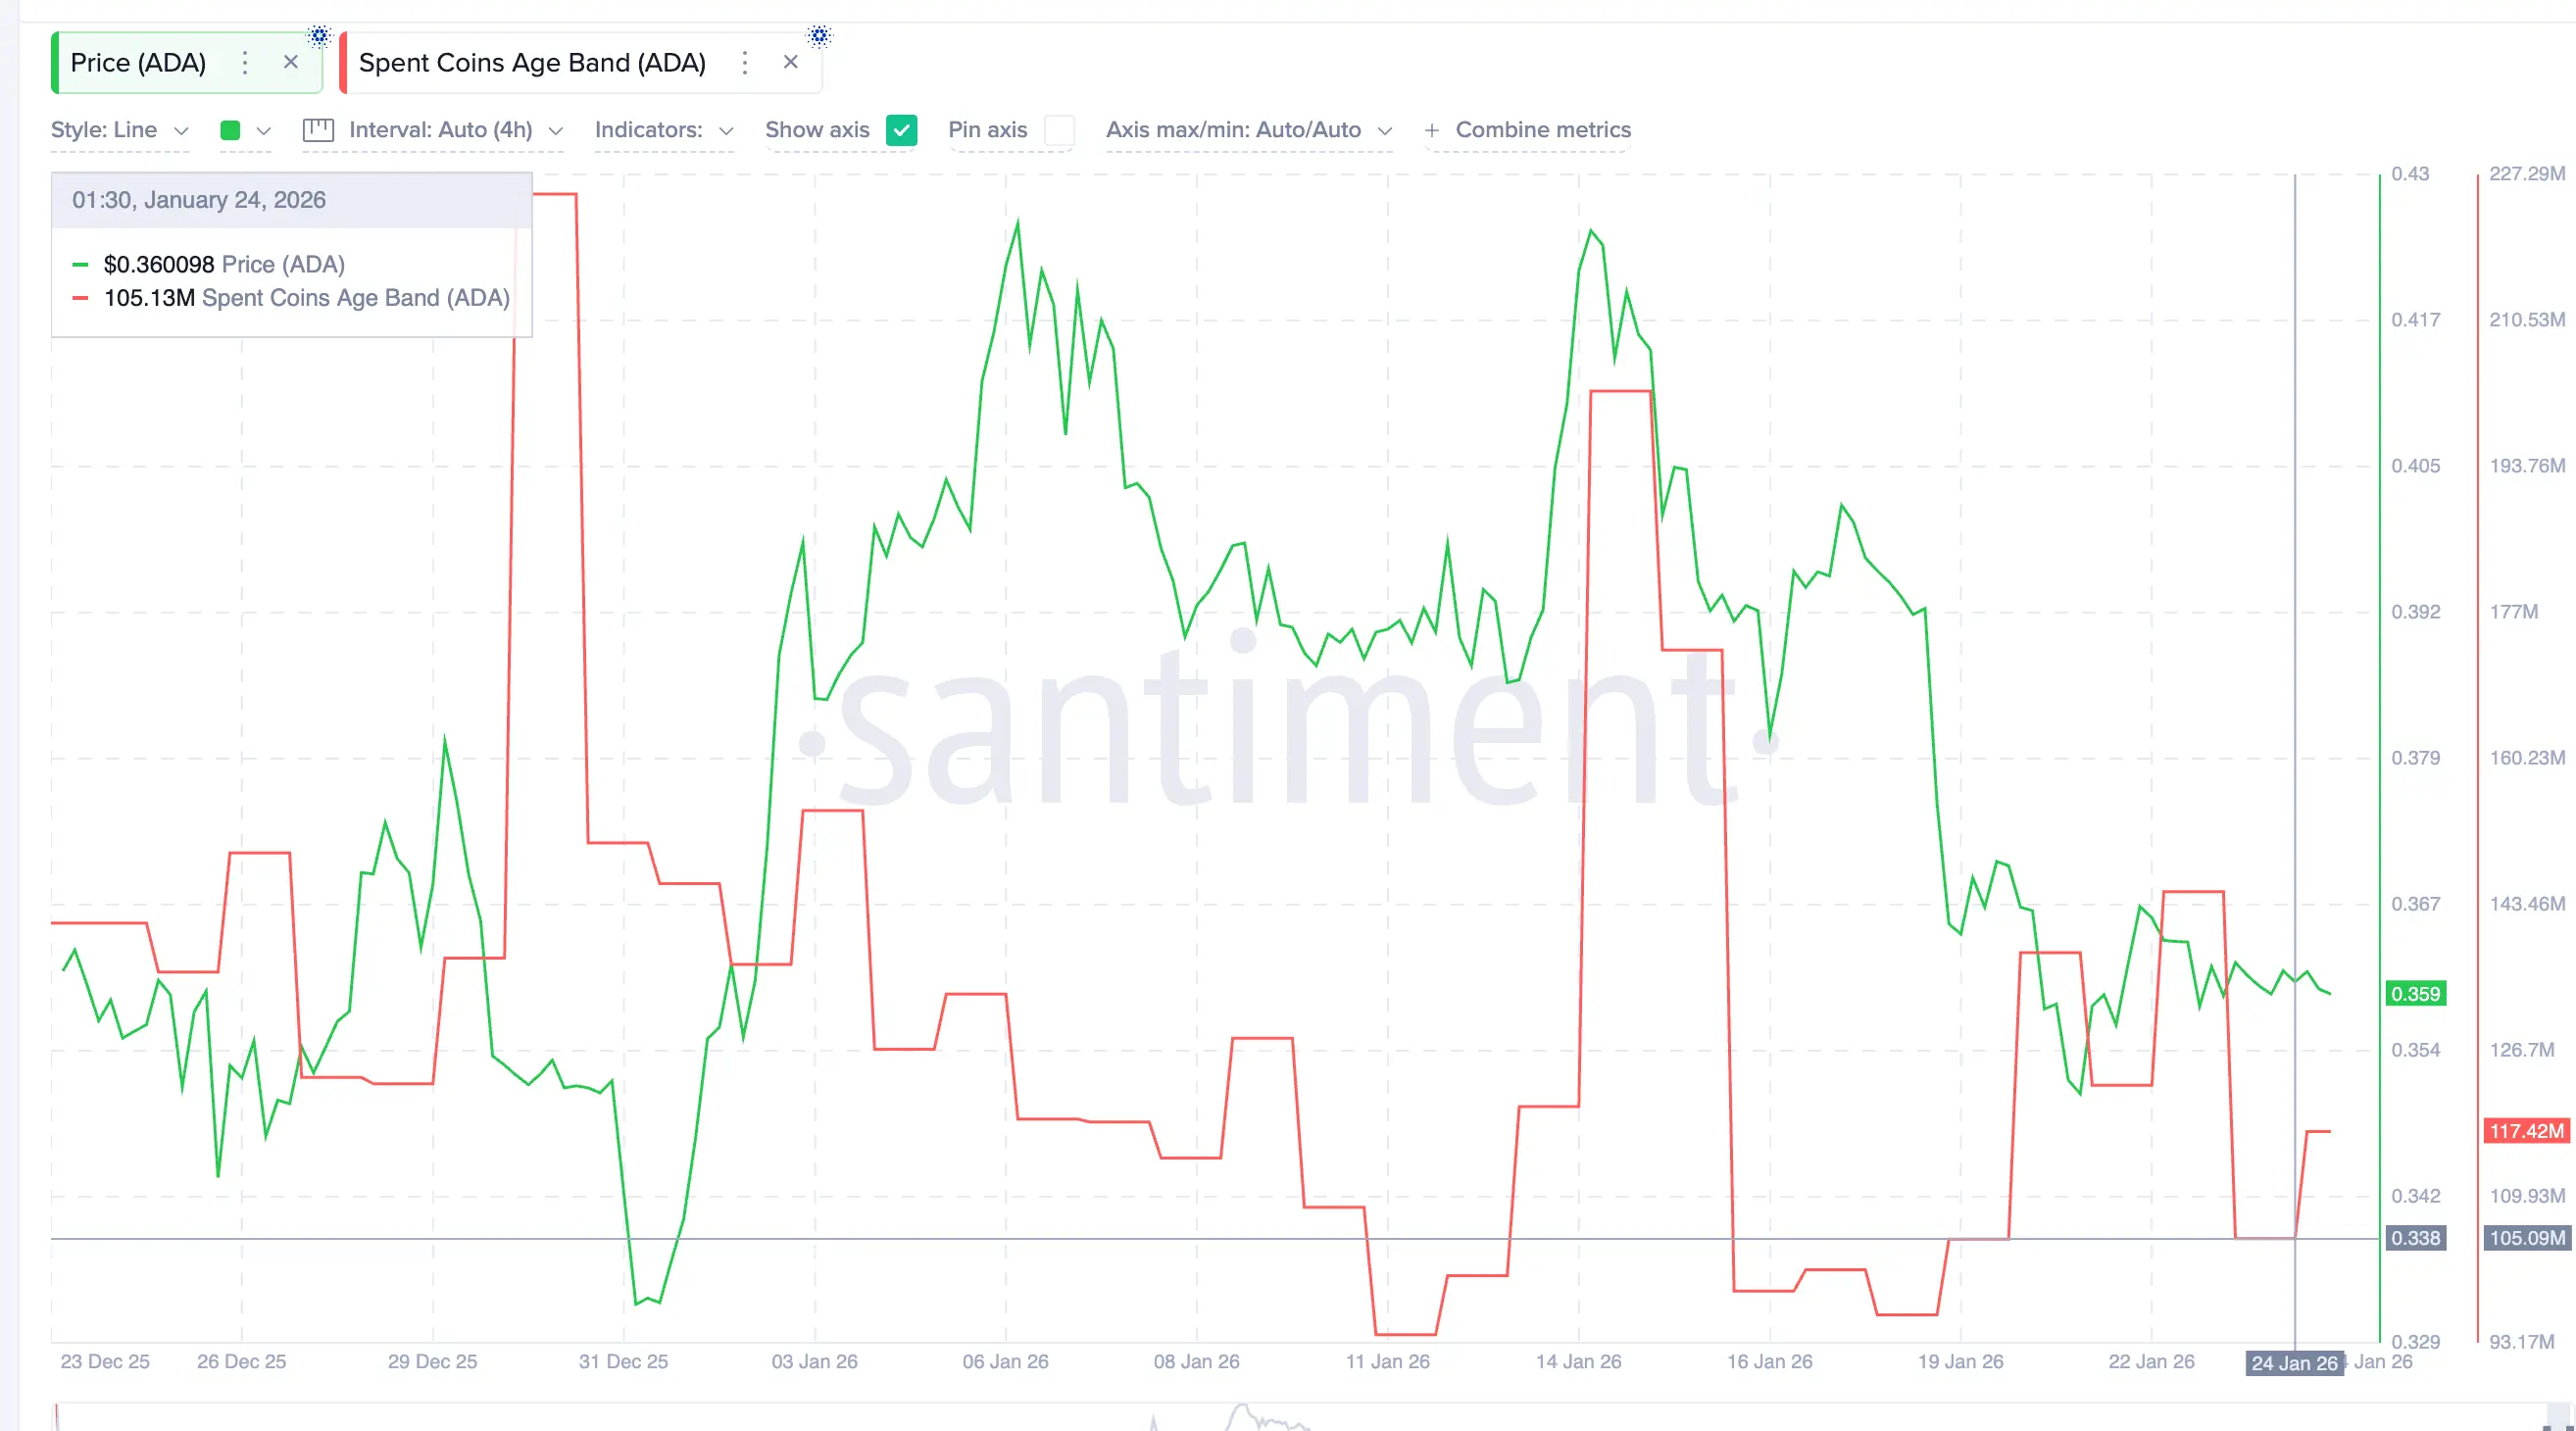 Trading activity peaks | Source: Santiment
At the end of December, Cardano’s price rose about 12%, while coin consumption activity increased over 80%, reflecting strong selling pressure during price rises. By mid-January, ADA gained another 10%, with coin consumption activity nearly doubling, indicating investors are continuously riding the wave to exit their positions.
Trading activity peaks | Source: Santiment
At the end of December, Cardano’s price rose about 12%, while coin consumption activity increased over 80%, reflecting strong selling pressure during price rises. By mid-January, ADA gained another 10%, with coin consumption activity nearly doubling, indicating investors are continuously riding the wave to exit their positions.
This pattern is repeating. Since January 24, coin consumption activity has increased by over 11%, from 105 million to 117 million, even though ADA’s price has not yet broken resistance levels. This suggests sellers are proactively preparing for the next correction rather than waiting for clear confirmation signals.
Therefore, the upward momentum is weakening, as each rebound is met with stronger profit-taking pressure “ahead of” the rally than the previous one.
Whales reduce exposure, no longer absorbing selling pressure
Typically, large wallets (whales) act as absorbers of selling pressure, helping stabilize the price. However, currently, they are reducing their exposure to ADA.
Wallets holding from 10 million ADA to 100 million ADA have decreased their total holdings from 13.64 billion to 13.62 billion ADA, a reduction of about 20 million ADA since January 21. From January 22, wallets holding from 1 million ADA to 10 million ADA also decreased from 5.61 billion ADA to 5.60 billion ADA, nearly 10 million ADA less.
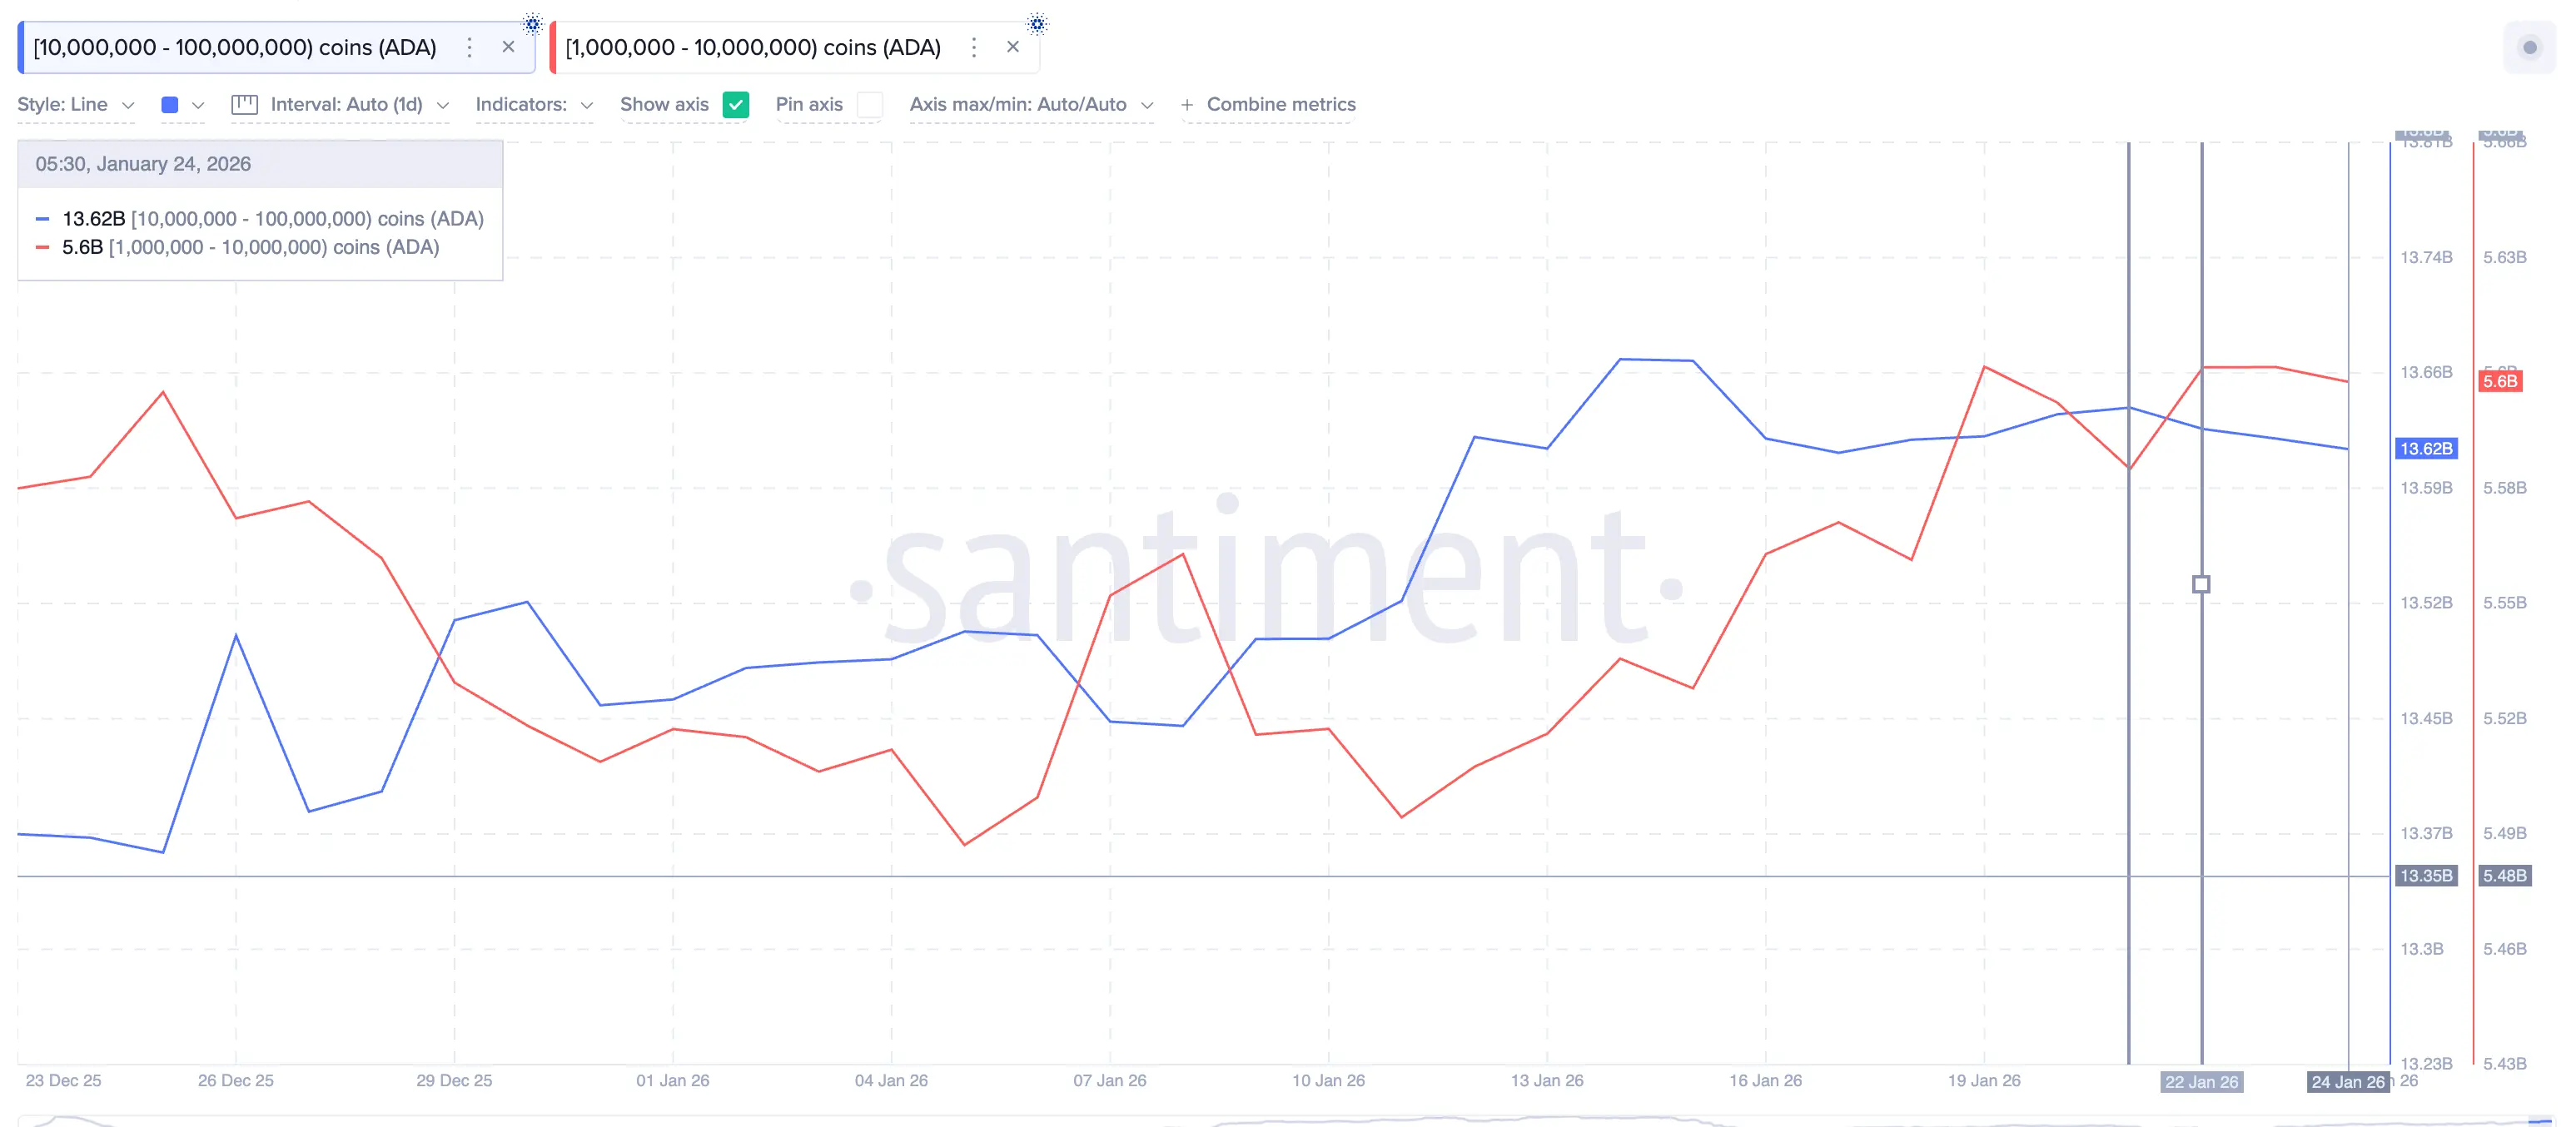 ADA whales | Source: Santiment
This isn’t panic selling, but it clearly indicates a downward trend. The lack of whale buying means selling pressure isn’t being absorbed, making the price more vulnerable to sharp corrections.
ADA whales | Source: Santiment
This isn’t panic selling, but it clearly indicates a downward trend. The lack of whale buying means selling pressure isn’t being absorbed, making the price more vulnerable to sharp corrections.
Derivatives data also supports this view. In the next 7 days, short liquidations are expected to reach $107.6 million, significantly higher than long positions at $70.1 million. Shorts exceed longs by over 50%, reflecting market sentiment expecting failed rallies rather than sustained increases.
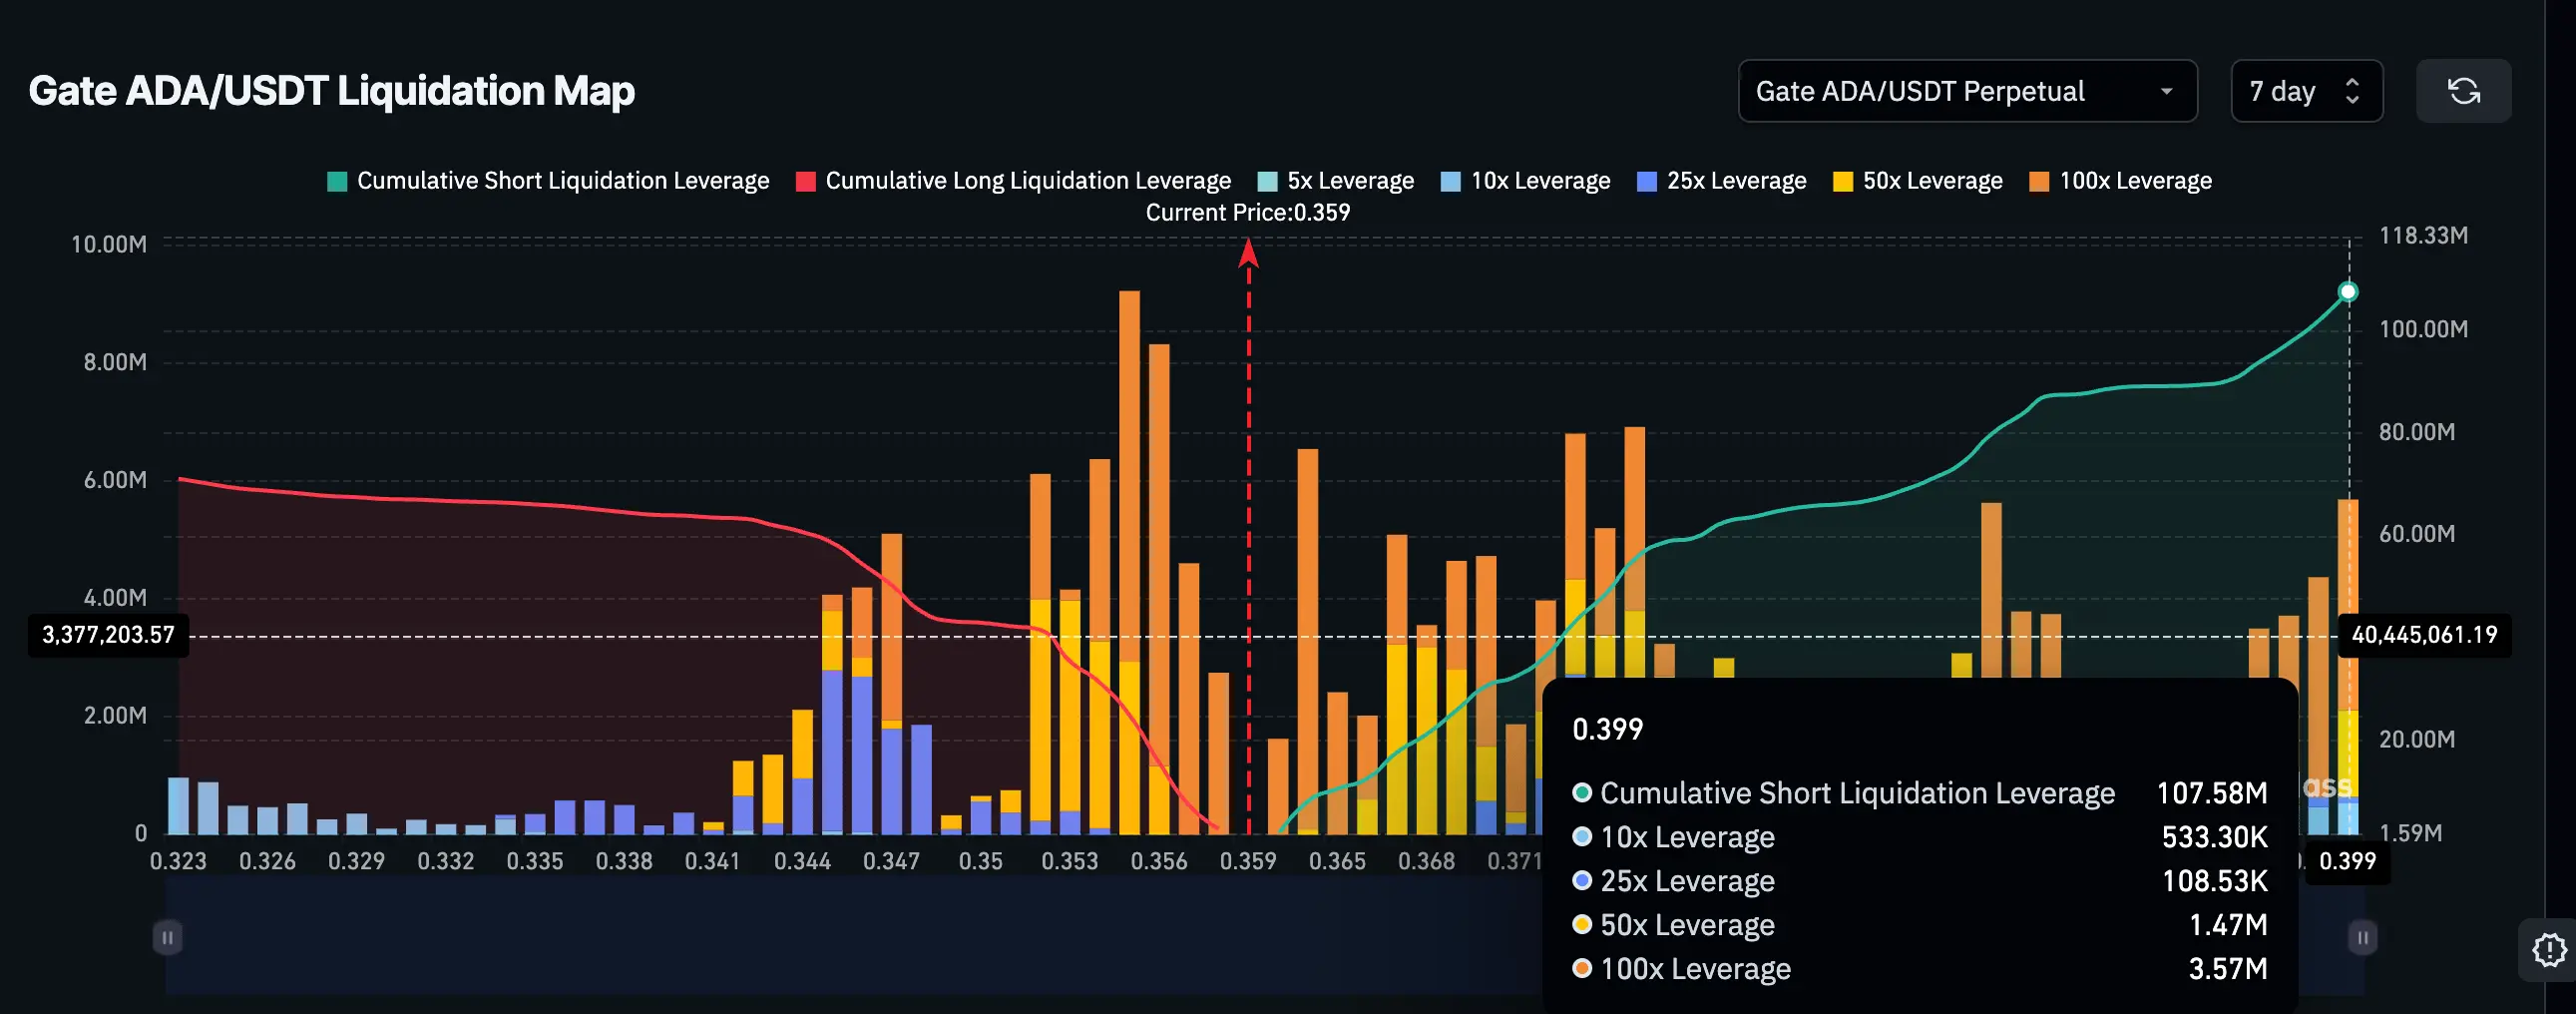 Liquidation map | Source: Coinglass
This imbalance suggests that if Cardano attempts to rally again, selling pressure could return very quickly, especially around resistance zones.
Liquidation map | Source: Coinglass
This imbalance suggests that if Cardano attempts to rally again, selling pressure could return very quickly, especially around resistance zones.
Key price levels that will determine Cardano’s next trend
The current price structure makes it easier for investors to identify key levels:
To break free from this repeating cycle, three conditions must be met: development activity must recover and stay above recent highs; coin consumption activity should slow down rather than spike during rebounds; and whales must return to net buying.
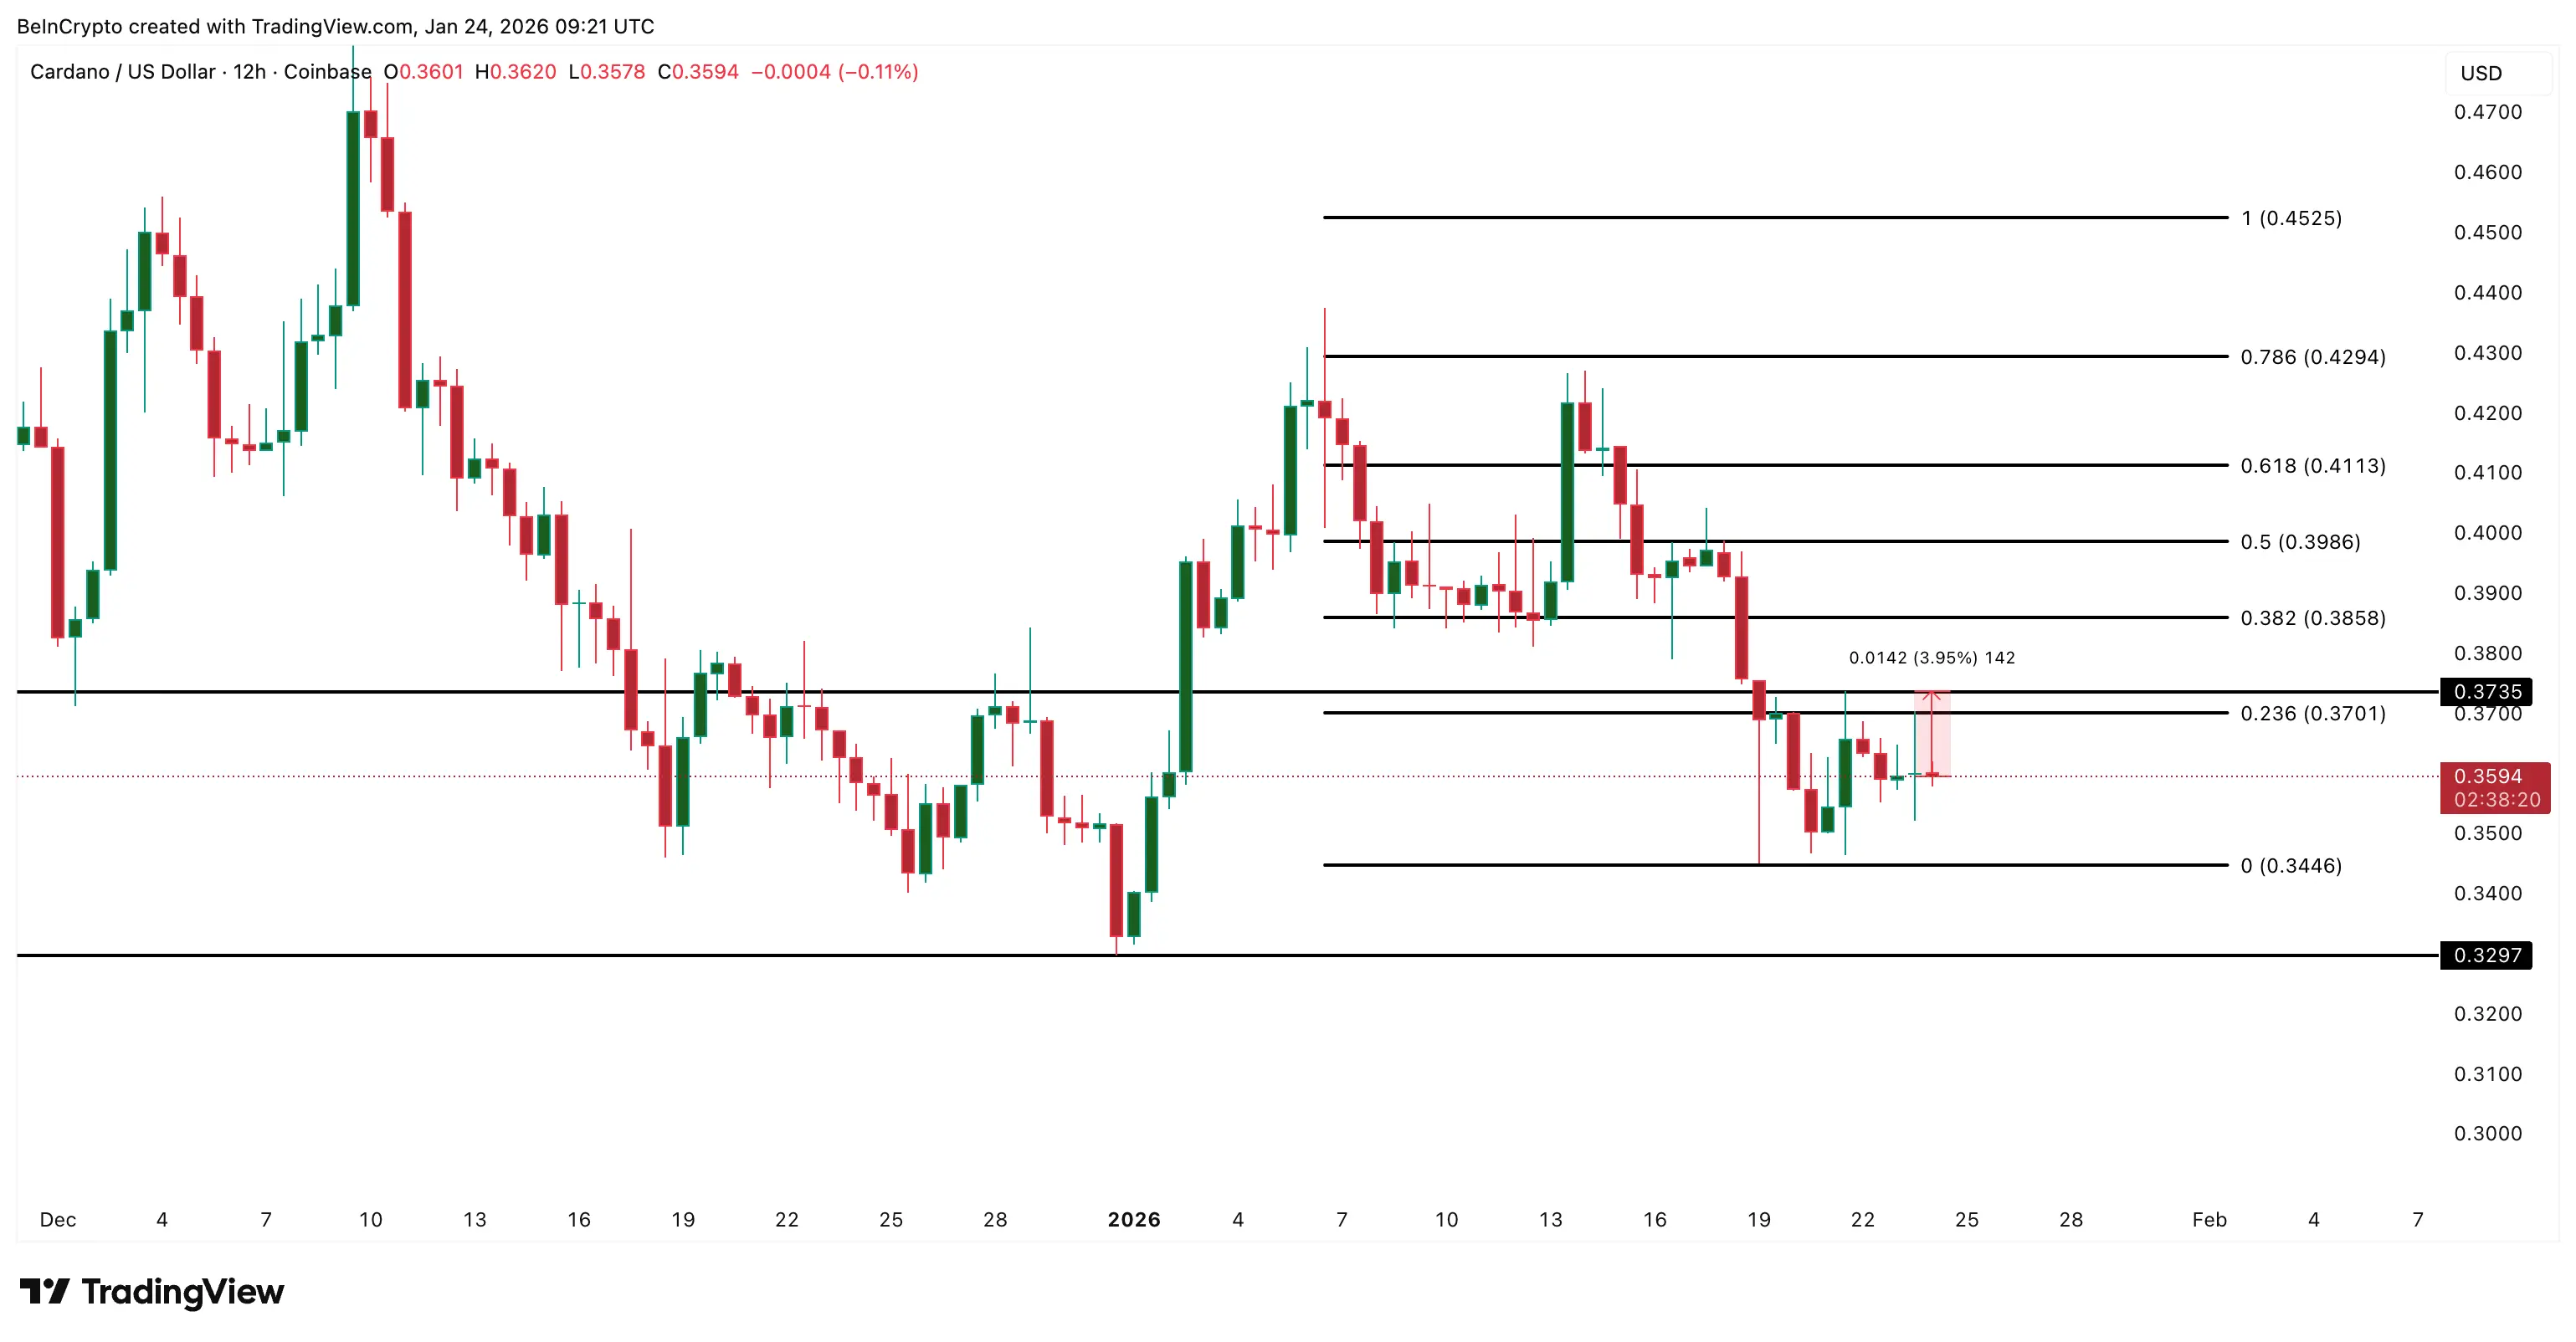 Cardano price analysis | Source: TradingView
Until these conditions are fulfilled, Cardano’s rebounds will remain vulnerable to selling pressure.
Cardano price analysis | Source: TradingView
Until these conditions are fulfilled, Cardano’s rebounds will remain vulnerable to selling pressure.
Disclaimer: The information on this page may come from third parties and does not represent the views or opinions of Gate. The content displayed on this page is for reference only and does not constitute any financial, investment, or legal advice. Gate does not guarantee the accuracy or completeness of the information and shall not be liable for any losses arising from the use of this information. Virtual asset investments carry high risks and are subject to significant price volatility. You may lose all of your invested principal. Please fully understand the relevant risks and make prudent decisions based on your own financial situation and risk tolerance. For details, please refer to
Disclaimer.
Related Articles
Is there hidden risk behind Bitcoin holding steady at $70,000? Two major indicators weaken, reducing upward momentum.
Amid increasing geopolitical conflicts and macroeconomic uncertainties, Bitcoin remains steady at $70,000, demonstrating resilience. However, the decline in CEX premiums and slowing ETF capital flows indicate that institutional investors are becoming more cautious, and the market may enter a period of consolidation.
GateNews5m ago
Nick Carter: Bitcoin's quantum resistance lags behind; Ethereum may lead a bullish divergence
Nick Carter warns that Bitcoin is lagging in quantum resistance, emphasizing that its use of elliptic curve cryptography will become outdated and recommending a redesign of replaceable encryption technologies. In contrast, Ethereum has developed a post-quantum upgrade roadmap through 2029 and considers it a top priority. Google also predicts that quantum threats will become a reality before 2029, posing a risk to blockchain security.
MarketWhisper8m ago
Crypto Fear & Greed Index drops to 10, market "fear" sentiment rises
BlockBeats News, March 26 — According to Alternative data, today’s cryptocurrency Fear and Greed Index is 10 (yesterday was 14), indicating increased market "fear" sentiment.
Note: The Fear and Greed Index threshold is 0-100, composed of indicators: volatility (25%), market trading volume (25%), social media activity (15%), market surveys (15%), Bitcoin’s proportion in the overall market (10%), and Google trending searches analysis (10%).
BlockBeatNews10m ago
Pi coin's 7-month low-volatility period has ended; an 108% rebound in volatility signals a major market move.
Pi Network (PI) is currently trading at approximately $0.1883, facing increased volatility and a decreasing correlation with Bitcoin. Recently, volatility has risen from 52% to 108%, indicating the end of the past seven months of compression and the potential for a significant move. However, the correlation coefficient between PI and Bitcoin has dropped to -0.30, suggesting that PI has not benefited from Bitcoin's upward trend. Technical analysis shows that if the price falls below $0.1894, it could drop to $0.1300, while holding above $0.2103 may lead to a rebound toward $0.2442.
MarketWhisper33m ago
The Futarchy of Privacy: Umbra's Fit in a Private Crypto World
The essay discusses the need for "Verifiable Privacy" in professional trading, highlighting Umbra's unique technical approach and performance-based tokenomics. It notes the privacy sector’s strong growth and upcoming catalysts for Umbra’s expansion.
CoinDesk40m ago
Bitcoin Consolidating, Is It Time to Enter? K33: Selling Pressure Easing, Bottom Signals Emerging
Bitcoin is oscillating between $60,000 and $75,000, with research firm K33 noting that selling pressure is subsiding and may signal a bottom formation. Long-term holders are maintaining their positions, and coupled with recent ETF fund inflows, the market may gradually improve. Despite economic uncertainty affecting short-term performance, the overall pattern is trending toward stabilization, and long-term investors can anticipate attractive entry opportunities.
区块客47m ago
