
**Date: **Tue, Jan 06, 2026 | 11:20 AM GMT
The broader cryptocurrency market continues to show renewed strength as 2026 gets underway. Bitcoin (BTC) is up around 6% on the week, while Ethereum (ETH) has posted gains of over 8%, helping improve overall sentiment across the market. This positive momentum is now spreading into major altcoins — including** Algorand (ALGO).**
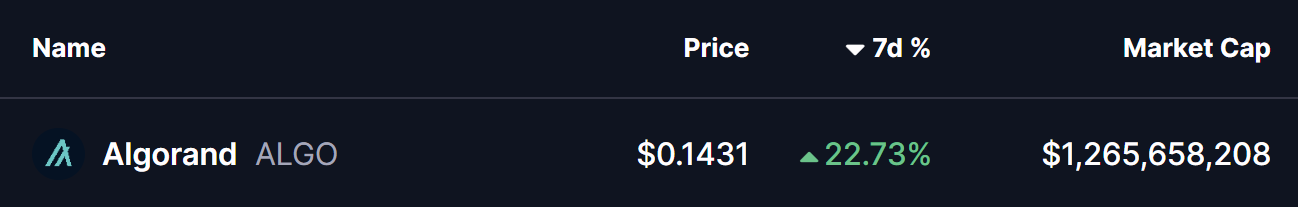
ALGO has already delivered a strong 22% weekly gain, but the more important development is unfolding beneath the surface. Recent price action suggests a clear structural shift is taking place, one that could mark the early stages of a sustained bullish continuation if a critical resistance zone is decisively cleared.
Source: Coinmarketcap
Right-Angled Descending Broadening Pattern in Play
On the 4-hour timeframe, ALGO had been trading inside a right-angled descending broadening formation — a bullish reversal structure defined by a flat overhead resistance and a rising lower boundary. For several weeks, price struggled to overcome the $0.1340–$0.1486 resistance band, with each rejection keeping ALGO locked in consolidation.
The recent rebound from the lower boundary of the structure marked a key turning point. Buyers stepped in aggressively, allowing ALGO to reclaim the 200-period moving average around $0.1225 — a level that had previously acted as dynamic resistance. This reclaim signaled improving momentum and a shift in short-term trend control.
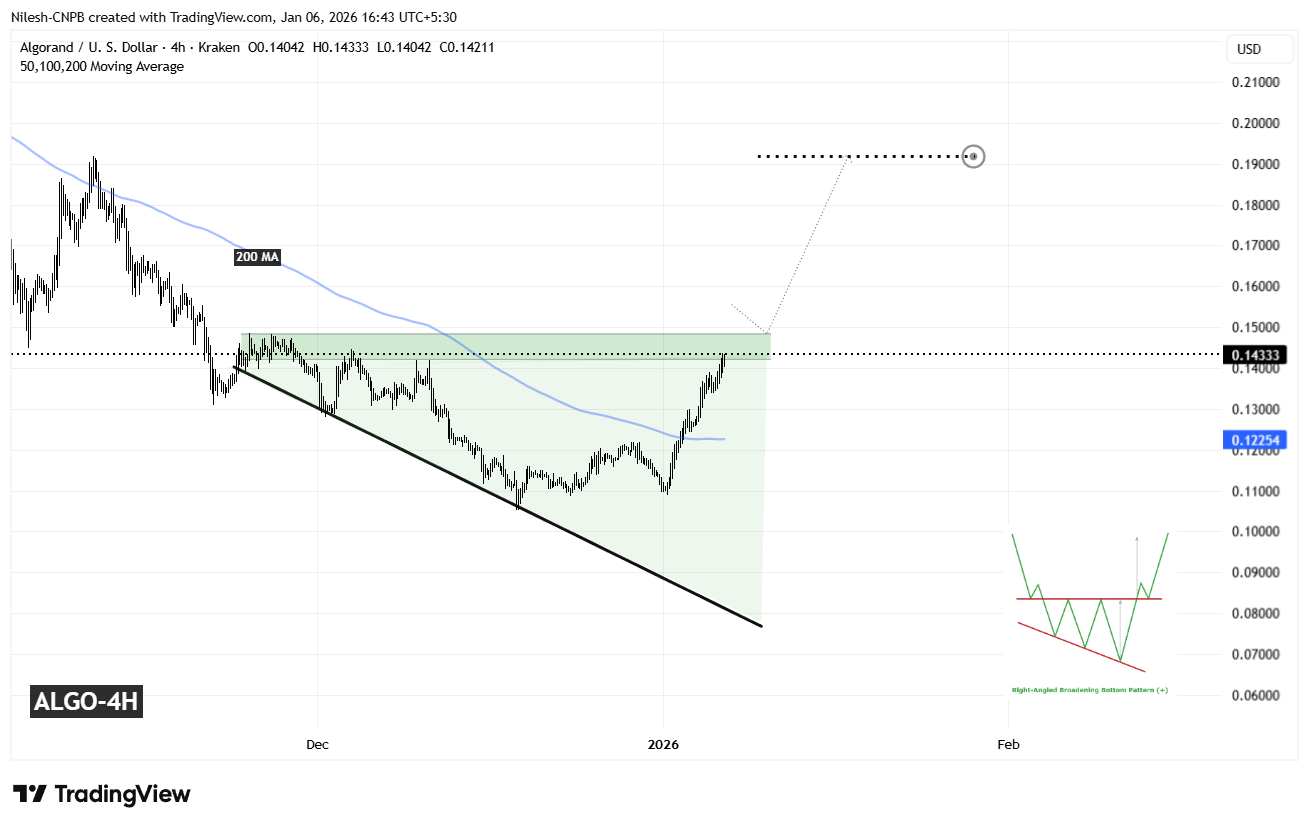
Algorand (ALGO) 4H Chart/Coinsprobe (Source: Tradingview)
Since then, ALGO has continued to push higher and is now pressing back into the same resistance zone that capped upside attempts in the past. This return to resistance places price at a critical inflection point where the broader trend direction could soon be decided.
What’s Next for ALGO?
A decisive close above the $0.1340–$0.1486 resistance zone would confirm a breakout from the descending broadening structure and validate the broader bullish reversal setup. Acceptance above this zone could attract fresh momentum participation and open the door to a stronger expansion phase.
Based on the depth of the formation and the projected measured move, the upside target points toward the $0.1920 region. Reaching that level would imply a potential upside of roughly 33% from current prices, aligning well with the typical behavior seen following successful breakouts from this pattern.
That said, patience remains important. Before any confirmed breakout, ALGO could still see short-term pullbacks — including a retest of the 200-period moving average, which has now turned into dynamic support. Such pullbacks would not invalidate the bullish setup as long as price continues to hold higher-low structures.
Until a clear breakout and follow-through occur, traders may want to remain cautious and avoid chasing price. The $0.1340–$0.1486 zone remains the key decision area that will determine whether Algorand transitions into a sustained bullish phase or continues consolidating as the new year unfolds.
Disclaimer: The views and analysis presented in this article are for informational purposes only and reflect the author’s perspective, not financial advice. Technical patterns and indicators discussed are subject to market volatility and may or may not yield the anticipated results. Investors are advised to exercise caution, conduct independent research, and make decisions aligned with their individual risk tolerance.
About Author: Nilesh Hembade is the Founder and Lead Author of Coinsprobe, with over 5 years of experience in the cryptocurrency and blockchain industry. Since launching Coinsprobe in 2023, he has been providing daily, research-driven insights through in-depth market analysis, on-chain data, and technical research.
Disclaimer: The information on this page may come from third parties and does not represent the views or opinions of Gate. The content displayed on this page is for reference only and does not constitute any financial, investment, or legal advice. Gate does not guarantee the accuracy or completeness of the information and shall not be liable for any losses arising from the use of this information. Virtual asset investments carry high risks and are subject to significant price volatility. You may lose all of your invested principal. Please fully understand the relevant risks and make prudent decisions based on your own financial situation and risk tolerance. For details, please refer to
Disclaimer.
Related Articles
Ethereum Approaches Cycle Low as Bitmain Indicates Violent Belief
The article explores Ethereum's potential market bottom, highlighting its correlation with past S&P 500 trends and significant institutional investment by Bitmain. Despite mixed market sentiment, historical patterns suggest possible recovery.
CryptoBreaking41m ago
Analyst: If Bitcoin falls below the $66,000 support level, it may trigger a 10%-20% correction
Gate News reported that on March 20, Chartered Market Technician (CMT) Aksel Kibar stated on March 21 that the lower support boundary of Bitcoin's potential rising wedge formation is located at 66,000, and a breakdown below this level could trigger a bearish reversal. Aksel Kibar pointed out that rising wedges, as a classic technical pattern, typically appear at the end of uptrends, signaling price momentum exhaustion. Historical data shows that after similar downside breakdowns are confirmed, the average pullback ranges from 10%-20%.
GateNews2h ago
Bitcoin Slips Below $70,000 as Fed Rate Pause and Oil Surge Pressure Markets
Bitcoin declined to $70,000 due to steady interest rates from the Federal Reserve and rising energy prices, leading to $600 million in liquidations and increased market volatility, particularly affecting altcoins.
CryptoBreaking3h ago
XRP Climbs 3% Past $1.47 as Breakout Extends on Bitcoin-Led Rally
Key Takeaways
XRP broke above $1.426 resistance after months of consolidation, jumping to $1.47 on surging volume
Trading volume spiked over 250% during the move, indicating strong participation in the breakout
Activity on the XRP Ledger continues climbing, with tokenized real-world assets
CryptoBreaking3h ago
BTC down 0.65% in 15 minutes: Large spot selling orders dominate short-term pullback, panic sentiment intensifies volatility amplification
2026-03-20 13:45 to 2026-03-20 14:00 (UTC), BTC declined 0.65% within 15 minutes, with price range fluctuating between 69795.3 to 70399.4 USDT, reaching an amplitude of 0.86%. Market volatility intensified in the short term, trading activity increased, and investor attention rose.
The main driver of this price movement was concentrated large-scale active selling in the spot market. During this period, major trading platforms saw multiple large sell orders exceeding 100 BTC each, with sell orders accounting for 52% of volume, directly driving prices downward.
GateNews4h ago
