
**Date: **Fri, Jan 02, 2026 | 03:10 PM GMT
The broader cryptocurrency market has started the new year with modest strength, as both Bitcoin (BTC) and Ethereum (ETH) trade firmly in the green with gains of over 2%. While this positive momentum is lifting most altcoins, the privacy-focused token Zcash (ZEC) is moving against the broader trend.
ZEC is down more than 8% on the day. However, despite the red candles, the daily chart suggests this pullback may be a healthy bullish retest rather than the start of a trend reversal.
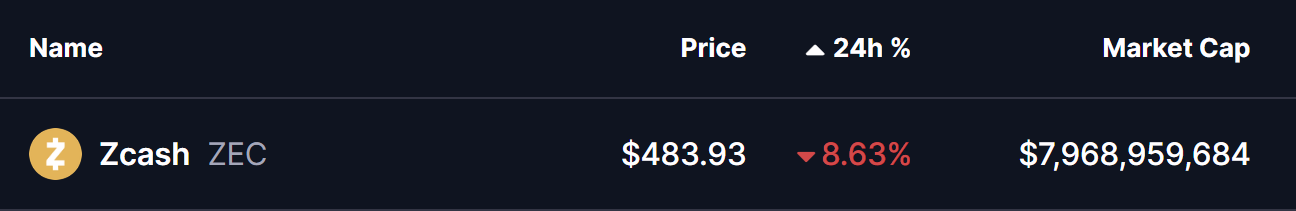
Source: Coinmarketcap
Retesting the Ascending Triangle Breakout
On the daily timeframe, ZEC had been consolidating inside a well-defined ascending triangle pattern, characterized by a series of higher lows pressing against a flat resistance zone near $476. This structure signaled steady accumulation and growing buyer confidence.
Earlier, bulls successfully broke above the $476 ceiling with strong momentum, sending ZEC sharply higher by nearly 66% — from the breakout base to a local peak around $556.59. This move confirmed the validity of the pattern and marked a clear shift in market structure.
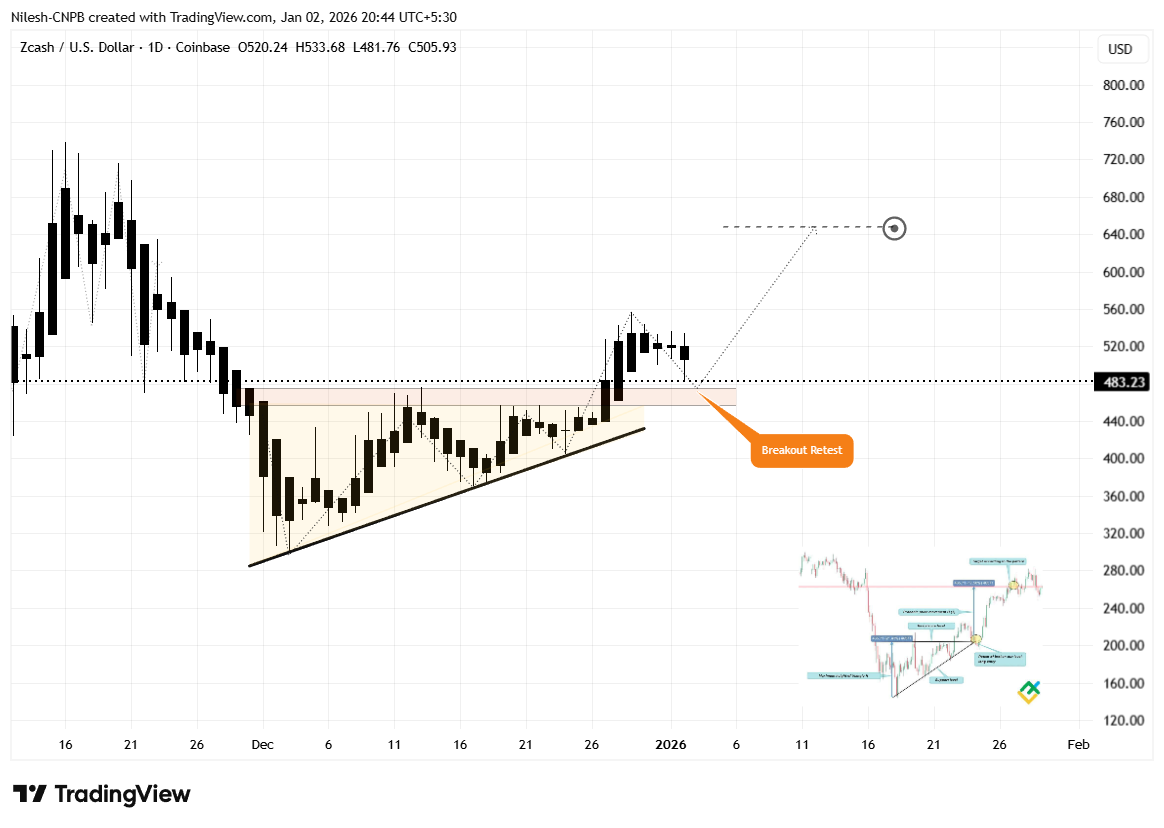
Zcash (ZEC) Daily Chart/Coinsprobe (Source: Tradingview)
Following that rally, price has pulled back and is now trading near the $483 region. Crucially, this zone aligns closely with the former breakout level, making it a classic resistance-turned-support area. Such retests are common after strong breakouts and often act as a launchpad for the next leg higher if buyers defend the level.
What’s Next for ZEC?
The current retest phase is technically constructive, but the next move will depend on whether bulls can firmly defend the broader $426–$476 support zone. A strong reaction from this area would signal that buyers remain in control and are using the dip to accumulate.
If support holds and momentum returns, ZEC’s first key objective will be a reclaim of the $556.59 local high. A decisive move above this level would confirm strength and open the door for further upside.
In that scenario, ZEC could advance toward the ascending triangle’s measured target near $647.73, representing a potential upside of roughly 32% from current levels.
On the downside, failure to hold above the $426 support zone would weaken the bullish breakout structure and raise the risk of a deeper pullback, potentially turning the recent move into a failed breakout.
For now, all eyes remain on the breakout retest. How ZEC reacts around this key support area will likely determine whether the recent rally was just the beginning — or a move that needs more time to rebuild momentum.
Disclaimer: The views and analysis presented in this article are for informational purposes only and reflect the author’s perspective, not financial advice. Technical patterns and indicators discussed are subject to market volatility and may or may not yield the anticipated results. Investors are advised to exercise caution, conduct independent research, and make decisions aligned with their individual risk tolerance.
About Author: Nilesh Hembade is the Founder and Lead Author of Coinsprobe, with over 5 years of experience in the cryptocurrency and blockchain industry. Since launching Coinsprobe in 2023, he has been providing daily, research-driven insights through in-depth market analysis, on-chain data, and technical research.
Disclaimer: The information on this page may come from third parties and does not represent the views or opinions of Gate. The content displayed on this page is for reference only and does not constitute any financial, investment, or legal advice. Gate does not guarantee the accuracy or completeness of the information and shall not be liable for any losses arising from the use of this information. Virtual asset investments carry high risks and are subject to significant price volatility. You may lose all of your invested principal. Please fully understand the relevant risks and make prudent decisions based on your own financial situation and risk tolerance. For details, please refer to
Disclaimer.
Related Articles
Bitcoin $20,000 Put Option Becomes Third Most Popular Strike Price Before CEX Quarterly Expiration
Before Bitcoin quarterly options expiration, the $20,000 put strike became the third most popular strike price, reflecting traders' expectations for extreme downside scenarios. Despite elevated market panic sentiment, call options still slightly outnumber put options, with overall sentiment leaning bullish.
GateNews21m ago
Zcash attracts attention for its privacy features, with a current market capitalization of $4 billion, representing 0.3% of the market share.
Bitcoin still dominates the digital currency market with a market share of approximately 90%. Zcash is rising due to its privacy features, with a market value of around $4 billion, facing growth momentum. If Zcash's market share increases to 5%, its value could potentially grow 18 times.
GateNews22m ago
Polkadot’s AltRank Exploded to #1 While $DOT Price Stayed Down – The Signal Was There Weeks Ago
Something interesting has been happening with Polkadot, and most people probably missed it.
While the DOT price has been sitting relatively low compared to its all-time highs, another metric was quietly flashing a strong signal. AltRank, a metric from LunarCrush, jumped from 109 to 1 in just o
CaptainAltcoin58m ago
BTC Traditional Bottom Indicators Fail, Three New Indicators Gain Market Attention
Bitcoin's recent price volatility has been significant, falling from $76,000 to $69,200, with mixed signals from market bottom indicators. Newly focused indicators such as CVDD, NUPL, and stablecoin inflows may provide clearer insights into market dynamics, suggesting that the bottom has not yet been reached.
GateNews1h ago
BTC 15-minute surge of 0.53%: Dovish CPI signals trigger buying frenzy, whale accumulation intensifies supply compression
During the 2026-03-19 13:30-13:45 (UTC) time window, BTC recorded a 15-minute return of +0.53%, with the price moving slightly upward within the range of 69243.3 to 69826.0 USDT, with a volatility amplitude of 0.84%. The unexpected CPI data release combined with on-chain liquidity tightening sparked market attention, causing significant short-term price movements in BTC. Trading volume did not show extreme expansion, but spot buying pressure increased rapidly.
The main driver of this price movement was the official release of US March CPI data at 13:30 (UTC), which triggered a recovery in market risk appetite. C
GateNews1h ago
