
**Date: **Sun, Jan 04, 2026 | 01:14 PM GMT
As 2026 gets underway, the broader cryptocurrency market is showing renewed stability. Ethereum (ETH) is up nearly 6% on the week, and several major altcoins are beginning to regain momentum. Against this improving backdrop, Hyperliquid (HYPE) is quietly positioning itself as a potential late mover, with its chart structure starting to flash early bullish signals.
While HYPE remains mostly flat on the weekly timeframe, the more important story is unfolding beneath the surface. Recent price action suggests a meaningful structural shift may be underway — one that could mark the early stages of a bullish continuation if key levels are reclaimed.
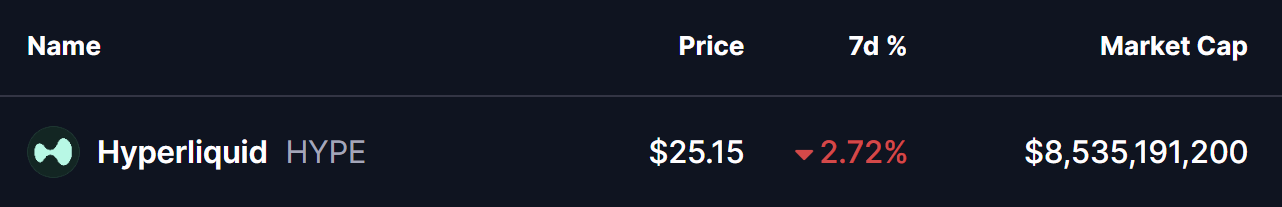
Source: Coinmarketcap
Rounding Bottom Pattern Taking Shape
On the daily timeframe, Hyperliquid appears to be forming a rounding bottom pattern, a classic bullish reversal structure that typically develops after a prolonged corrective phase. This pattern reflects a slow transition from aggressive selling to steady accumulation, as downside momentum fades and buyers gradually step back in.
The setup began after HYPE faced strong rejection near the $51.42–$50.06 neckline resistance zone, which triggered a sharp decline through late November and December. That downside move eventually found strong demand near the $22.20 support level, where selling pressure stalled. Multiple defenses of this area prevented further downside and helped establish a solid base for a potential trend reversal.
Since carving out that bottom, HYPE has started to curve higher in a smooth, rounded fashion — closely matching the textbook structure of a developing rounding bottom. The recent stabilization above the $25 region further supports the view that selling pressure is weakening and accumulation may be underway.
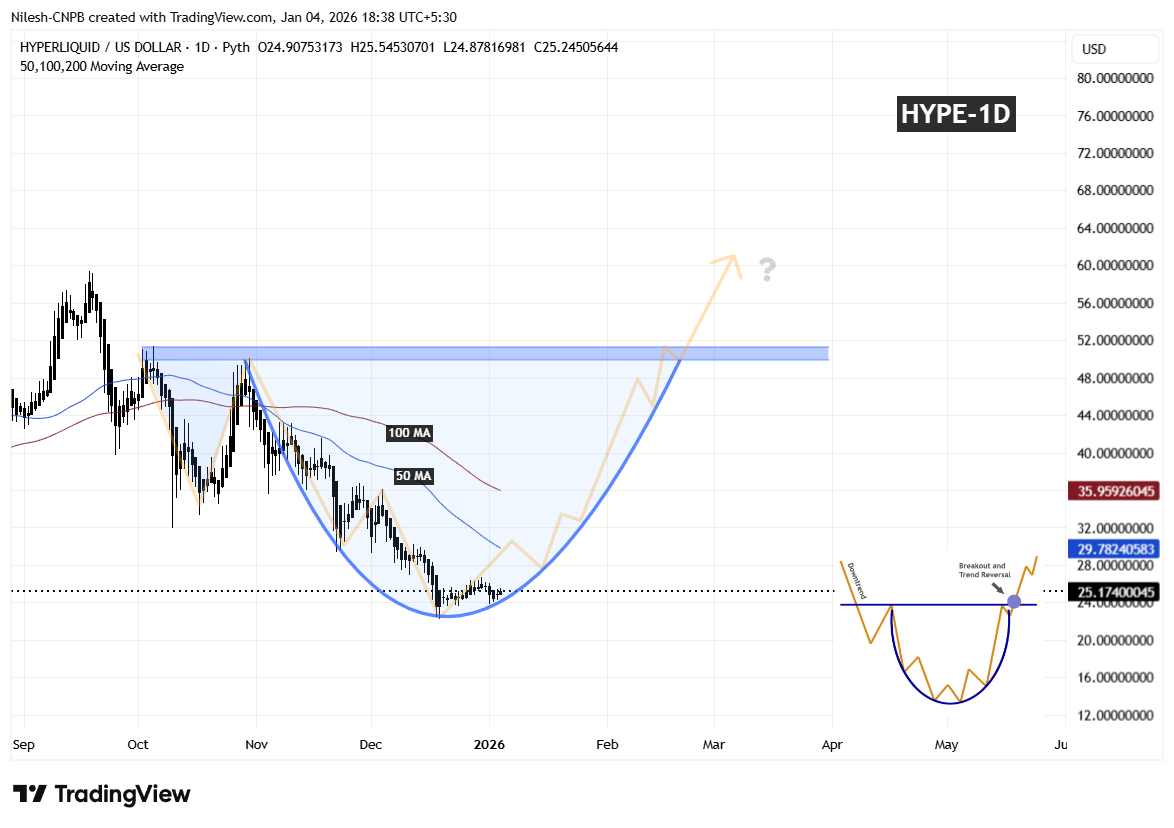
Hyperliquid (HYPE) Daily Chart/Coinsprobe (Source: Tradingview)
A key technical level now comes into play: the 50-day moving average, currently hovering near $29.78. This level has acted as dynamic resistance during the early recovery phase, and reclaiming it would mark an important shift in short-term market structure.
What’s Next for HYPE?
A sustained reclaim of the 50-day MA would be the first meaningful confirmation that buyers are regaining control after months of corrective price action. Holding above this level could allow price to build momentum toward the 100-day MA, which would further reinforce the developing reversal structure.
Looking ahead, the most important level remains the $51.42–$50.06 neckline resistance zone. A clean breakout above this area would validate the entire rounding bottom pattern and could open the door to a broader bullish expansion phase, with momentum traders likely re-entering the market.
In the near term, all eyes remain on the 50-day MA reclaim for upside confirmation. Until that happens, short-term consolidation or shallow pullbacks remain possible. However, as long as price continues to hold above the established base, the broader bottoming structure remains intact and constructive.
Disclaimer: The views and analysis presented in this article are for informational purposes only and reflect the author’s perspective, not financial advice. Technical patterns and indicators discussed are subject to market volatility and may or may not yield the anticipated results. Investors are advised to exercise caution, conduct independent research, and make decisions aligned with their individual risk tolerance.
About Author: Nilesh Hembade is the Founder and Lead Author of Coinsprobe, with over 5 years of experience in the cryptocurrency and blockchain industry. Since launching Coinsprobe in 2023, he has been providing daily, research-driven insights through in-depth market analysis, on-chain data, and technical research.
Disclaimer: The information on this page may come from third parties and does not represent the views or opinions of Gate. The content displayed on this page is for reference only and does not constitute any financial, investment, or legal advice. Gate does not guarantee the accuracy or completeness of the information and shall not be liable for any losses arising from the use of this information. Virtual asset investments carry high risks and are subject to significant price volatility. You may lose all of your invested principal. Please fully understand the relevant risks and make prudent decisions based on your own financial situation and risk tolerance. For details, please refer to
Disclaimer.
Related Articles
CryptoQuant: Bitcoin and Gold Correlation Falls to Nearly 4-Year Low, Showing Clear Divergence in Trends
The correlation between Bitcoin and gold has fallen to its lowest level since November 2022, showing a clear divergence in their trajectories. Despite Bitcoin's recent rebound to $70,000, bearish pressure is intensifying, and investors need to monitor key support levels and gold price movements to gauge market direction.
GateNews13m ago
XRP breaks through $1.5 neckline, key EMA resistance determines short-term trend, potential to test $2
XRP recently broke through the $1.5 resistance level, creating a new closing high. Analysts point out that the short-term support level is at $1.5, which needs to hold to continue the uptrend. If this level breaks, the $1.42 support can be referenced as an alternative. A breakout above three EMAs is needed to confirm a bullish reversal. Market participants should pay attention to price movement and changes in technical indicators.
GateNews27m ago
Hyperliquid Price Jumps 22% as Commodity Trading Hits Record
Key Insights:
Hyperliquid surged over 20% weekly, driven by record commodity futures trading volumes, especially oil and silver contracts, gaining strong traction among traders.
Whale activity surpassed $3.6 billion in leveraged positions, boosting liquidity and reinforcing upward momentum a
CryptoFrontNews30m ago
Bitcoin Falls Below $70,000: PPI Exceeds Expectations + Powell's Hawkish Stance, Rate Cut Expectations Dampened
On March 19, Bitcoin pulled back to a key support zone due to unexpected U.S. inflation data and hawkish signals from Federal Reserve Chair Powell, declining over 4.6% and currently trading near $70,800. Market expectations for rate cuts have cooled, with the total crypto market cap declining to approximately $2.51 trillion and sentiment remaining cautious. If Bitcoin breaks below $70,000, it could potentially decline further to $65,000. Market momentum is highly dependent on macroeconomic factors.
GateNews36m ago
Bitcoin Fails to Break Higher: Why the $70,000 Level Remains Elusive? Key Indicators Reveal Upside Concerns
Bitcoin recently briefly broke through $74,000 but pulled back to around $70,800 due to selling pressure from short-term holders. While the price shows an upward trend, it faces structural resistance, and the current movement appears more like a bear market rally rather than the start of a bull market. Without effectively resisting selling pressure, it could break below the $70,000 support level. The market is still waiting for clearer signals.
GateNews44m ago
