 The post Ethereum Nears Breakout as $1 Billion in Liquidations Build — What’s Next for ETH Price? appeared first on Coinpedia Fintech News
Crypto markets entered the week expecting heightened volatility ahead of key macro triggers, including U.S. unemployment data and the Supreme Court’s ruling on Trump-era tariffs. While a brief bullish push lifted prices across Bitcoin, Ethereum, and major altcoins, the move lacked follow-through. Selling pressure quickly returned, forcing prices back into their respective ranges. As a result, Ethereum—the second-largest crypto—has drifted into a critical phase.
With the ETH price compressing sharply, derivatives data now reveals why this consolidation persists. Leverage is building on both sides, turning indecision into pressure. Ethereum is no longer drifting—it’s coiling. The key question now is what comes next.
ETH Liquidation Map Signals a High-Risk, High-Volatility Zone
![]() Ethereum’s derivatives market is showing clear signs of stress. The ETH liquidation map reveals a dense buildup of leveraged positions on both sides of the price, creating a high-risk zone where even a modest move could trigger forced liquidations and sudden volatility.
Ethereum’s derivatives market is showing clear signs of stress. The ETH liquidation map reveals a dense buildup of leveraged positions on both sides of the price, creating a high-risk zone where even a modest move could trigger forced liquidations and sudden volatility.
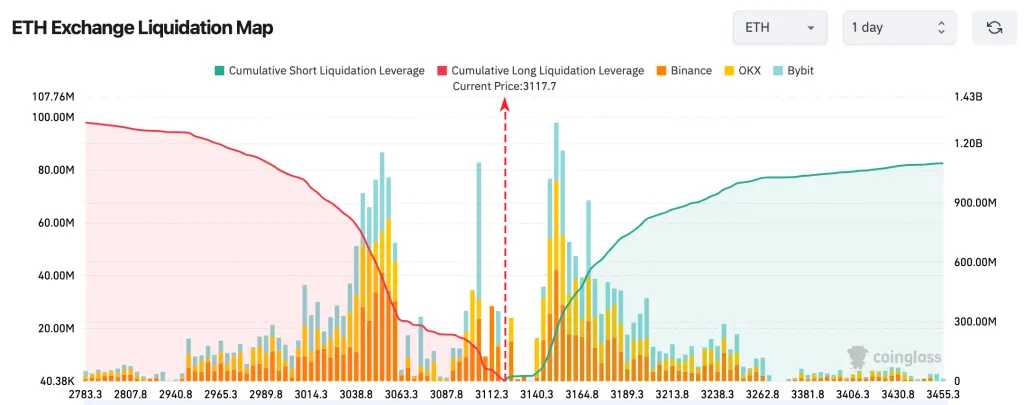 The ETH liquidation map highlights a rare and dangerous setup for overleveraged traders.
- Around $1.64 billion in short liquidations sit above current price levels
- Nearly $1.05 billion in long liquidations are clustered below
- A ~10% move in either direction could trigger cascading forced exits
This tells us the market is balanced on leverage, not conviction. When liquidation pressure builds on both sides like this, ETH typically remains choppy until price breaks structure—and once it does, the move tends to be fast and unforgiving.
ETH Price Compresses Inside a Symmetrical Triangle
Ethereum’s price action reflects growing indecision. ETH is trading inside a tightening symmetrical triangle, a structure that typically forms when buyers and sellers are evenly matched, and volatility is being compressed ahead of a decisive move. On the daily ETH/USDT chart, price action confirms what the liquidation data is warning. ETH is trading inside a symmetrical triangle, marked by lower highs descending from the $3,300–$3,350 region and higher lows rising from the $2,850–$2,900 support zone.
This structure reflects volatility compression, where buyers and sellers are evenly matched while leverage quietly builds. Volume remains muted, reinforcing the idea that ETH is waiting for a trigger—not trending organically.
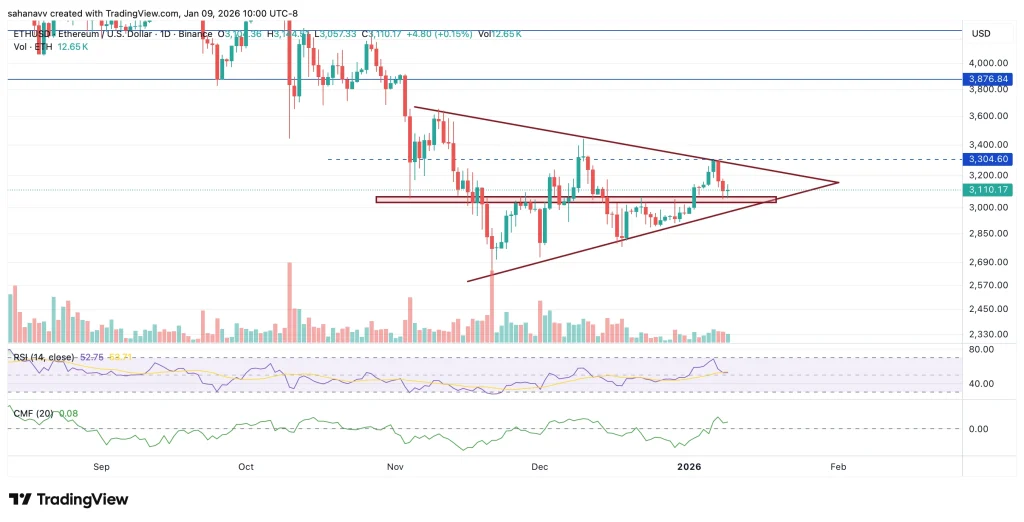 RSI on the daily chart is hovering near the neutral 50 level, showing no momentum extreme and confirming that ETH is in a wait-and-see phase rather than an overbought or oversold condition. A push in RSI above 60 would likely accompany a breakout above $3,300–$3,350, signaling bullish continuation. Conversely, a drop below 40 would align with a breakdown below $2,950–$2,900, increasing downside risk.
At the same time, Chaikin Money Flow (CMF) remains slightly positive, indicating mild capital inflows even as the price compresses inside the triangle. This suggests quiet accumulation rather than distribution. If CMF stays positive during a breakout, ETH could accelerate toward $3,500–$3,600. However, a flip into negative territory would support a downside flush toward $2,700–$2,600.
Together, neutral RSI and positive CMF reinforce that ETH is coiled at a decision point, with indicators supporting a reactive trade based on price confirmation rather than anticipation.
Bottom Line
Ethereum is nearing a critical turning point. With over $1 billion in liquidations positioned on both sides and price compressing inside a symmetrical triangle, the next move is likely to be sharp and decisive. ETH is not trending—it is coiling under heavy leverage. A confirmed break above $3,300–$3,350 could trigger a short squeeze toward higher resistance, while a drop below $2,900 risks a rapid long flush. For traders, patience is key. The edge lies in reacting to confirmation, not anticipating direction.
Disclaimer: The information on this page may come from third parties and does not represent the views or opinions of Gate. The content displayed on this page is for reference only and does not constitute any financial, investment, or legal advice. Gate does not guarantee the accuracy or completeness of the information and shall not be liable for any losses arising from the use of this information. Virtual asset investments carry high risks and are subject to significant price volatility. You may lose all of your invested principal. Please fully understand the relevant risks and make prudent decisions based on your own financial situation and risk tolerance. For details, please refer to
Disclaimer.
Related Articles
Best Crypto Presale: DeepSnitch AI Rallies 205% as Investors Choose AI Tech Over Washed-Up Presales Like Bitcoin Hyper and BlockchainFX
European Bitcoin treasury companies are merging to survive, and doing it without selling a single coin. Sweden’s H100 Group is acquiring two Norwegian Bitcoin firms in an all-stock deal, jumping from 44th to 27th globally in Bitcoin treasury rankings overnight.
But while institutions are mergi
CaptainAltcoin7m ago
Analysts Grow More Confident Over Bitcoin’s Final Rally in 2026, Bullish Then Bearish
Analysts grow more confident over Bitcoin’s final rally in 2026.
A bullish rally is expected first before a major fall in prices.
The price of Bitcoin is expected to fall as far as the $30,000 price range.
The crypto community is once again pleased to see the price of BTC trading over t
CryptoNewsLand11m ago
Bitcoin Faces Two Price Scenarios as Strait of Hormuz Tensions Dominate Oil Market
Recent market analysis from Wintermute indicates that geopolitical tensions in the Strait of Hormuz could significantly impact Bitcoin prices in the short term. If transportation normalizes and oil stabilizes around $100 per barrel, Bitcoin might test resistance levels between $74,000 and $76,000. Conversely, if shipping restrictions persist or conflicts escalate, Bitcoin could drop to around $60,000 due to increased macroeconomic pressure and cautious investor sentiment.
TapChiBitcoin11m ago
Bitcoin ETFs Snap Three-Day Outflow Streak With $167M Inflows
U.S. spot Bitcoin ETFs saw a strong rebound with $167 million in net inflows, largely driven by BlackRock’s fund. In contrast, Ethereum ETFs continued to struggle with ongoing outflows. Despite weak market sentiment, institutional confidence in Bitcoin remains strong.
Coinfomania19m ago
Bitcoin value ‘off the chart’ as BTC price metric hits record lows in 2026
Bitcoin (BTC) is “off the chart” in terms of value-for-money as price diverges from hash rate, a market analyst says.
Key points:
Bitcoin price action is diverging from hash rate to an extent never seen before.
The Bitcoin Yardstick metric shows that price is in its “deep value”
Cointelegraph20m ago
