Solana price has spent the last 2 years telling a quiet story that many traders miss at first glance. Zooming out on the chart shows SOL moving inside a descending broadening channel that has been in place since January 2024. Price swings have been wide, emotional, and often confusing. Yet beneath that noise, the structure itself has remained surprisingly consistent.
Each dip toward the lower boundary has produced higher lows. Each major rally has pushed price to higher highs. That pattern is exactly what keeps long-term Solana discussions alive as 2027 slowly comes into view.
-
Solana Price Structure Shows Why The Chart Still Matters In 2026
-
Solana Price Faces a Tug-of-War Between Growth Catalysts And Regulation
-
AI Breaks Down Three Possible Solana Price Paths For 2027
- Pessimistic Solana Price Scenario Shows What Happens If Support Breaks
- Realistic Solana Price Scenario Assumes A Controlled Breakout
- Optimistic Solana Price Scenario Sees SOL Lead The Cycle Again
Solana Price Structure Shows Why The Chart Still Matters In 2026
Looking closely at the attached chart, SOL price recently bounced from around $117, a level that lines up closely with the lower boundary of the channel. That same support zone has held multiple times across nearly 2 years. Each time price revisits it, buyers step in earlier than before.
This behavior explains why projections toward the upper channel near $320 remain technically reasonable. A move from the current zone around $140 to that region would represent roughly a 130 percent gain, which fits the historical rhythm of Solana rallies within this structure.
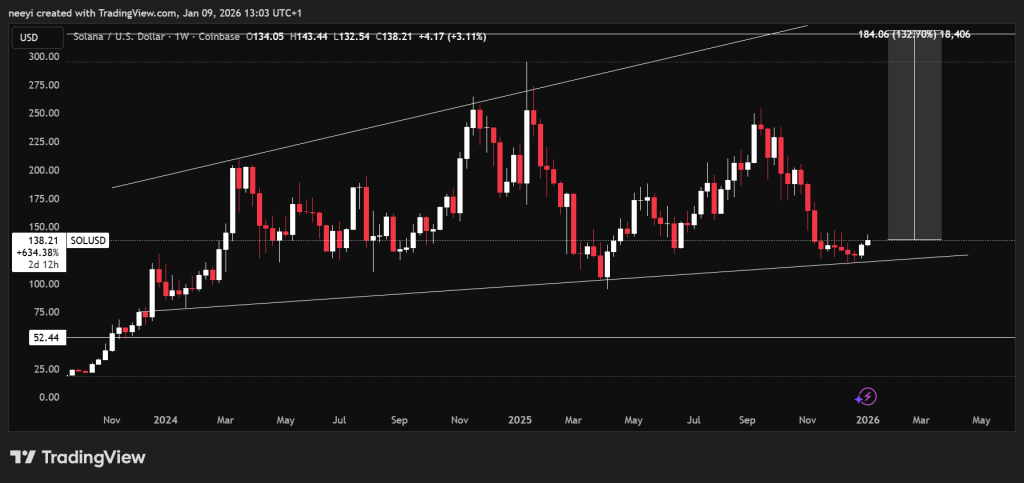
SOL Price Chart
Risk still exists. Losing that lower trendline would change the conversation entirely. A breakdown could open the door to deeper retracements toward $50, a level not seen since the earlier growth phase of the ecosystem. Support held this long tends to matter. Once it breaks, confidence often fades quickly and leveraged positions tend to unwind fast.
Solana has a track record of leading broader crypto rallies when momentum returns. The structure on this chart leaves space for that pattern to repeat into 2027 rather than dismissing it as unrealistic.
Solana Price Faces a Tug-of-War Between Growth Catalysts And Regulation
Beyond the chart, Solana price sits between powerful tailwinds and stubborn headwinds. ETF momentum has already started to show signs of institutional curiosity, even while broader crypto products see outflows. Network upgrades scheduled through 2026 aim to push Solana closer to enterprise-grade performance, with transaction finality targeting near instant speeds.
Stablecoin growth also plays a major role. Solana already hosts a large share of on-chain stablecoins, and long-term projections for global stablecoin flows remain massive. Payments, remittances, and settlement use cases could turn SOL into a high utility asset rather than just a speculative one.
Regulation remains the wildcard. Delays around ETF approvals and evolving stablecoin frameworks continue to slow momentum. Liquidity reacts faster than technology, which means execution alone may not be enough without clarity.
AI Breaks Down Three Possible Solana Price Paths For 2027
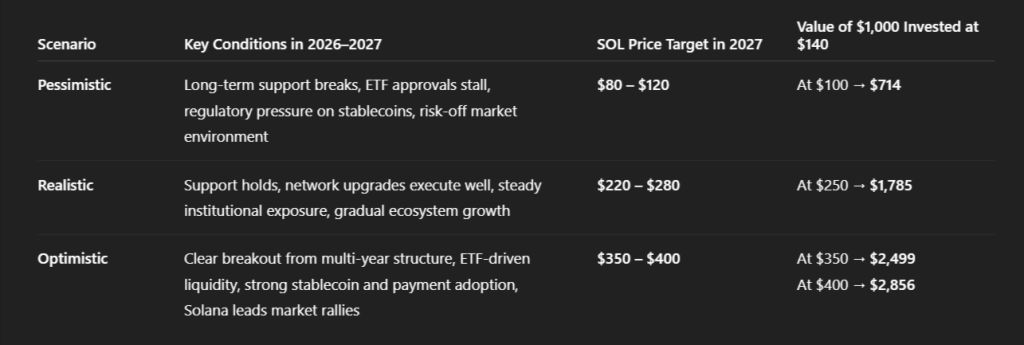
Using the technical structure, network development, and regulatory backdrop, we asked ChatGPT to outline where Solana price could realistically land in 2027. The result was 3 clear scenarios that frame the upside and downside without relying on hype.
Pessimistic Solana Price Scenario Shows What Happens If Support Breaks
Under a pessimistic view, Solana fails to convert its long-term structure into a clean breakout. Support breaks sometime in 2026, and price enters a slow recovery phase rather than a strong uptrend. Regulatory uncertainty around stablecoins and delayed ETF decisions keep fresh capital sidelined.
SOL remains relevant, active, and used, yet it no longer leads rallies. Price stays trapped below major resistance zones.
In this case, Solana price in 2027 could trade between $80 and $120. A $1,000 investment at $140 buys about 7.14 SOL. At $100 in 2027, that position would be worth roughly $714.
ChatGPT’s Response
Realistic Solana Price Scenario Assumes A Controlled Breakout
The realistic scenario assumes Solana holds its long-term support and executes its upgrades without major disruptions. Adoption grows steadily across payments, DeFi, and stablecoins. ETF narratives remain supportive even if approvals take time.
Price pushes above multi-year averages and confirms a structural trend shift without entering speculative excess.
This places Solana price in a 2027 range between $220 and $280. At $250, 7.14 SOL would be worth about $1,785 from an initial $1,000 position.
Optimistic Solana Price Scenario Sees SOL Lead The Cycle Again
The optimistic path aligns with Solana’s historical behavior during strong market phases. A decisive breakout from the descending channel occurs in late 2026 or early 2027. Liquidity expands through ETF approvals or sustained inflows. Network upgrades deliver measurable gains that attract real-world usage.
Stablecoin payments scale faster than expected, and Solana reclaims its role as a high-speed settlement layer.
ASTER Price Is Moving Exactly As This Analyst Predicted: The Chart Shows What Comes Next_**
In this scenario, Solana price reaching $350 to $400 in 2027 becomes a reflection of repricing rather than speculation. A $1,000 investment at $140 would grow to about $2,499 at $350 or roughly $2,856 at $400.
By 2027, Solana will no longer be judged on potential alone. Execution, adoption, and liquidity alignment will drive valuation. The downside scenario reflects hesitation and structural damage. The realistic scenario reflects validation without hype. The optimistic scenario reflects leadership returning at the right moment.
What unfolds through 2026 sets the conditions. What price does in 2027 reveals whether Solana simply survives or defines the next phase of the market.
Disclaimer: The information on this page may come from third parties and does not represent the views or opinions of Gate. The content displayed on this page is for reference only and does not constitute any financial, investment, or legal advice. Gate does not guarantee the accuracy or completeness of the information and shall not be liable for any losses arising from the use of this information. Virtual asset investments carry high risks and are subject to significant price volatility. You may lose all of your invested principal. Please fully understand the relevant risks and make prudent decisions based on your own financial situation and risk tolerance. For details, please refer to
Disclaimer.
