Key Insights
- SUI is currently battling a 4% daily drop as selling pressure increases near the important $1.80 level.
- Trading volume has fallen by over 32% since yesterday. This indicates a strong decline in market participation and trader activity.
- Technical indicators like the MACD and CMF are currently showing that capital is flowing out of the asset as it tests a neutral RSI zone.
The crypto market has entered a period of cooling after a volatile start to the new year. While several major assets struggle to hold their ground, SUI in particular is facing a difficult test of its recent recovery.
After a brief climb toward the $2.00 mark, the token has started to drift lower as buyers lose their grip.
Most digital assets are trading in the red today, and the general market sentiment remains stuck in a neutral zone.
Technical Signals Weigh on the SUI Price
Market data from TradingView shows that the short-term outlook for SUI has turned quite heavy.
The 4-hour chart shows several red candles in a row, which is a classic sign of bearish control.
Many traders are now watching the $1.70 range as a support level. If the price fails to hold there, it could trigger a “death cross.”
For context, this happens when short-term moving averages fall below long-term ones and often leads to more selling.
The daily chart shows a descending channel as SUI trades between its 100 and 50-day EMAs.
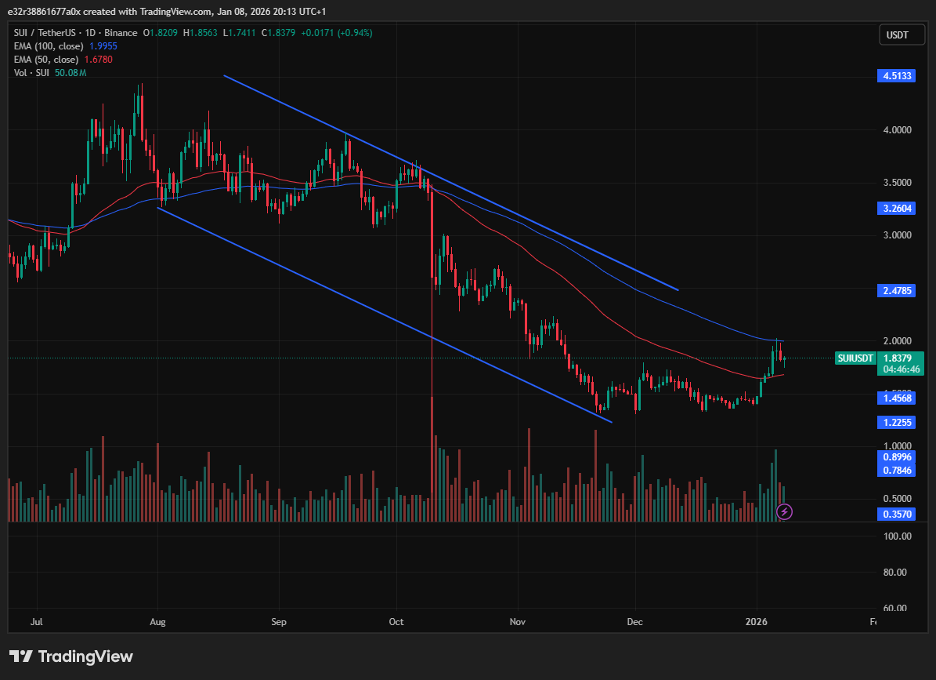
SUI shows a descending channel on daily charts | Source: TradingView
Indicators like the MACD are currently below the signal line. This confirms that the trend is moving against the bulls. The Chaikin Money Flow (CMF) also shows a reading of -0.07, which means that there is mild capital outflow.
In other words, more people are selling than buying right now. While the momentum is not yet in a state of freefall as of writing, the gap between these lines is widening, and traders need to stay alert.
A Look Back at the Early 2026 Recovery
Despite the recent dip, it is important to remember that SUI started the year with a massive 30% surge.
In the first week of the year alone, the token briefly reclaimed the $2.00 level for the first time since November. This rally was a breath of fresh air after a long decline that dominated the second half of last year.
During that time, social interest in the project had fallen by nearly 95% according to data from Santiment.
This recent recovery happened even though online discussion remained very low. Usually, when prices go up without a lot of social media hype, it tends to mean that whales are the only ones buying.
Can SUI Break the Cycle of Decline?
The biggest challenge for the SUI is breaking the long-term downtrend that began last year.
Analysts recently noted that the price had managed to break above a major descending trendline earlier this month.
This was a major win for the bulls, and it showed that the demand zone between $1.00 and $1.20 was strong enough to act as a solid base for future growth.
$SUI is turning out to be a great deal. 👀✔️ https://t.co/hvv6n1lu9d pic.twitter.com/yylhKDE7ST
— Lucky (@LLuciano_BTC) January 6, 2026
Even with the current 1% to 4% daily loss, some technical analysts are still hopeful.
They believe that as long as SUI stays above the $1.50 mark, the “bullish thesis” is still alive.
The daily RSI is currently at 51.49, which means that the market’s momentum is neutral. In other words, the market is in a period of consolidation and investors are playing a waiting game to see if the bulls will step back in.
Disclaimer: The information on this page may come from third parties and does not represent the views or opinions of Gate. The content displayed on this page is for reference only and does not constitute any financial, investment, or legal advice. Gate does not guarantee the accuracy or completeness of the information and shall not be liable for any losses arising from the use of this information. Virtual asset investments carry high risks and are subject to significant price volatility. You may lose all of your invested principal. Please fully understand the relevant risks and make prudent decisions based on your own financial situation and risk tolerance. For details, please refer to
Disclaimer.
Related Articles
SOL price is positioned in the $92-95 range, with the market in a recovery phase.
Gate News update: On March 19th, Solana (SOL) price is currently trading in the $92-95 range. Recent price movements indicate that the market is in a recovery phase, with prices fluctuating within this range.
GateNews54m ago
River (RIVER) Weekly Gains Hit 50%, Market Divided on Future Outlook
River (RIVER) token's price has risen by 50% in the last week, leading to mixed opinions; some analysts foresee a potential rise above $50, while others advise traders to remain cautious.
GateNews1h ago
Solana Treasury Forward Industries Uses Loan to Buy Back Shares After 89% Price Dive
In brief
Forward Industries purchased more than 6 million of its shares from an institutional investor for $27.4 million as part of a share buyback.
The firm used a $40 million crypto-backed loan from Galaxy Digital to fund the repurchase.
Shares in the firm (FWDI) finished the day
Decrypt1h ago
Mega Bank Global Stablecoin Test vs. Traditional Remittance: Who Wins? Rui-Bin Dong: 200,000 TWD is the "Turning Point"
Mega Bank's field test report shows that stablecoins outperform traditional banks in small remittances, with faster settlement and lower costs; however, traditional banks still have clear advantages in large corporate transfers and compliance. Chairman Tung Jui-pin emphasized that the two should be complementary rather than replace each other. The widespread adoption of stablecoins faces regulatory challenges.
動區BlockTempo2h ago
BTC rises 0.77% in 15 minutes: rebound driven by active buyers overlapping with safe-haven fund resonance
From 2026-03-19 19:00 to 19:15 (UTC), BTC price fluctuated within the range of 69802.0 to 70547.9 USDT, with volatility reaching 1.07%, recording a return rate of +0.77%. Short-term trading activity drove increased market attention, with volatility strength exceeding the daily average, attracting rapid capital participation.
The main driver of this price movement was concentrated active buy orders in the spot market, pushing BTC price up sharply in the short term. On-chain data shows that transfer volume during the 19:00-19:15 interval exhibited no extreme changes, and there were no large whale transfers. Weighing spot market and
GateNews3h ago
Ethereum Continues to Recover, Analysts Discuss Whether It Can Return to $4000 in Q2
Gate News reported that on March 19, Ethereum (ETH) continues to recover following recent market volatility. Analysts are discussing whether Ethereum can climb back to the $4,000 mark in Q2 2026.
GateNews3h ago
