**Date: **Wed, Jan 07, 2026 | 06:20 AM GMT
The broader cryptocurrency market continues to show strong New Year momentum, with Bitcoin (BTC) up around 4% and Ethereum (ETH) gaining over 9% on a weekly basis. This improving sentiment is gradually spilling over into major altcoins — including the DePIN-focused token Akash Network (AKT).
AKT has already posted an impressive 20% weekly gain. While this short-term strength has caught traders’ attention, the more important development is unfolding on the higher-timeframe chart. Recent price action suggests a meaningful shift in market structure, hinting that AKT may be transitioning out of a prolonged corrective phase and into the early stages of a bullish continuation.

Source: Coinmarketcap
Falling Wedge and Rounding Bottom in Play
On the daily chart, AKT has been trading within a broader falling wedge — a structure that often precedes bullish reversals as selling pressure gradually weakens. Within this larger wedge, price action is also shaping a developing rounding bottom pattern, reflecting steady accumulation and seller exhaustion.
The formation began after AKT faced strong rejection near the $0.5441 resistance zone in late November. That rejection triggered a sharp sell-off, pushing price lower toward the $0.3465 region. However, bears failed to extend losses beyond this area. Instead, demand stepped in, downside momentum slowed, and price began to stabilize.
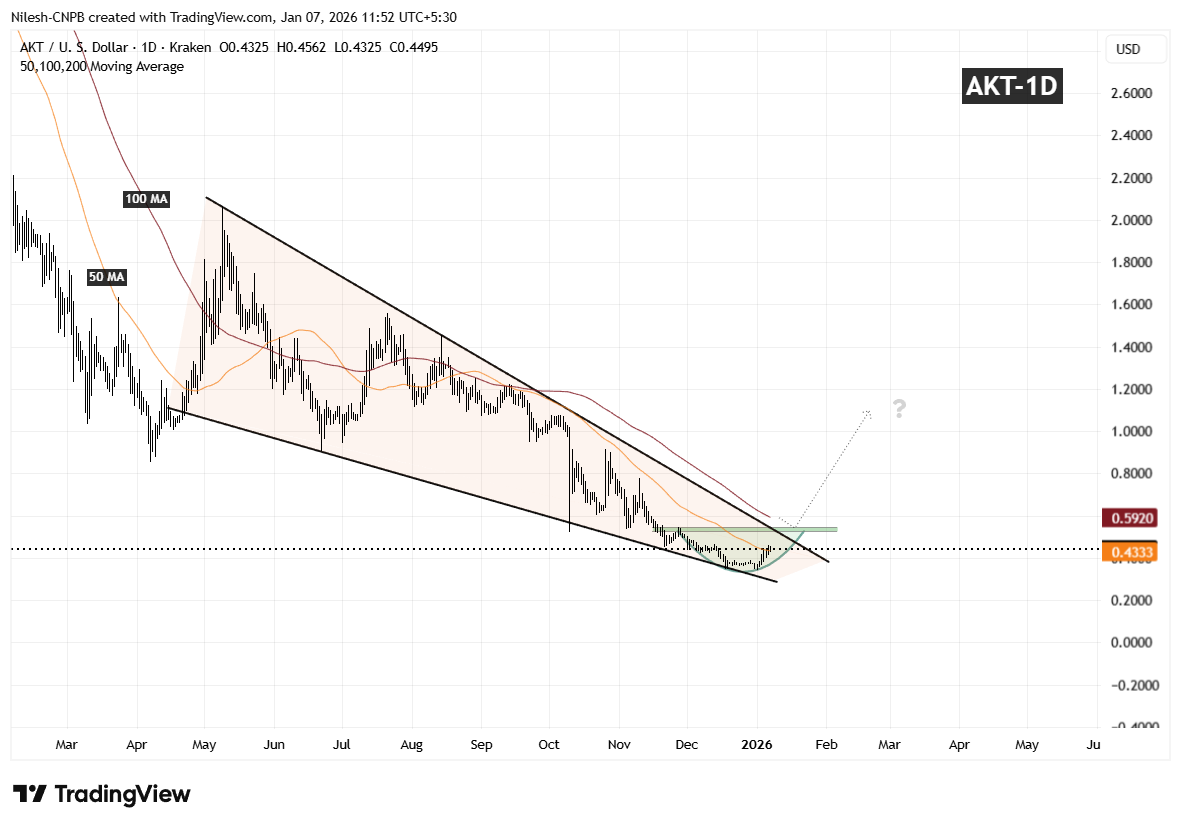
Akash Network (AKT) Daily Chart/Coinsprobe (Source: Tradingview)
Over the following weeks, volatility compressed and AKT started to curl higher in a smooth, rounded fashion — closely matching the textbook behavior of a rounding bottom. Importantly, the recent rebound has pushed price back above the 50-day moving average around $0.4333, a level that had previously acted as resistance and is now beginning to flip into support.
What’s Next for AKT?
If AKT can continue to hold above the 50-day moving average, this area may act as a solid base for further upside attempts. From here, attention shifts toward the descending resistance trendline of the falling wedge, which aligns closely with the $0.5441 resistance zone.
A clean and decisive breakout above this confluence area, followed by sustained acceptance, would confirm a broader bullish expansion phase and mark a clear trend reversal from the prior downtrend. Such a move would likely attract renewed momentum participation as the market recognizes the structural shift.
Until that breakout occurs, the pattern remains in development. Short-term consolidation or shallow pullbacks are still possible as price digests recent gains. However, as long as AKT continues to print higher lows above the established base, the broader technical structure remains constructive.
Overall, the chart suggests AKT is approaching a critical inflection point — one that could determine whether this recovery evolves into a sustained bullish trend as 2026 progresses.
Disclaimer: The views and analysis presented in this article are for informational purposes only and reflect the author’s perspective, not financial advice. Technical patterns and indicators discussed are subject to market volatility and may or may not yield the anticipated results. Investors are advised to exercise caution, conduct independent research, and make decisions aligned with their individual risk tolerance.
About Author: Nilesh Hembade is the Founder and Lead Author of Coinsprobe, with over 5 years of experience in the cryptocurrency and blockchain industry. Since launching Coinsprobe in 2023, he has been providing daily, research-driven insights through in-depth market analysis, on-chain data, and technical research.
Disclaimer: The information on this page may come from third parties and does not represent the views or opinions of Gate. The content displayed on this page is for reference only and does not constitute any financial, investment, or legal advice. Gate does not guarantee the accuracy or completeness of the information and shall not be liable for any losses arising from the use of this information. Virtual asset investments carry high risks and are subject to significant price volatility. You may lose all of your invested principal. Please fully understand the relevant risks and make prudent decisions based on your own financial situation and risk tolerance. For details, please refer to
Disclaimer.
Related Articles
Strategy Founder: STRC Volatility Drops to Historic Low of 1.5%, Sharpe Ratio Rises to 5.37
Gate News, on March 18, Michael Saylor, founder and CEO of Strategy, posted that STRC's volatility has dropped to a historic low of 1.5%, while its Sharpe ratio (a metric measuring risk-adjusted returns) has risen to a historic high of 5.37, setting a new record for risk-adjusted return performance.
GateNews43m ago
Why Bitcoin's Biggest Quantum Critic Says Real Bull Market Starts at $80,000 - U.Today
Charles Edwards, founder of Capriole Investments, analyzes Bitcoin's market, stating that a move above $80,000 could signal a bull market. His outlook is based on institutional purchasing patterns, while he continues to warn of quantum computing threats to Bitcoin's future by 2028.
UToday1h ago
BTC 15-minute decline of 0.48%: Selling pressure and liquidity shifts amplify global volatility
2026-03-18 11:15 to 11:30 (UTC), BTC recorded a -0.48% return within 15 minutes, with a price range of 73570.9 to 74008.0 USDT, and amplitude reaching 0.59%. The market exhibited increased volatility characteristics during this period, drawing investor attention to the causes of short-term movements.
The main driving force behind this movement is the release of short-term selling pressure and changes in liquidity. If large-scale BTC transfers occur on-chain, and spot and futures trading volumes surge, it may trigger short-term market selling, especially in the context of sell-side dominance and weakened order book liquidity.
GateNews1h ago
Crypto Sector Holds Steady Amid Neutral Sentiment
The crypto market shows mixed results with a $2.54T cap, as Bitcoin dips 0.13% and Ethereum rises 0.61%. Notable gainers include $TRUMP, $IDOS, and $MAGA. DeFi and NFT markets also see significant activity, while regulatory developments emerge from the SEC and CFTC.
BlockChainReporter1h ago
Bitcoin and Gold Correlation Coefficient Drops to -0.88, Reaching Lowest Level Since November 2022
Gate News reports that on March 18, CryptoQuant data showed the correlation coefficient between Bitcoin and gold dropped to -0.88, hitting a new low since November 2022. The data indicates a strong negative correlation between the two, with Bitcoin's price rising to $74,000 while gold experienced a slight decline.
GateNews1h ago
XRP Begins Era as Commodity Under US Laws, Stuart Alderoty Reacts - U.Today
Stuart Alderoty, Ripple's CLO, welcomes the SEC's reclassification of XRP as a commodity, suggesting it could enhance adoption and ease exchange listings. Despite a recent price drop, XRP remains above key support levels, although trading volume has significantly decreased.
UToday2h ago
