
As the new year 2026 begins, the broader cryptocurrency market has shown modest strength over the past few hours, with both Bitcoin (BTC) and Ethereum (ETH) turning slightly green. This improvement in sentiment has started to spill over into the altcoin market as well, with several tokens attempting to build upward momentum — including Render (RENDER).
RENDER is currently up around 4% on the day, but the more compelling development lies beneath the surface. On lower timeframes, price action is beginning to highlight a constructive bullish structure that could soon pave the way for a meaningful breakout if confirmed.
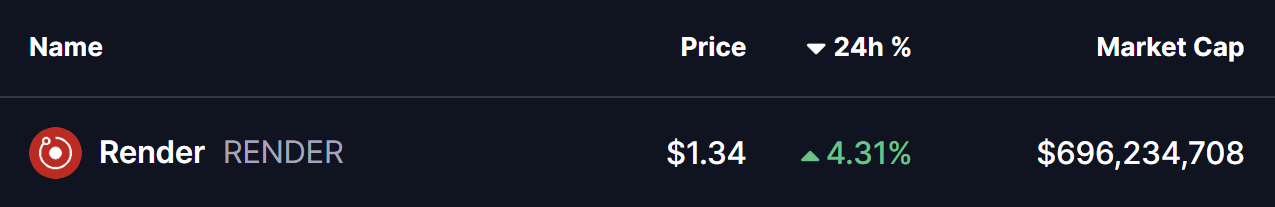
Source: Coinmarketcap
Ascending Triangle Structure Takes Shape
On the 4-hour chart, RENDER appears to be forming a textbook ascending triangle, characterized by a sequence of higher lows pressing steadily against a well-defined horizontal resistance zone. This structure is widely viewed as a bullish continuation pattern, particularly when it develops after a period of consolidation and shows signs of accumulation.
RENDER recently faced rejection near the $1.36 neckline resistance, which pushed price back toward its rising support trendline around the $1.28 region. However, each pullback has been met with strong buying interest, keeping the pattern intact and preventing any deeper breakdown. This behavior suggests that sellers are gradually losing control as buyers continue to step in at higher levels.
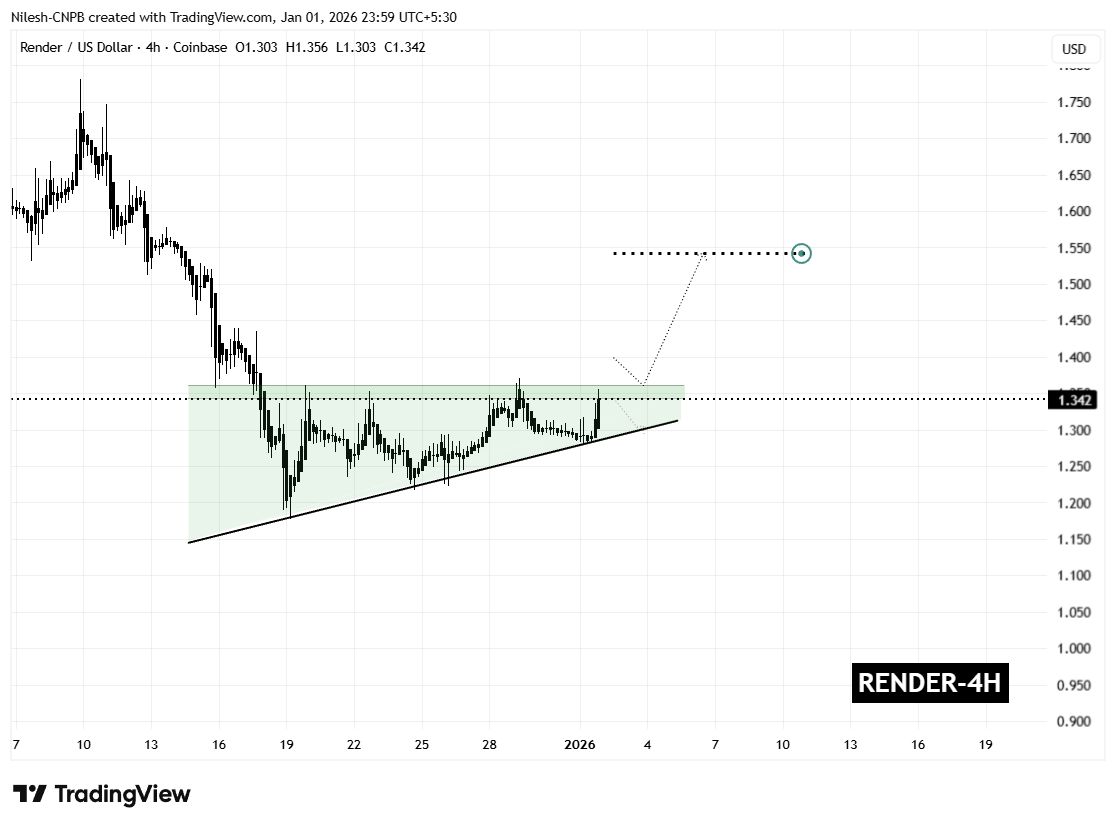
Render (RENDER) 4H Chart/Coinsprobe (Source: Tradingview)
The latest rebound has carried RENDER back toward the upper boundary of the pattern, reinforcing the idea that demand remains firm. Rather than signaling weakness, this price action points to healthy consolidation as the market tightens ahead of a potential breakout.
What’s Next for RENDER?
From here, RENDER appears to be preparing for another test of the $1.36 resistance zone. A confirmed breakout and sustained close above this level, ideally followed by a successful retest as support, would validate the ascending triangle structure and likely trigger a bullish expansion phase.
Based on the measured move of the pattern, the technical upside projection points toward the $1.54 region. This target represents a potential upside of roughly 14% from current levels and also aligns with previous price structure, strengthening the bullish case.
That said, caution remains warranted. A failure to break above resistance could result in a pullback toward the rising support trendline. As long as that trendline continues to hold, the broader bullish structure would remain intact. A decisive breakdown below support, however, would invalidate the pattern and delay any breakout scenario.
For now, the combination of improving market sentiment, persistent buying pressure, and a tightening ascending triangle structure suggests that Render is approaching a critical decision point — one that could define its next significant move as 2026 gets underway.
Disclaimer: The views and analysis presented in this article are for informational purposes only and reflect the author’s perspective, not financial advice. Technical patterns and indicators discussed are subject to market volatility and may or may not yield the anticipated results. Investors are advised to exercise caution, conduct independent research, and make decisions aligned with their individual risk tolerance.
About Author: Nilesh Hembade is the Founder and Lead Author of Coinsprobe, with over 5 years of experience in the cryptocurrency and blockchain industry. Since launching Coinsprobe in 2023, he has been providing daily, research-driven insights through in-depth market analysis, on-chain data, and technical research.
Disclaimer: The information on this page may come from third parties and does not represent the views or opinions of Gate. The content displayed on this page is for reference only and does not constitute any financial, investment, or legal advice. Gate does not guarantee the accuracy or completeness of the information and shall not be liable for any losses arising from the use of this information. Virtual asset investments carry high risks and are subject to significant price volatility. You may lose all of your invested principal. Please fully understand the relevant risks and make prudent decisions based on your own financial situation and risk tolerance. For details, please refer to
Disclaimer.
Related Articles
ETF Absorbs Over $1.1 Billion Yet Struggles to Rescue the Market? Powell and Oil Prices Team Up to Put Pressure On, Bitcoin Breaks Key Support
Despite Bitcoin ETF inflows of $1.16 billion, Bitcoin price pulled back to $71,000, declining over 4%. Analysts attribute the pullback to interest rate expectations and inflation pressures, while ETF inflows indicate that institutions view Bitcoin as a long-term asset. The weakness in U.S. equities has also impacted the crypto market.
GateNews1h ago
XRP Today’s News: Goldman Sachs Holds 154 Million XRP in ETF, Institutional Buying Fails to Drive Up the Price
Goldman Sachs has become the largest public holder of XRP spot ETF with a position of approximately $154 million, but this institutional signal has yet to be reflected in the coin price, with XRP still hovering around $1.29. Technical analysis shows that the $1.50 support level is critical, and a breakthrough could push prices higher.
MarketWhisper2h ago
Whale Buys Million in Ethereum! Low-Level Rebound Signals Emerge, Is ETH Price Inflection Point Coming?
Recently, an Ethereum whale returned to the market, purchasing 50,706 ETH with 111 million USDT, demonstrating confidence in the current price. Meanwhile, other large wallets have exhibited similar buying behavior, elevating market attention toward Ethereum. Although Ethereum's price continues to face pressure, institutional capital inflows and improved regulatory environment in the United States provide certain support to the market, potentially establishing mid-term support levels.
GateNews2h ago
Today's cryptocurrency fear and greed index dropped to 23, with the market shifting to an extremely fearful state.
Gate News: On March 19, according to Alternative.me data, today's cryptocurrency Fear and Greed Index dropped to 23, with the market transitioning from yesterday's "panic state" (index 26) to "extreme panic state."
GateNews3h ago
Why Did Bitcoin Decline Today? Powell Sends Hawkish Signals, Trump Considers Troop Increase in Middle East
Bitcoin fell to $70,767 on March 19 following hawkish signals from Federal Reserve Chairman Powell, who warned that rising oil prices could exacerbate inflation; meanwhile, U.S. military troop reinforcements in the Middle East heightened geopolitical risks. The $70,000 level is a critical support for Bitcoin, and a break below it could accelerate further downside.
MarketWhisper3h ago
Here’s Why River (RIVER) Price Is Pumping Today
RIVER's price surged 25% to $27.54, driven by a bullish inverse head-and-shoulders breakout and increased trading volume. Analysts project further gains as traders respond to market conditions and ongoing ecosystem campaigns, indicating strong support for the price.
CaptainAltcoin6h ago
