- MemeCore is trading in a narrow range, suggesting short-term consolidation.
- Support near $1.55 and resistance at $1.89 will be key levels to watch.
MemeCore (M) has been moving sideways in recent weeks, with the price currently around $1.69. After a period of decline, the token is now showing early signs of stabilization, trading in a narrow range between support and resistance. The chart suggests that MemeCore may be forming a short-term consolidation pattern, sometimes referred to as a rectangle or range-bound structure, where the price oscillates between defined support and resistance levels.
Over the past 24 hours, the price of this memecoin climbed about 3%, reaching an intraday high of $1.71 and a low of $1.62. Its market cap currently stands at $2.1 billion, with a trading volume of $14.7 million.
Sideways Momentum Suggests the Market Is Taking a Breather
Looking at the 24 hours trading pattern, MemeCore is positioned between the 50-day moving average at $1.555 and the 100-day moving average at $1.889. The 50-day moving average is slowly flattening, indicating that immediate selling pressure is easing. The 100-day moving average remains above the current price, suggesting the broader trend is still slightly weak. Overall, the averages show that the market is in a recovery phase but hasn’t fully returned to an uptrend yet.
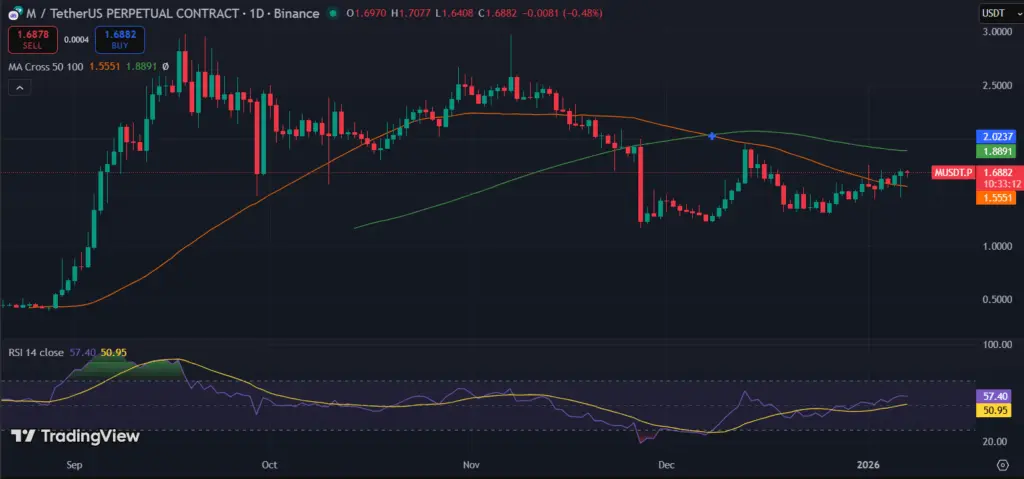 (Source: TradingView)MemeCore’s daily RSI stands at 57, showing that momentum is mildly positive. This indicates that buyers are gradually returning, but there isn’t a strong push higher yet. The market isn’t oversold or overbought, which fits with the sideways price action seen on the chart.
Immediate support is around $1.55–$1.56, which has helped prevent further declines in recent sessions. A stronger support level exists near $1.50, which could provide a safety net if the price dips further. On the upside, MemeCore’s resistance is seen at $1.89, near the 100-day moving average, followed by $2.02, which previously acted as a barrier. Breaking above these levels would be necessary for any meaningful upward movement.
Disclaimer: The information on this page may come from third parties and does not represent the views or opinions of Gate. The content displayed on this page is for reference only and does not constitute any financial, investment, or legal advice. Gate does not guarantee the accuracy or completeness of the information and shall not be liable for any losses arising from the use of this information. Virtual asset investments carry high risks and are subject to significant price volatility. You may lose all of your invested principal. Please fully understand the relevant risks and make prudent decisions based on your own financial situation and risk tolerance. For details, please refer to
Disclaimer.
Related Articles
BTC rises 0.52% in 15 minutes: Major capital net inflows to exchanges and multiple market resonance driving the move
2026-03-20 21:15 to 21:30 (UTC), BTC recorded +0.52% return in 15 minutes, with a price range of 70124.0 to 70586.6 USDT, and amplitude of 0.66%. This round of volatility occurred against a backdrop of increased market attention and heightened fluctuations, with both on-chain and market participants showing highly active behavior.
The main driver of this volatility was whale funds (entities holding >=1,000 BTC) making a net inflow of 4,091.39 BTC to exchanges within 24 hours, data significantly exceeding the average for the same period. Concentrated net inflows
GateNews19m ago
Bitcoin Has Stabilized, But Investors Are Paying Up for Downside Protection: VanEck
Bitcoin's volatility has decreased to around $70,000, but traders are still heavily investing in downside protection. Although premiums for puts have dropped, they remain high historically, suggesting caution among investors. This defensiveness may signal an impending price bottom, as similar market conditions in the past have led to recoveries.
Decrypt1h ago
Cardano Flashes Weekly Buy Signal As ADA Holds Key $0.23 Support
Cardano is trying to shake off a bruising stretch of price weakness, and a fresh technical signal is giving traders a reason to pay attention again. Crypto analyst Ali Martinez said ADA has printed a TD Sequential buy signal on the weekly chart, showing a “black 9” that often appears when a
BlockChainReporter2h ago
Ethereum Approaches Cycle Low as Bitmain Indicates Violent Belief
The article explores Ethereum's potential market bottom, highlighting its correlation with past S&P 500 trends and significant institutional investment by Bitmain. Despite mixed market sentiment, historical patterns suggest possible recovery.
CryptoBreaking4h ago
Analyst: If Bitcoin falls below the $66,000 support level, it may trigger a 10%-20% correction
Gate News reported that on March 20, Chartered Market Technician (CMT) Aksel Kibar stated on March 21 that the lower support boundary of Bitcoin's potential rising wedge formation is located at 66,000, and a breakdown below this level could trigger a bearish reversal. Aksel Kibar pointed out that rising wedges, as a classic technical pattern, typically appear at the end of uptrends, signaling price momentum exhaustion. Historical data shows that after similar downside breakdowns are confirmed, the average pullback ranges from 10%-20%.
GateNews5h ago
