
Date: Wed, Dec 31, 2025 | 03:40 PM GMT
As the final hours of 2025 approach, the broader cryptocurrency market is showing modest strength. Both Bitcoin (BTC) and Ethereum (ETH) are trading slightly in the green, helping ease recent volatility and stabilize overall market sentiment. This calmer environment has allowed select altcoins — including Plasma (XPL) — to begin forming constructive technical setups after extended periods of downside pressure.
XPL is starting to attract attention with an impressive 11% daily jump, trimming its 60-day decline to roughly 43%. While the broader trend still reflects recovery mode, the more important signal is emerging on the daily chart, where price action is beginning to suggest a meaningful structural shift. If confirmed, this setup could mark the early stages of a bullish continuation heading into the new year.
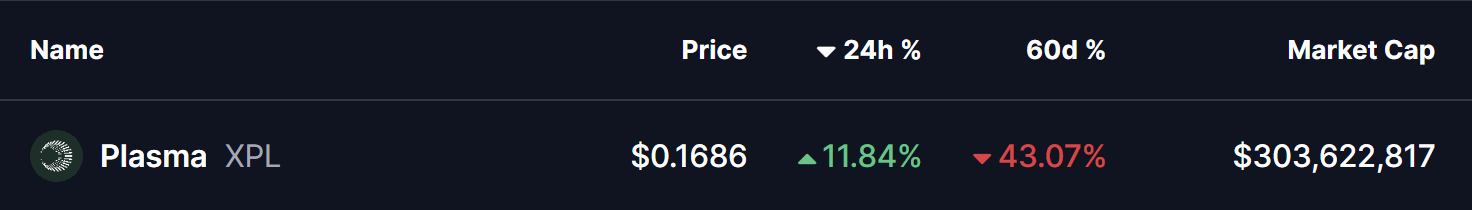
Source: Coinmarketcap
Rounding Bottom in Play
On the daily timeframe, XPL appears to be forming a textbook rounding bottom pattern — a classic bullish reversal structure that typically develops after a prolonged downtrend. This pattern reflects a slow but steady transition from selling dominance to accumulation, as bearish momentum fades and buyers gradually regain control.
Earlier in the trend, XPL faced strong rejection near the $0.3321 neckline zone, triggering a sharp decline that extended through November and December. That sell-off ultimately found a floor near the $0.1152 level, which has since proven to be a critical demand zone. Repeated defenses of this area prevented further downside and laid the foundation for a potential trend reversal.
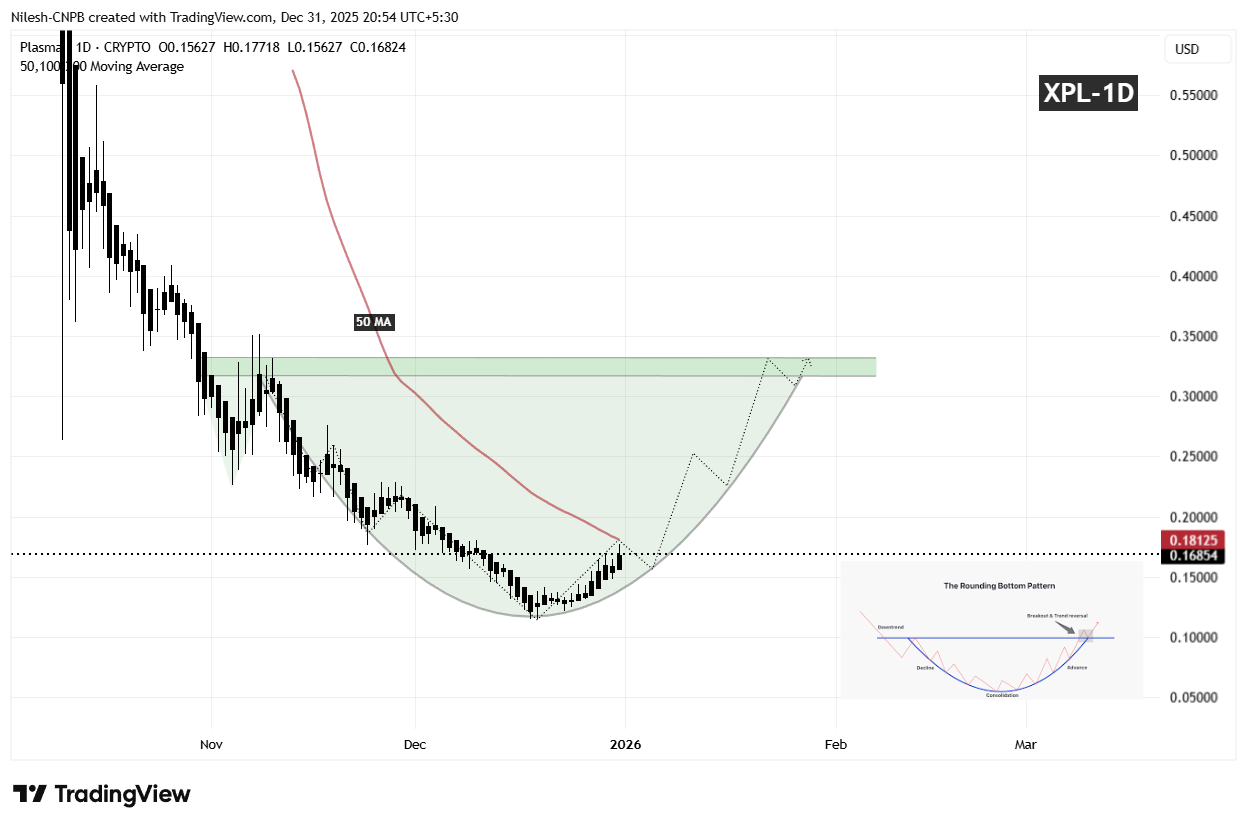
XPL Daily Chart/Coinsprobe (Source: Tradingview)
Since establishing that base, XPL has begun to curve higher in a rounded fashion, mirroring the classic structure of a developing bottom. This gradual recovery suggests that selling pressure is no longer aggressive, and that accumulation is taking place beneath the surface. The recent push back above the $0.16 region further reinforces the idea that buyers are positioning ahead of a larger directional move.
What’s Next for XPL?
For the rounding bottom pattern to gain confirmation, XPL needs to reclaim the 50-day moving average, currently positioned near the $0.1812 level. A sustained move above this area would signal a clear momentum shift and indicate that bulls are regaining control after months of corrective price action.
Looking higher, the most significant technical barrier remains the neckline resistance around $0.3321, highlighted by the prior distribution zone on the chart. A clean breakout above this region would validate the entire reversal structure and could open the door for a broader bullish expansion phase, with momentum traders and sidelined participants likely re-entering the market.
Until those levels are reclaimed, the pattern remains in its development phase. Short-term consolidation or minor pullbacks remain possible if price struggles near the 50-day moving average. However, as long as XPL continues to hold higher lows above the $0.1152 base, the broader bottoming structure remains intact.
Overall, XPL is approaching a technically important inflection point. The emerging rounding bottom formation, improving price structure, and proximity to key resistance levels suggest the coming sessions could prove decisive for Plasma’s next major directional move as the market transitions into 2026.
Disclaimer: The views and analysis presented in this article are for informational purposes only and reflect the author’s perspective, not financial advice. Technical patterns and indicators discussed are subject to market volatility and may or may not yield the anticipated results. Investors are advised to exercise caution, conduct independent research, and make decisions aligned with their individual risk tolerance.
About Author: Nilesh Hembade is the Founder and Lead Author of Coinsprobe, with over 5 years of experience in the cryptocurrency and blockchain industry. Since launching Coinsprobe in 2023, he has been providing daily, research-driven insights through in-depth market analysis, on-chain data, and technical research.
Disclaimer: The information on this page may come from third parties and does not represent the views or opinions of Gate. The content displayed on this page is for reference only and does not constitute any financial, investment, or legal advice. Gate does not guarantee the accuracy or completeness of the information and shall not be liable for any losses arising from the use of this information. Virtual asset investments carry high risks and are subject to significant price volatility. You may lose all of your invested principal. Please fully understand the relevant risks and make prudent decisions based on your own financial situation and risk tolerance. For details, please refer to
Disclaimer.
Related Articles
Bitcoin Rebounds Above $70,000, Asian Tech Stocks Decline and Gold Strength Put Pressure
Bitcoin rebounded above $70,000 on March 20, with a market cap of approximately $1.41 trillion, but gains were limited by declines in tech stocks and rising demand for safe-haven assets. Institutional capital outflows indicate slowing Bitcoin demand, and investors need to monitor market dynamics to assess potential risks.
GateNews1m ago
Bitcoin price reproduces the earlier crash pattern, with $65,800 as a key support level
Bitcoin price trend is similar to last year, currently around 70,335 USD, showing potential market pressure. If it breaks below 65,800 USD, a new round of decline may follow; breaking through the upper band could lead to a rebound. Market sentiment is cautious, investors need to pay attention to key support and resistance levels, while being vigilant about downside risks and preparing for an upside rebound.
GateNews3m ago
Hyperliquid Price Jumps 22% as Commodity Trading Hits Record
Key Insights:
Hyperliquid surged over 20% weekly, driven by record commodity futures trading volumes, especially oil and silver contracts, gaining strong traction among traders.
Whale activity surpassed $3.6 billion in leveraged positions, boosting liquidity and reinforcing upward momentum a
CryptoFrontNews6m ago
Pi Network (PI) signals an early recovery after the new mainnet upgrade
Pi Network's recent upgrade to mainnet version 20 enables smart contract deployment, boosting ecosystem development. However, PI token faces downward pressure, trading below resistance levels with bearish technical indicators. Recovery is dependent on surpassing the $0.1950–$0.2000 resistance zone.
TapChiBitcoin11m ago
Bittensor Holds Strength but Faces Resistance Near $285 Level
Key Insights:
Bittensor maintains strong short-term momentum above key averages, while ETF developments and high staking levels continue shaping liquidity and investor demand dynamics.
Overbought technical indicators signal stretched conditions, even as bullish momentum persists,
CryptoFrontNews16m ago
Cardano’s Chart Just Printed a “Black 9” – Here’s Where ADA Price Could Go Next
Ali Martinez highlights a significant technical signal for Cardano, specifically the TD Sequential indicator showing a "black 9," suggesting a potential price reversal after a prolonged downtrend. If ADA maintains support at $0.23, it could rise to $0.32 and $0.37. However, failure to hold this level might invalidate the bullish setup.
CaptainAltcoin26m ago
