
**Date: **Sun, Jan 04, 2026 | 01:14 PM GMT
As 2026 gets underway, the broader cryptocurrency market is showing renewed stability. Ethereum (ETH) is up nearly 6% on the week, and several major altcoins are beginning to regain momentum. Against this improving backdrop, Hyperliquid (HYPE) is quietly positioning itself as a potential late mover, with its chart structure starting to flash early bullish signals.
While HYPE remains mostly flat on the weekly timeframe, the more important story is unfolding beneath the surface. Recent price action suggests a meaningful structural shift may be underway — one that could mark the early stages of a bullish continuation if key levels are reclaimed.
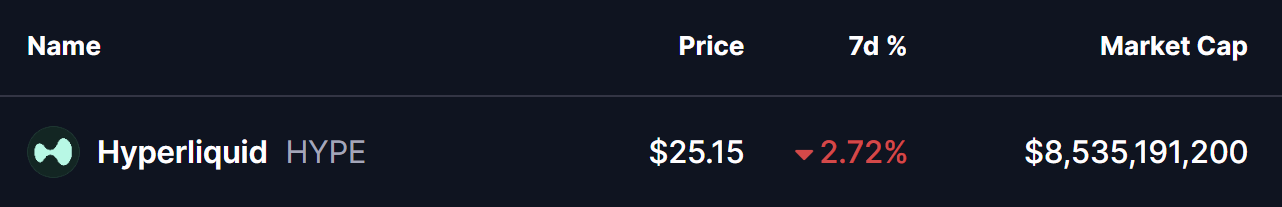
Source: Coinmarketcap
Rounding Bottom Pattern Taking Shape
On the daily timeframe, Hyperliquid appears to be forming a rounding bottom pattern, a classic bullish reversal structure that typically develops after a prolonged corrective phase. This pattern reflects a slow transition from aggressive selling to steady accumulation, as downside momentum fades and buyers gradually step back in.
The setup began after HYPE faced strong rejection near the $51.42–$50.06 neckline resistance zone, which triggered a sharp decline through late November and December. That downside move eventually found strong demand near the $22.20 support level, where selling pressure stalled. Multiple defenses of this area prevented further downside and helped establish a solid base for a potential trend reversal.
Since carving out that bottom, HYPE has started to curve higher in a smooth, rounded fashion — closely matching the textbook structure of a developing rounding bottom. The recent stabilization above the $25 region further supports the view that selling pressure is weakening and accumulation may be underway.
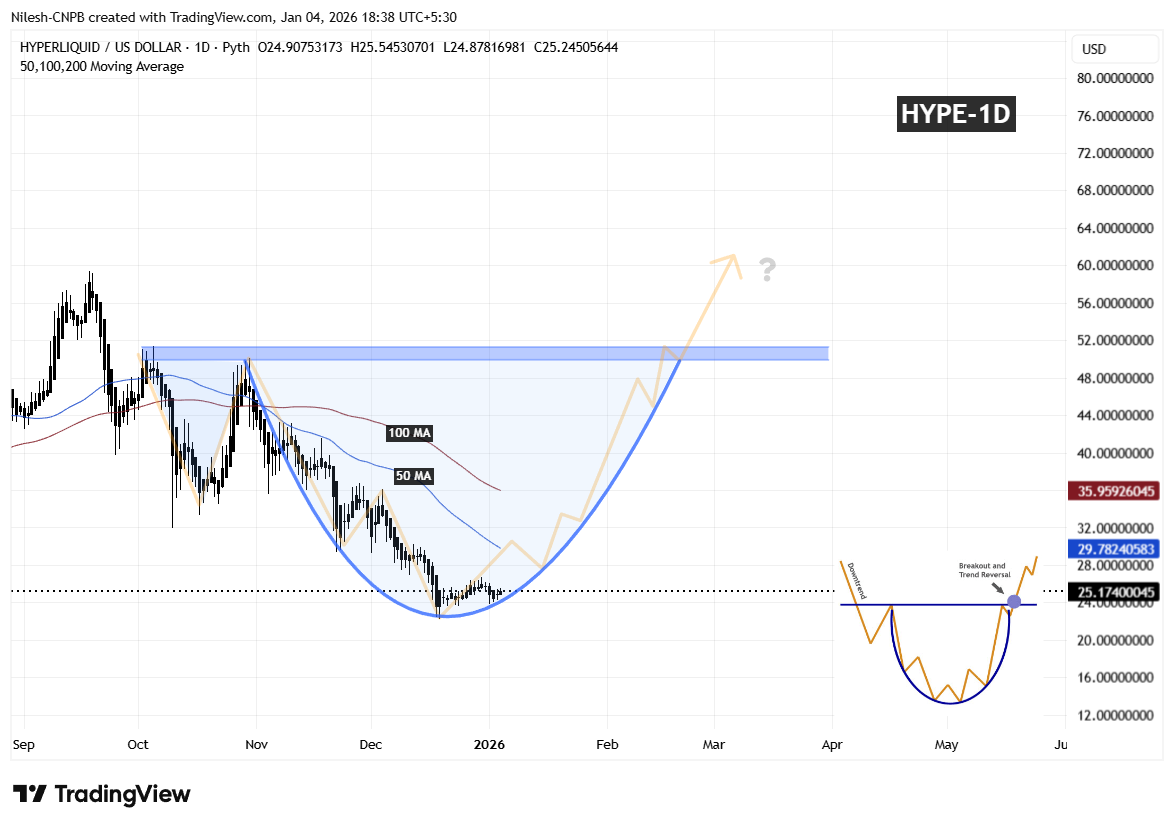
Hyperliquid (HYPE) Daily Chart/Coinsprobe (Source: Tradingview)
A key technical level now comes into play: the 50-day moving average, currently hovering near $29.78. This level has acted as dynamic resistance during the early recovery phase, and reclaiming it would mark an important shift in short-term market structure.
What’s Next for HYPE?
A sustained reclaim of the 50-day MA would be the first meaningful confirmation that buyers are regaining control after months of corrective price action. Holding above this level could allow price to build momentum toward the 100-day MA, which would further reinforce the developing reversal structure.
Looking ahead, the most important level remains the $51.42–$50.06 neckline resistance zone. A clean breakout above this area would validate the entire rounding bottom pattern and could open the door to a broader bullish expansion phase, with momentum traders likely re-entering the market.
In the near term, all eyes remain on the 50-day MA reclaim for upside confirmation. Until that happens, short-term consolidation or shallow pullbacks remain possible. However, as long as price continues to hold above the established base, the broader bottoming structure remains intact and constructive.
Disclaimer: The views and analysis presented in this article are for informational purposes only and reflect the author’s perspective, not financial advice. Technical patterns and indicators discussed are subject to market volatility and may or may not yield the anticipated results. Investors are advised to exercise caution, conduct independent research, and make decisions aligned with their individual risk tolerance.
About Author: Nilesh Hembade is the Founder and Lead Author of Coinsprobe, with over 5 years of experience in the cryptocurrency and blockchain industry. Since launching Coinsprobe in 2023, he has been providing daily, research-driven insights through in-depth market analysis, on-chain data, and technical research.
Disclaimer: The information on this page may come from third parties and does not represent the views or opinions of Gate. The content displayed on this page is for reference only and does not constitute any financial, investment, or legal advice. Gate does not guarantee the accuracy or completeness of the information and shall not be liable for any losses arising from the use of this information. Virtual asset investments carry high risks and are subject to significant price volatility. You may lose all of your invested principal. Please fully understand the relevant risks and make prudent decisions based on your own financial situation and risk tolerance. For details, please refer to
Disclaimer.
Related Articles
Bitcoin Has Stabilized, But Investors Are Paying Up for Downside Protection: VanEck
Bitcoin's volatility has decreased to around $70,000, but traders are still heavily investing in downside protection. Although premiums for puts have dropped, they remain high historically, suggesting caution among investors. This defensiveness may signal an impending price bottom, as similar market conditions in the past have led to recoveries.
Decrypt21m ago
Cardano Flashes Weekly Buy Signal As ADA Holds Key $0.23 Support
Cardano is trying to shake off a bruising stretch of price weakness, and a fresh technical signal is giving traders a reason to pay attention again. Crypto analyst Ali Martinez said ADA has printed a TD Sequential buy signal on the weekly chart, showing a “black 9” that often appears when a
BlockChainReporter1h ago
Ethereum Approaches Cycle Low as Bitmain Indicates Violent Belief
The article explores Ethereum's potential market bottom, highlighting its correlation with past S&P 500 trends and significant institutional investment by Bitmain. Despite mixed market sentiment, historical patterns suggest possible recovery.
CryptoBreaking3h ago
Analyst: If Bitcoin falls below the $66,000 support level, it may trigger a 10%-20% correction
Gate News reported that on March 20, Chartered Market Technician (CMT) Aksel Kibar stated on March 21 that the lower support boundary of Bitcoin's potential rising wedge formation is located at 66,000, and a breakdown below this level could trigger a bearish reversal. Aksel Kibar pointed out that rising wedges, as a classic technical pattern, typically appear at the end of uptrends, signaling price momentum exhaustion. Historical data shows that after similar downside breakdowns are confirmed, the average pullback ranges from 10%-20%.
GateNews5h ago
Bitcoin Slips Below $70,000 as Fed Rate Pause and Oil Surge Pressure Markets
Bitcoin declined to $70,000 due to steady interest rates from the Federal Reserve and rising energy prices, leading to $600 million in liquidations and increased market volatility, particularly affecting altcoins.
CryptoBreaking5h ago
