
Date: Tue, Dec 30, 2025 | 06:35 PM GMT
The broader cryptocurrency market is showing modest strength, with both Bitcoin (BTC) and Ethereum (ETH) trading in the green. This steady performance among major assets has helped stabilize overall market sentiment, creating room for select altcoins — including** eCash (XEC) **— to develop constructive technical setups.
XEC is trading with modest gains, but more importantly, its price structure is beginning to reflect a meaningful shift, as the chart now points toward a potential bullish continuation setup forming beneath key resistance.
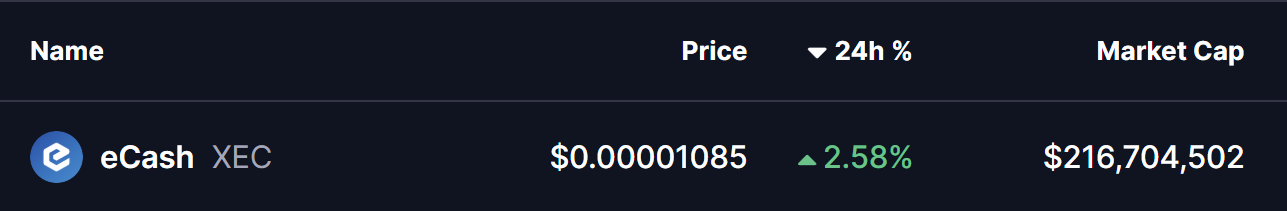
Source: Coinmarketcap
Rounding Bottom in Play
On the 4-hour timeframe, eCash is forming a textbook rounding bottom — a classic bullish reversal pattern that typically emerges after prolonged selling pressure. This structure reflects a slow but steady transition from distribution to accumulation, where sellers gradually lose control and buyers begin stepping in with conviction.
Earlier, XEC faced strong rejection near the $0.00001221 neckline zone, which triggered a sharp decline. That sell-off eventually found support near the $0.000010 region, a level that repeatedly acted as a demand zone. Each attempt to push price lower was absorbed, preventing a deeper breakdown and helping establish a rounded base.
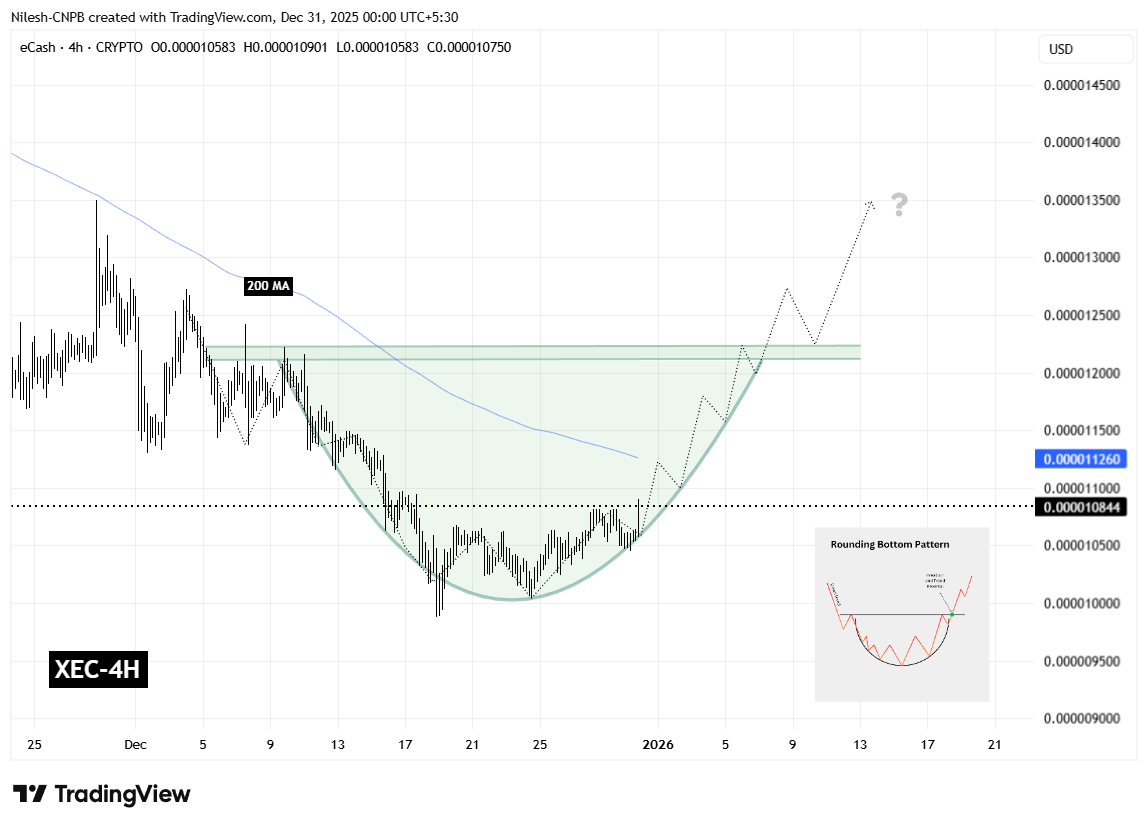
eCash (XEC) 4H Chart/Coinsprobe (Source: Tradingview)
Since then, XEC’s price action has started to curve higher in a smooth, controlled manner. The gradual recovery toward the $0.00001221 resistance suggests selling pressure is fading, while accumulation continues to strengthen. This type of rounded structure often precedes a more decisive trend shift once key resistance levels are reclaimed.
What’s Next for XEC?
For the rounding bottom pattern to fully activate, XEC must reclaim the 200-hour moving average, currently hovering near the $0.00001126 region. A decisive break and sustained hold above this level would confirm a momentum shift and signal that buyers are regaining control after an extended corrective phase.
Beyond the moving average, the most critical hurdle remains the neckline resistance around $0.00001221. A clean breakout above this zone would validate the broader reversal structure and could open the door for a bullish expansion toward the $0.00001442 region, which aligns with the projected breakout target from the rounding bottom pattern.
Until these levels are reclaimed, the setup remains in development. Short-term pullbacks or sideways consolidation are still possible if price struggles near the 200-hour MA. However, as long as XEC continues to hold above the rounded base, the broader bottoming structure remains intact.
Overall, eCash is approaching an important technical inflection point. The emerging rounding bottom, improving price structure, and proximity to major resistance levels suggest the coming sessions could play a decisive role in shaping XEC’s next directional move.
Disclaimer: The views and analysis presented in this article are for informational purposes only and reflect the author’s perspective, not financial advice. Technical patterns and indicators discussed are subject to market volatility and may or may not yield the anticipated results. Investors are advised to exercise caution, conduct independent research, and make decisions aligned with their individual risk tolerance.
Disclaimer: The information on this page may come from third parties and does not represent the views or opinions of Gate. The content displayed on this page is for reference only and does not constitute any financial, investment, or legal advice. Gate does not guarantee the accuracy or completeness of the information and shall not be liable for any losses arising from the use of this information. Virtual asset investments carry high risks and are subject to significant price volatility. You may lose all of your invested principal. Please fully understand the relevant risks and make prudent decisions based on your own financial situation and risk tolerance. For details, please refer to
Disclaimer.
Related Articles
「刻舟求劍」式幣價預測走紅,玄學預言的實戰邏輯與缺陷
作者:Frank,PANews
每當市場進入不上不下的迷惘階段,就會有人試圖用「刻舟求劍」式的歷史回溯方法去預測下一段走勢。在這種情況下,人們往往能從這些理論和圖表中看到歷史總是在重演,並似乎自動將未來一段時間的行情走勢與過去的某一段進行重疊驗證。
這種重合似乎有著神奇的效果,也常常被驗證。有部落客自稱這種預測的準確率能到達 75%~80% 。
這種在社群媒體上屢屢爆紅的「刻舟求劍」式價格預測,究竟是在幫助市場識別階段,還是在把噪音包裝成預言?
從「滴答分形」到「歷史押韻」
關於 2025 年 10 月市場頂點預測的巔峰操作是名為 CryptoBullet 的分析師,他所創建的一種名為「ti
区块客28m ago
Dogecoin (DOGE) Prints Abnormal $0 as Short Sellers Disappear - U.Today
Dogecoin's recent rally saw $0 in short liquidations, indicating traders were betting long. Despite a 4.61% decline due to market pullback, volume remained high. The potential for DOGE to reach $0.10 depends on Bitcoin's recovery.
UToday48m ago
Bitcoin Holds Steady Amid Middle East Escalation
Bitcoin demonstrates resilience at $70K amid geopolitical tensions in the Middle East, with declining exchange-held Bitcoin indicating investor confidence. Market reactions reflect a growing stability, despite volatility from conflict risks.
CryptoFrontNews1h ago
Liệu Dogecoin có chững lại trong một phạm vi giá kéo dài nhiều tuần bất chấp đợt tăng giá 15%?
Dogecoin (DOGE) has successfully defended the crucial support level of $0.088 despite recent selling pressure, aided by Bitcoin's recovery. While DOGE saw a significant 15% increase recently, long-term trends remain bearish. Rising social media interactions and potential short liquidations could drive short-term growth, but long-term recovery may require surpassing $0.127.
TapChiBitcoin2h ago
Analyst Says XRP Is ‘Criminally Undervalued’ as RSI Drops
Analyst says XRP RSI reached oversold levels last seen during the 2022 bear market bottom.
XRP trades near $1.39 with key support at $1.30–$1.35 and resistance between $1.45 and $1.70.
Price has declined from about $3.10 since Sept 2025, forming a prolonged downward trend.
XRP trades near
CryptoFrontNews2h ago
Shiba Inu Death Cross Appears on Daily Chart as Price Loses Support - U.Today
Shiba Inu (SHIB) is battling bearish pressure that threatens to undo its over 8.85% weekly gains. In the last 24 hours, the meme coin’s price and volume flipped negative as it recorded a death cross on its charts.
Death cross signals weakening momentum for Shiba Inu
For context, a death cross eme
UToday3h ago