
Date: Wed, Dec 31, 2025 | 09:30 AM GMT
As the final day of 2025 arrives, the broader cryptocurrency market is showing modest strength, with both Bitcoin (BTC) and Ethereum (ETH) trading slightly in the green. This steady performance among major assets has helped stabilize overall market sentiment, creating room for select altcoins — including Chiliz (CHZ) — to develop constructive technical setups.
CHZ is standing out with an impressive 18% daily gain. More importantly, price action has confirmed a technically significant breakout, strengthening the case for further upside in the near term.
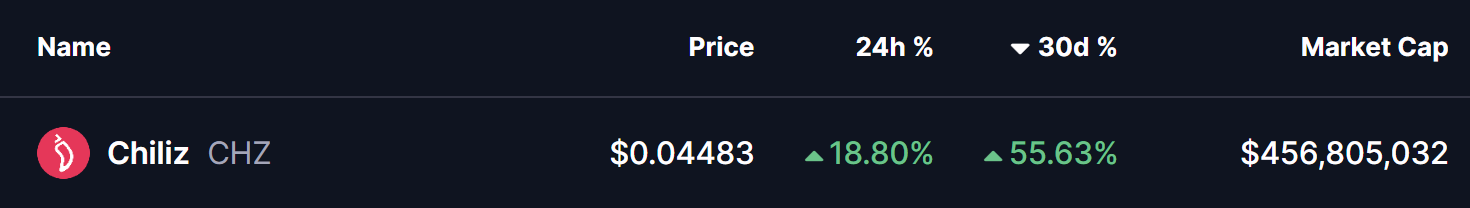
Source: Coinmarketcap
Descending Channel Breakout
On the daily chart, Chiliz had been trapped inside a well-defined descending channel since its early December peak near the $0.051 region. This structure was marked by a series of lower highs and lower lows, reflecting persistent bearish pressure that gradually pushed CHZ down toward the $0.028 support area.
That bearish phase now appears to be ending. After reclaiming the 200-day moving average, CHZ decisively broke above the upper boundary of the descending channel near the $0.04451 level. This breakout signals a meaningful shift in market control, with buyers stepping back in after weeks of compression.
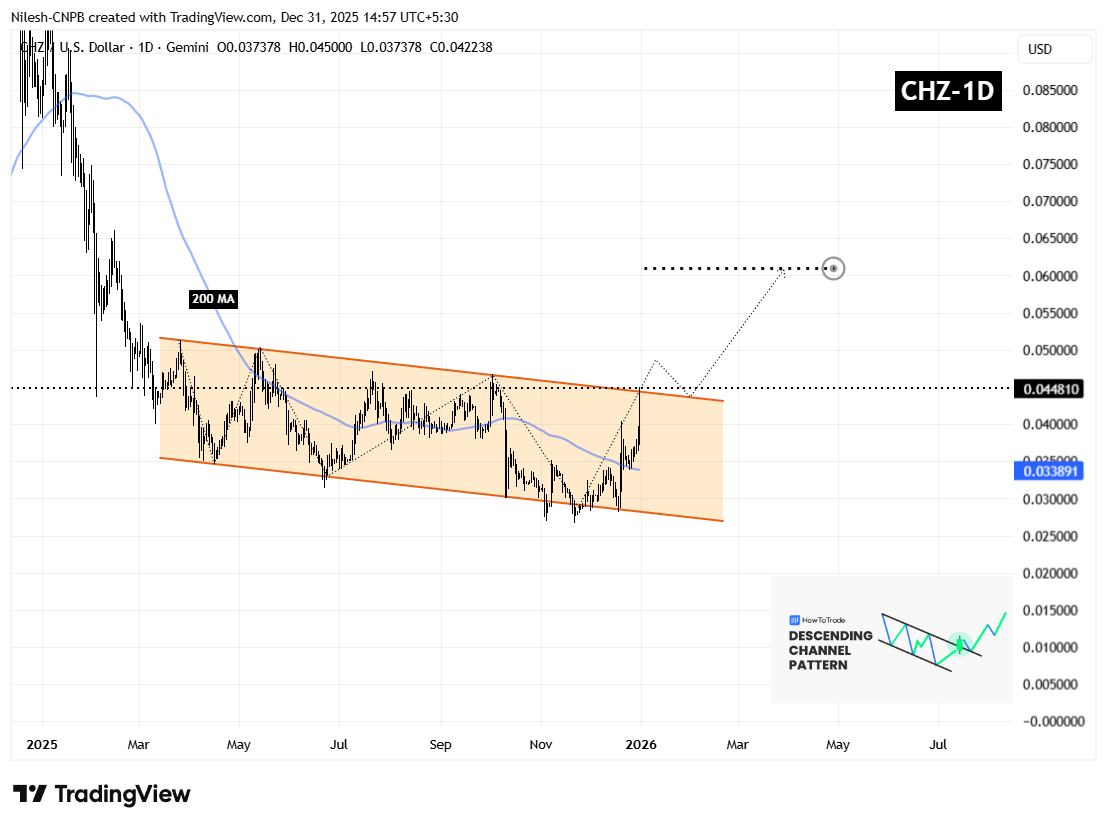
Chiliz (CHZ) Daily Chart/Coinsprobe (Source: Tradingview)
What’s Next for CHZ?
Following a breakout of this nature, short-term volatility is normal. A brief pullback toward the former resistance zone is often considered healthy. For CHZ, the $0.04451 area now stands as a critical support level. A successful retest of this zone, followed by renewed buying interest, would further validate the breakout and strengthen the bullish structure.
If buyers continue to defend reclaimed levels, the chart’s measured move points toward a potential upside target near the $0.06101 region. This would represent roughly a 35% advance from the breakout zone and aligns closely with the projected extension visible on the chart.
On the downside, a failure to hold above the breakout level could slow momentum and lead to consolidation. A sustained move back inside the descending channel would weaken the bullish outlook and delay any upside continuation. However, as long as CHZ remains above reclaimed resistance and the 200-day moving average, the broader technical structure favors higher prices in the sessions ahead.
For now, the breakout remains in its early stages, but CHZ appears well-positioned to extend its recovery move if overall market conditions remain supportive.
Disclaimer: The views and analysis presented in this article are for informational purposes only and reflect the author’s perspective, not financial advice. Technical patterns and indicators discussed are subject to market volatility and may or may not yield the anticipated results. Investors are advised to exercise caution, conduct independent research, and make decisions aligned with their individual risk tolerance.
About Author: Nilesh Hembade is the Founder and Lead Author of Coinsprobe, with over 5 years of experience in the cryptocurrency and blockchain industry. Since launching Coinsprobe in 2023, he has been providing daily, research-driven insights through in-depth market analysis, on-chain data, and technical research.

Disclaimer: The information on this page may come from third parties and does not represent the views or opinions of Gate. The content displayed on this page is for reference only and does not constitute any financial, investment, or legal advice. Gate does not guarantee the accuracy or completeness of the information and shall not be liable for any losses arising from the use of this information. Virtual asset investments carry high risks and are subject to significant price volatility. You may lose all of your invested principal. Please fully understand the relevant risks and make prudent decisions based on your own financial situation and risk tolerance. For details, please refer to
Disclaimer.
Related Articles
TAO Price Explodes 140% in 6 Weeks, But Bittensor’s Social Data Says the Rally Is Just Getting Started
Bittensor has been one of the hardest‑charging assets in crypto in recent weeks. The TAO price pumped 140% in six weeks, and climbed 105% since March 8 alone. The token now has a $2.9 billion market cap, which means it’s ranking 26 overall, as capital rotates toward decentralized machine
CaptainAltcoin15m ago
TAO surges 140%, low retail FOMO turns into a bullish signal
Bittensor (TAO) recently surged by 140%, reaching a high of $377.8, mainly driven by capital rotation in AI-themed investments and supported by solid fundamentals. Although community discussion volume has increased, retail sentiment remains relatively calm, indicating potential upside. The total staked amount on TAO's subnet has risen from $74,400 to over $620 million, reflecting investor confidence in its future.
MarketWhisper15m ago
Is there hidden risk behind Bitcoin holding steady at $70,000? Two major indicators weaken, reducing upward momentum.
Amid increasing geopolitical conflicts and macroeconomic uncertainties, Bitcoin remains steady at $70,000, demonstrating resilience. However, the decline in CEX premiums and slowing ETF capital flows indicate that institutional investors are becoming more cautious, and the market may enter a period of consolidation.
GateNews21m ago
Nick Carter: Bitcoin's quantum resistance lags behind; Ethereum may lead a bullish divergence
Nick Carter warns that Bitcoin is lagging in quantum resistance, emphasizing that its use of elliptic curve cryptography will become outdated and recommending a redesign of replaceable encryption technologies. In contrast, Ethereum has developed a post-quantum upgrade roadmap through 2029 and considers it a top priority. Google also predicts that quantum threats will become a reality before 2029, posing a risk to blockchain security.
MarketWhisper24m ago
Crypto Fear & Greed Index drops to 10, market "fear" sentiment rises
BlockBeats News, March 26 — According to Alternative data, today’s cryptocurrency Fear and Greed Index is 10 (yesterday was 14), indicating increased market "fear" sentiment.
Note: The Fear and Greed Index threshold is 0-100, composed of indicators: volatility (25%), market trading volume (25%), social media activity (15%), market surveys (15%), Bitcoin’s proportion in the overall market (10%), and Google trending searches analysis (10%).
BlockBeatNews26m ago
Pi coin's 7-month low-volatility period has ended; an 108% rebound in volatility signals a major market move.
Pi Network (PI) is currently trading at approximately $0.1883, facing increased volatility and a decreasing correlation with Bitcoin. Recently, volatility has risen from 52% to 108%, indicating the end of the past seven months of compression and the potential for a significant move. However, the correlation coefficient between PI and Bitcoin has dropped to -0.30, suggesting that PI has not benefited from Bitcoin's upward trend. Technical analysis shows that if the price falls below $0.1894, it could drop to $0.1300, while holding above $0.2103 may lead to a rebound toward $0.2442.
MarketWhisper48m ago
