Lighter (LIT) – the underlying token of the decentralized perpetual contract exchange just launched – is still in the process of finding equilibrium after a lively startup phase thanks to the airdrop program. Although there was a slight adjustment immediately upon listing, LIT maintained a price around $2.73, with post-listing performance exceeding market expectations.
Despite new supply continuously entering the exchange, LIT’s price remains above the post-listing lows. Buying pressure has appeared, but market sentiment remains cautious and not yet confident.
The question now is: Is the current price zone truly a solid support level, or just a temporary cushion before sellers regain control of the trend?
Capital flow shows initial positive signals
Early capital flow indicators are reflecting a trend of funds returning whenever the price adjusts.
Chaikin Money Flow (CMF) – a measure of large capital inflows or outflows based on volume pressure – has shown an upward trend on the 15-minute chart, even as prices dipped slightly from December 30–31. This is a significant bullish divergence, indicating large investors are quietly absorbing supply as the market cools down, especially amid the strong selling pressure often seen after an airdrop.
 Capital continues to flow in | Source: Lighter.XYZMoney Flow Index (MFI) – which tracks buying pressure through price and volume – also shows a similar trend: MFI continuously makes new highs while prices remain slightly down. This reflects buying activity during price dips and support from retail investors during the Lighter sell-off.
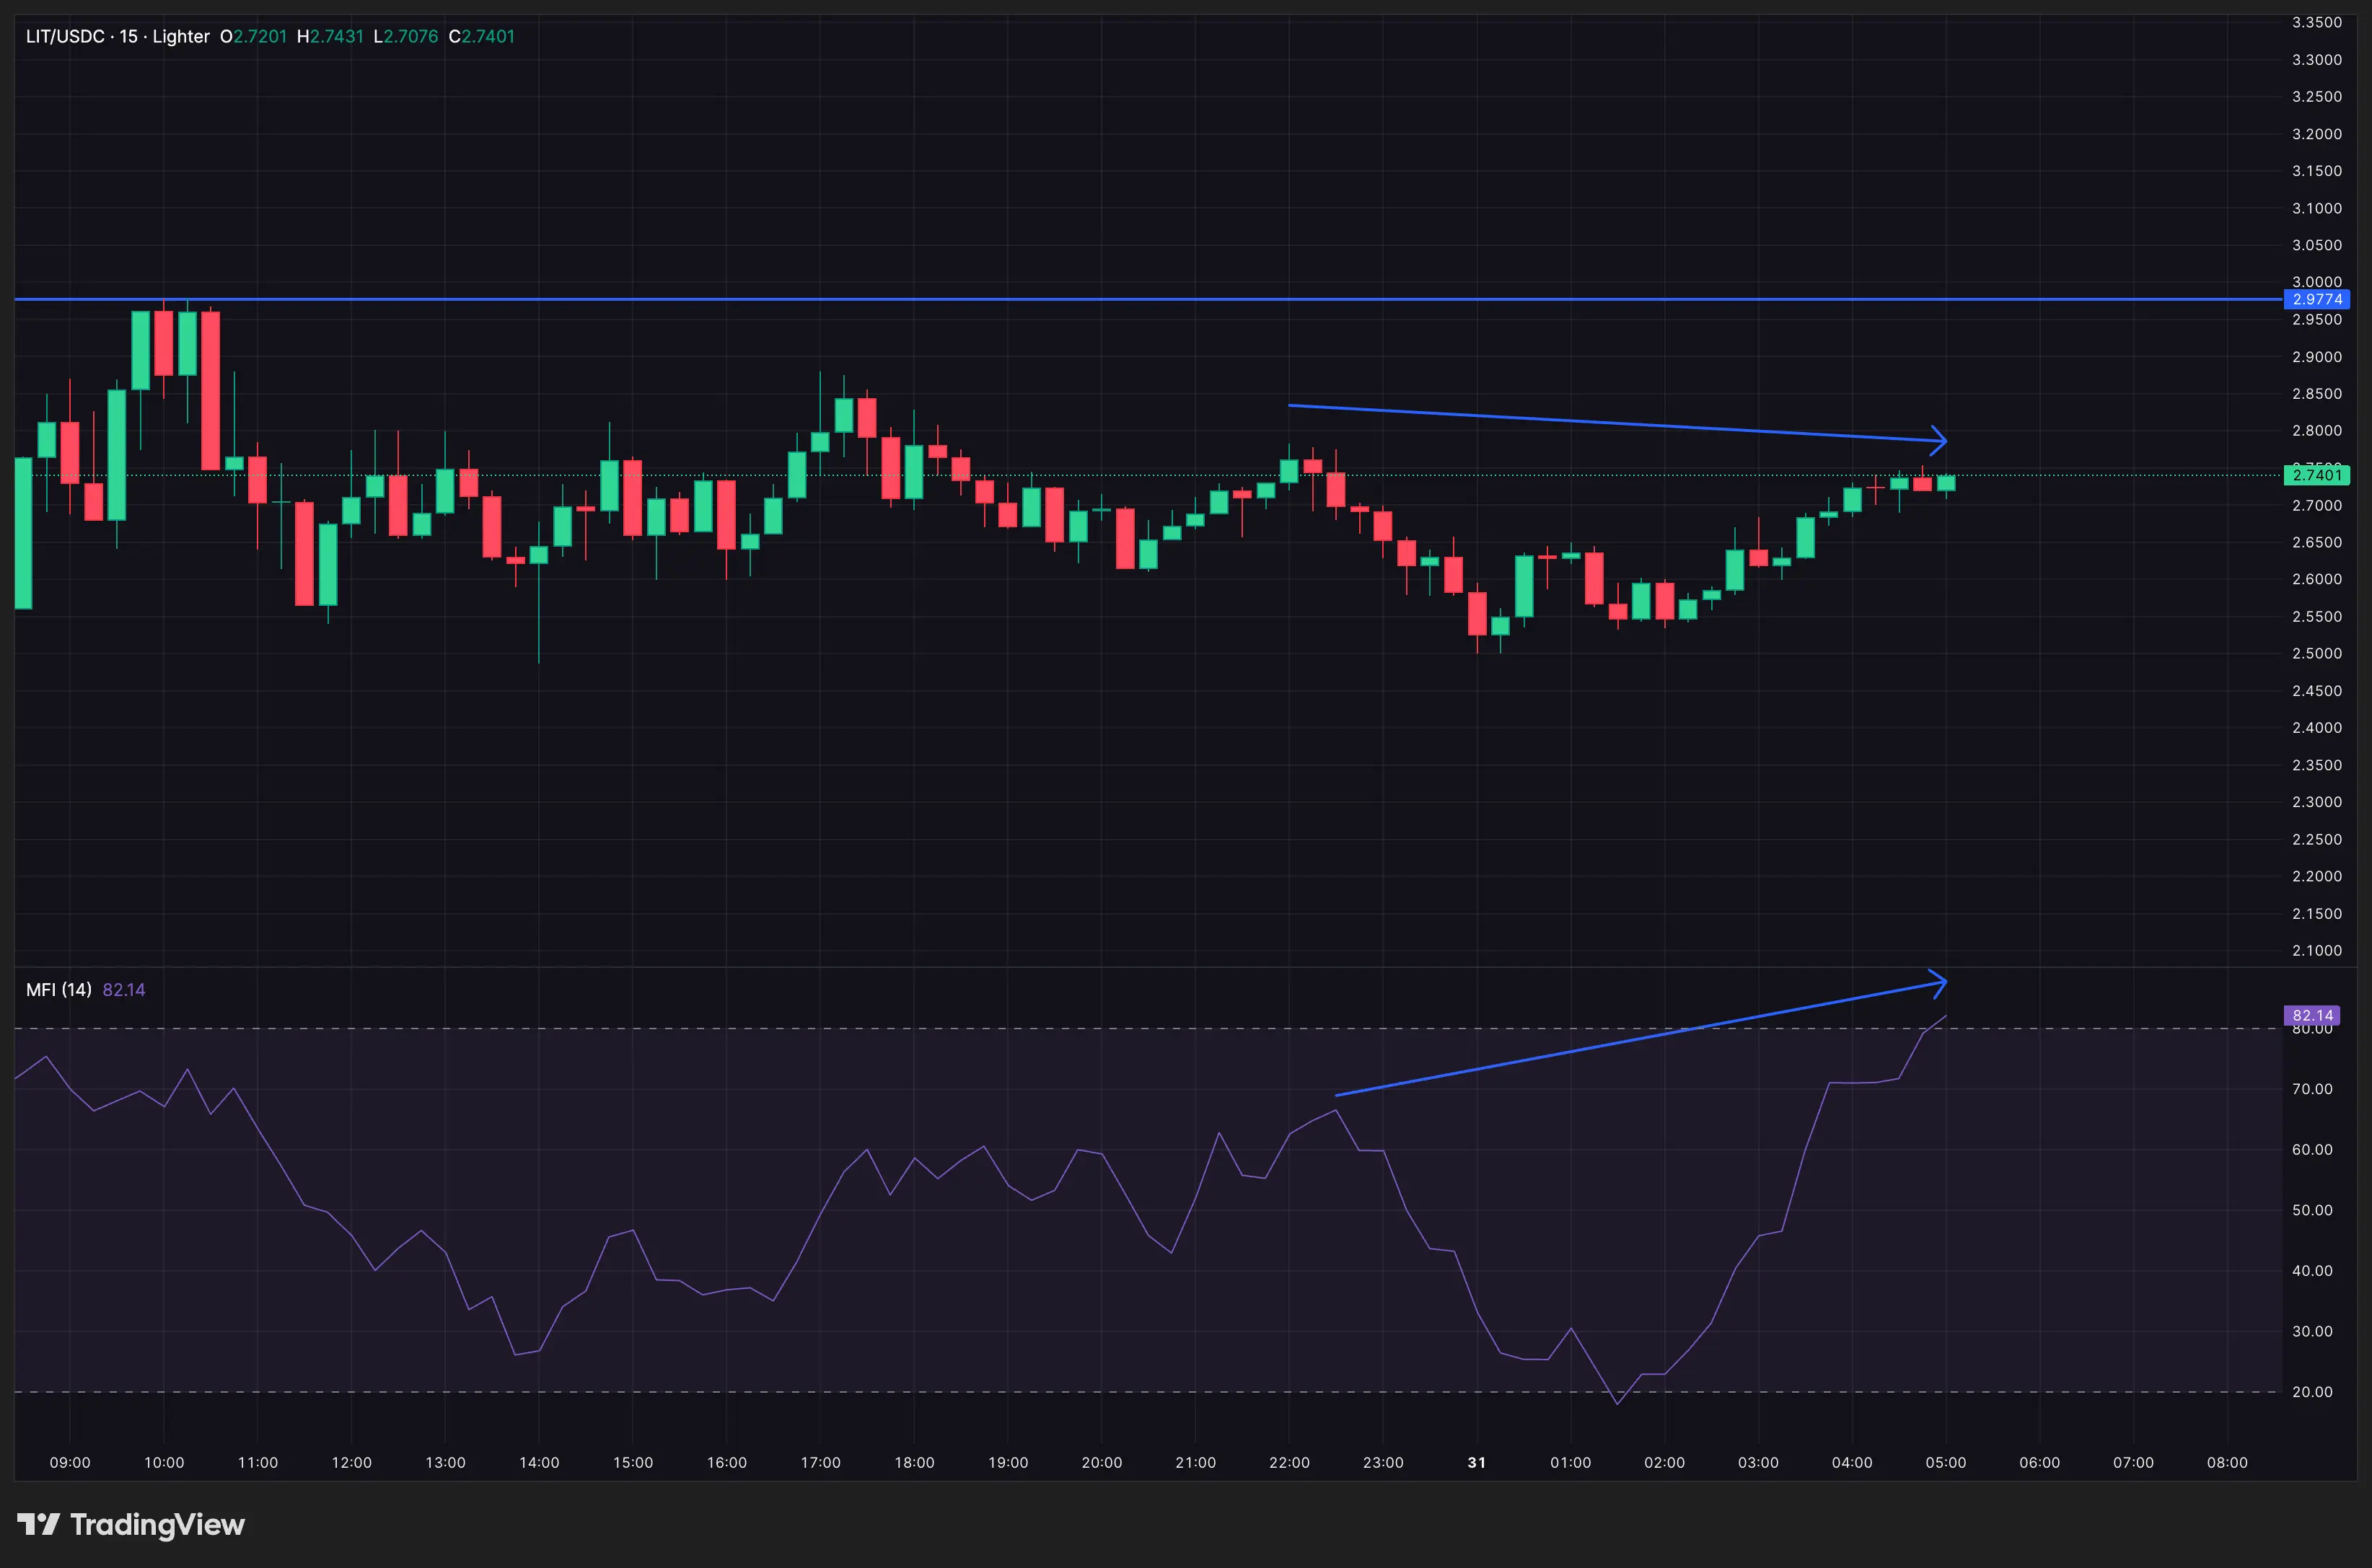 Retail investors buy the dip of LIT| Source: Lighter.XYZThe double divergence in CMF and MFI is very significant. It indicates that selling pressure from airdropped tokens is being absorbed by new capital, rather than leading to capitulation. The continuous buying by large wallets after listing further reinforces this positive signal, aligning with the upward trend of CMF.
If capital flow continues, Lighter’s price could potentially move toward higher levels.
Conversely, if CMF reverses downward below the support zone and MFI loses momentum (especially when overbought), the supporting argument will weaken.
Short-term strength: Present but needs confirmation
On shorter timeframes, the initial price structure shows areas where buying needs to be protected.
LIT is still trading above VWAP (Volume Weighted Average Price) on the 15-minute chart. VWAP reflects a fair value in real-time, and holding above VWAP signals that buyers are controlling the trend during the session. Each time the price tests VWAP around $2.62, it receives strong buying support.
This indicates that lower price zones are being actively absorbed, just as the MFI divergence predicted.
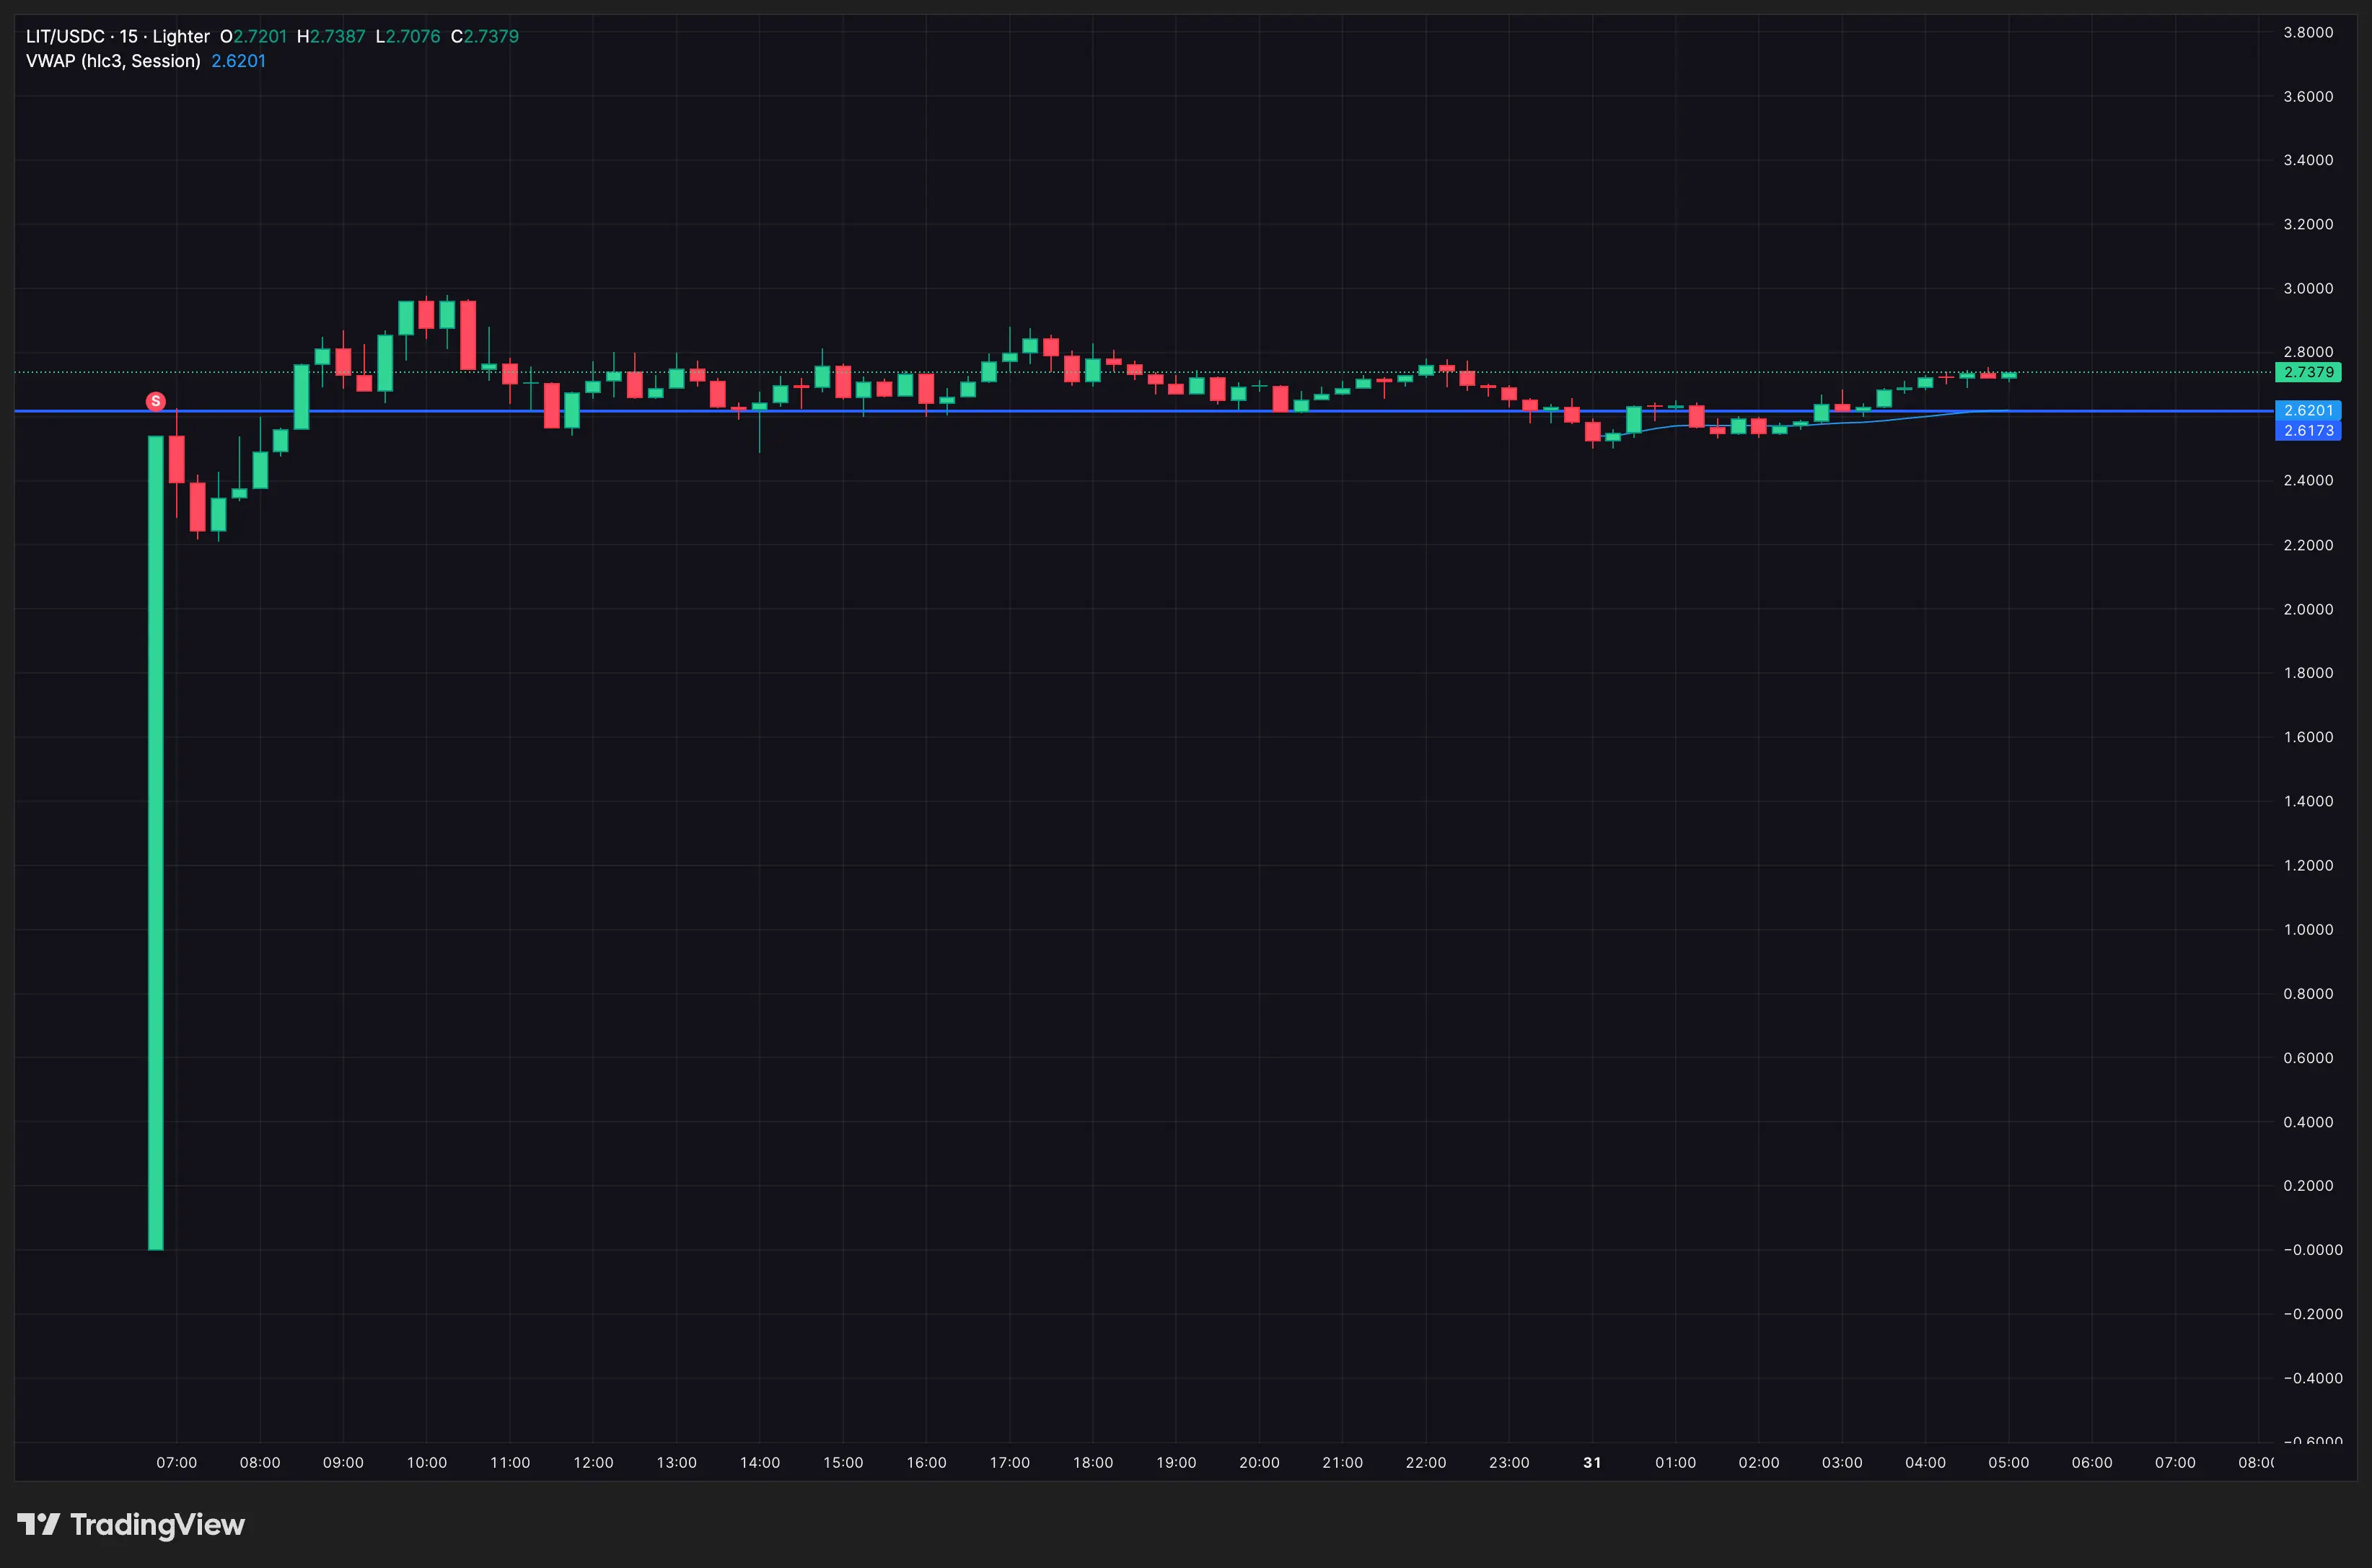 VWAP acts as support | Source: Lighter.XYZHowever, the market still lacks a crucial confirmation factor.
On-Balance Volume (OBV) (OBV) on the 1-hour chart – which measures volume flow relative to price – remains below the downtrend line. This suggests that capital inflow has begun, but trading volume has not yet fully consensus. Selling pressure from LIT is still restraining upward movement.
Until OBV breaks above the downtrend line, upward attempts may face obstacles before a true breakout.
If OBV surpasses the trendline combined with VWAP remaining supported, the price structure will shift from defensive to building a new trend. Closing above $3.08 would be the first signal that buyers are ready to conquer higher levels.
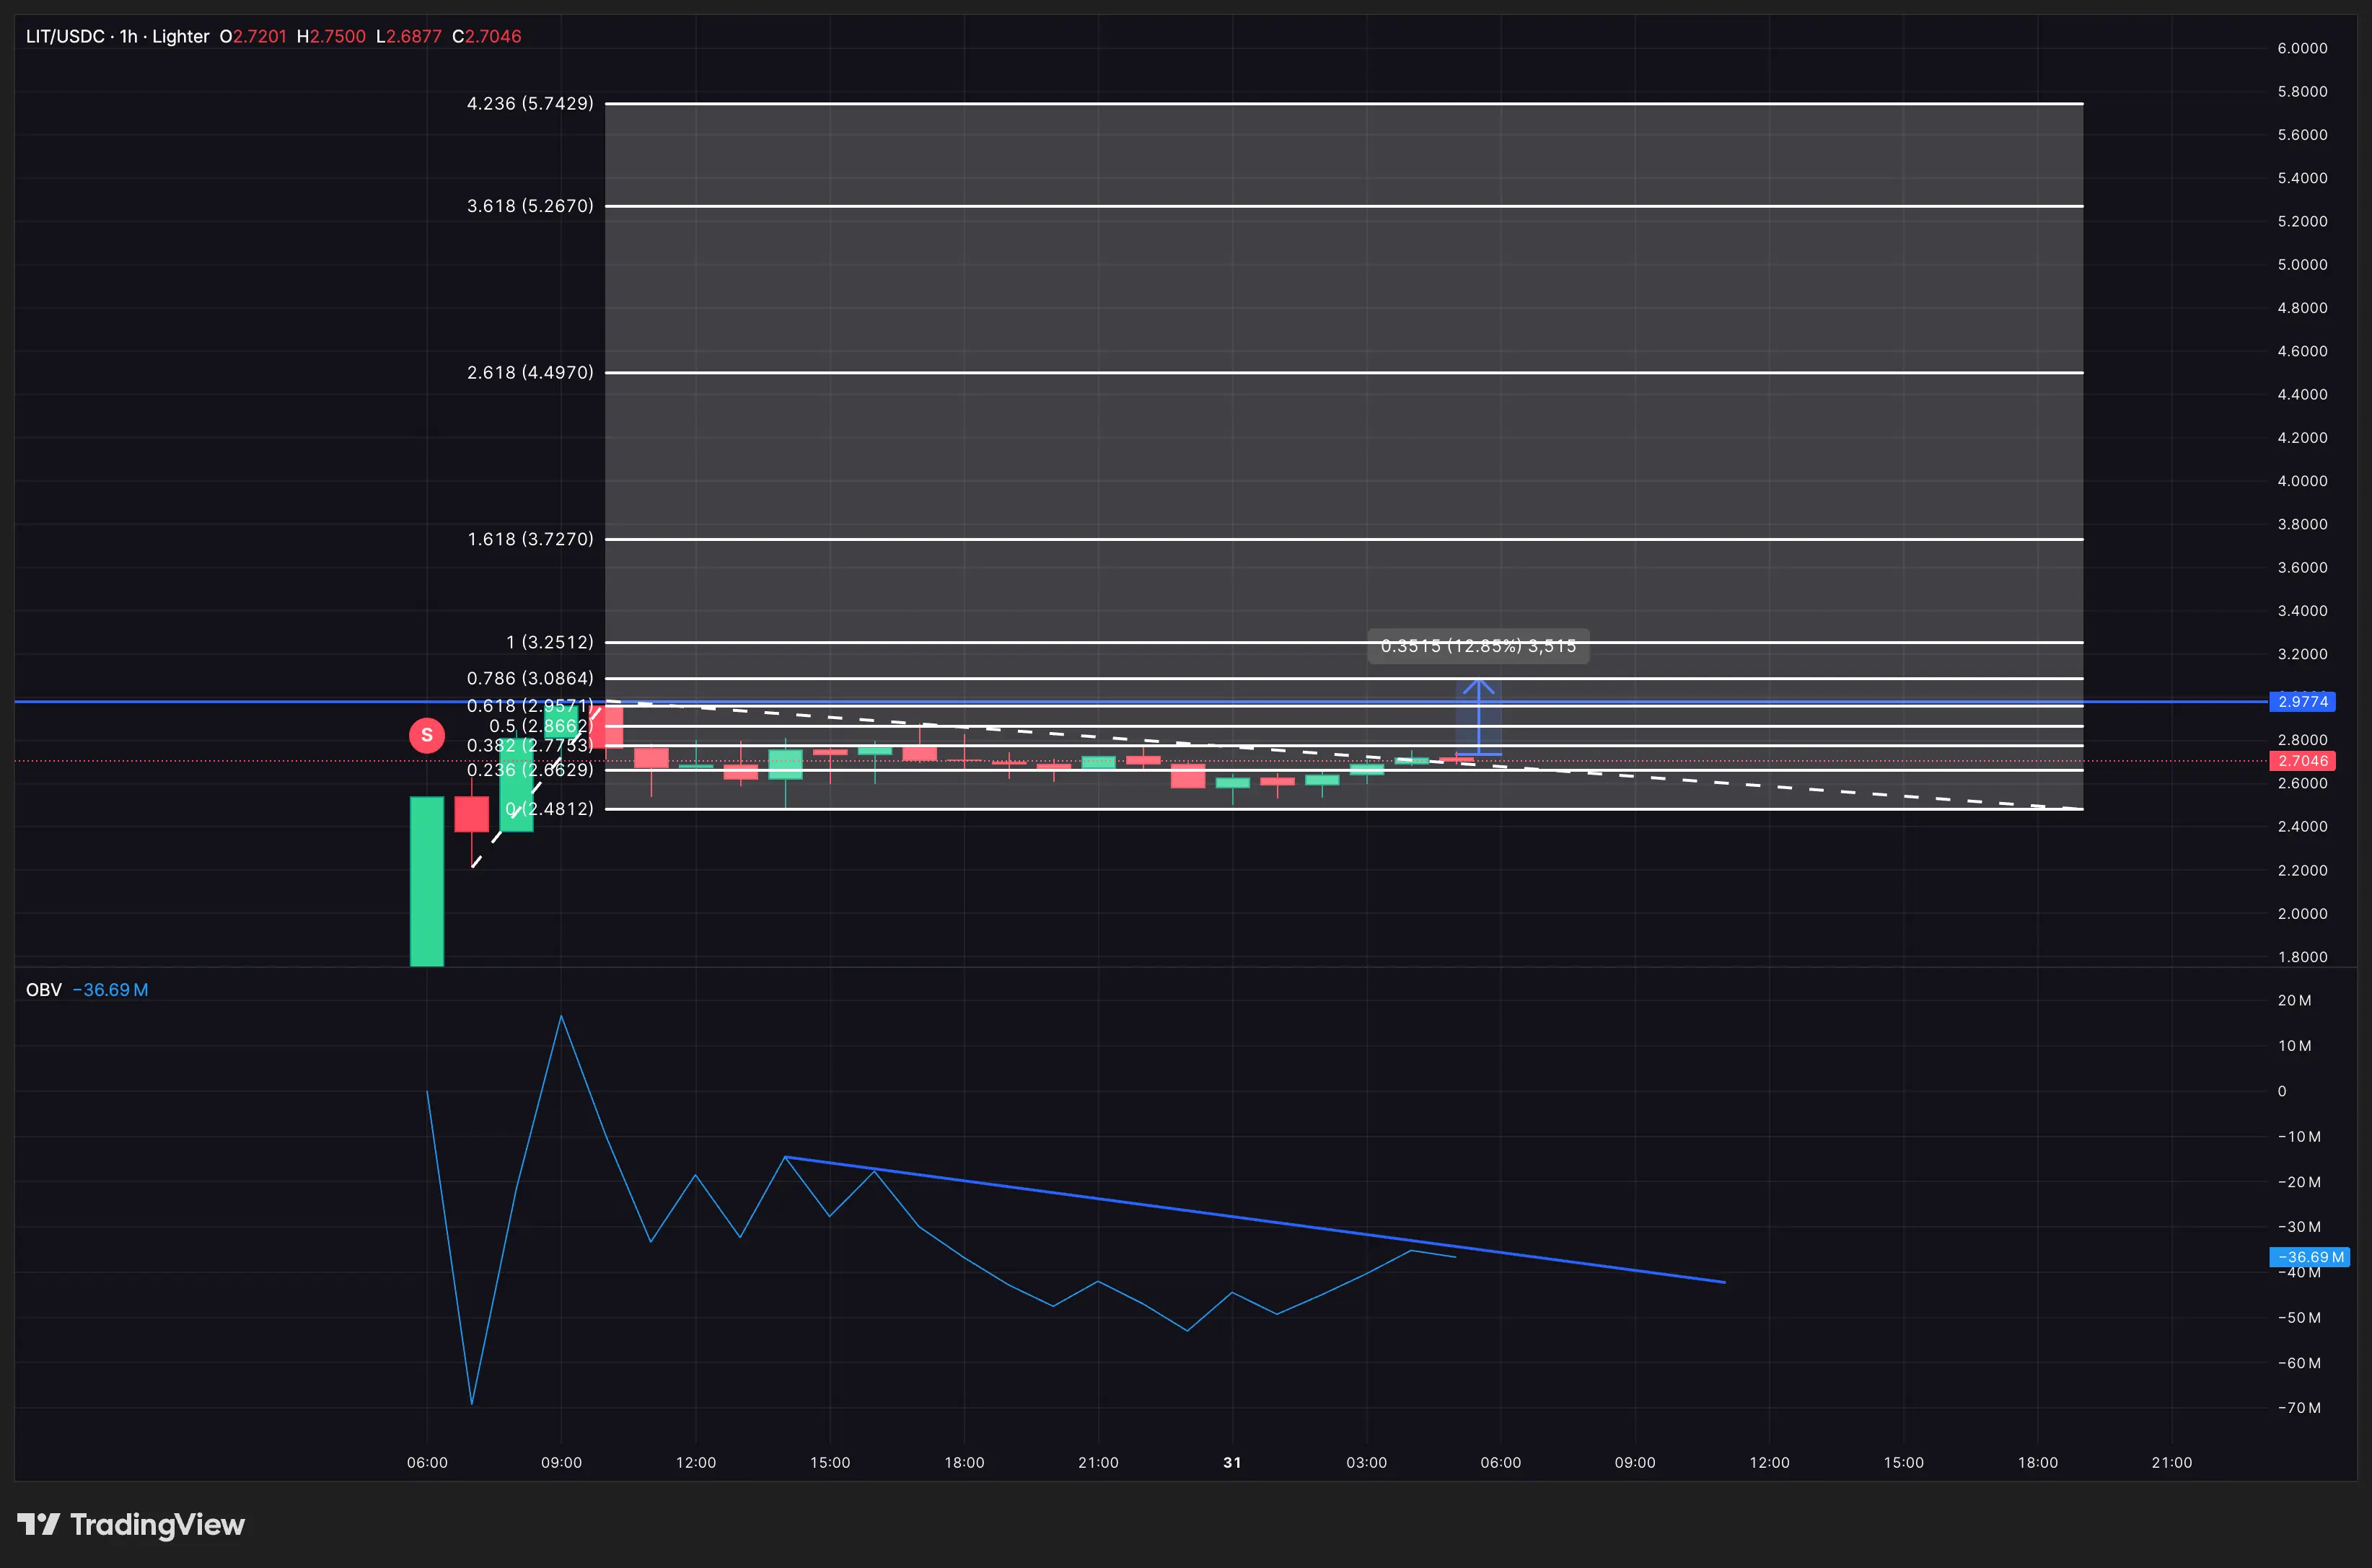 OBV confirmation needed | Source: Lighter.XYZIf sustained above this level, LIT could continue toward targets of $3.25 and $3.72 – corresponding to Fibonacci extension zones above the recent peak near $2.97.
Key price zones that will determine Lighter’s first trend
Currently, LIT is moving within a narrow decision zone, mainly trading between $2.48 and $2.77. Successfully defending the $2.62 level on lower timeframes (VWAP) and the $2.48 level on higher timeframes will maintain the bullish structure. If it breaks above $3.08 with confirmation from OBV, the chart will shift from initial support to a potentially expanding structure, and the price could reach the $3.25–$3.72 zone if trading volume supports it.
Conversely, if the $2.48 level is broken with a bearish close on the 1-hour chart, downside scenarios will emerge. If CMF and MFI turn downward and OBV remains below the trendline, the market structure will shift from support to vulnerability. Breaking below $2.48 opens the door to lower levels such as $2.38 and $2.07, especially if post-listing liquidity is withdrawn under selling pressure.
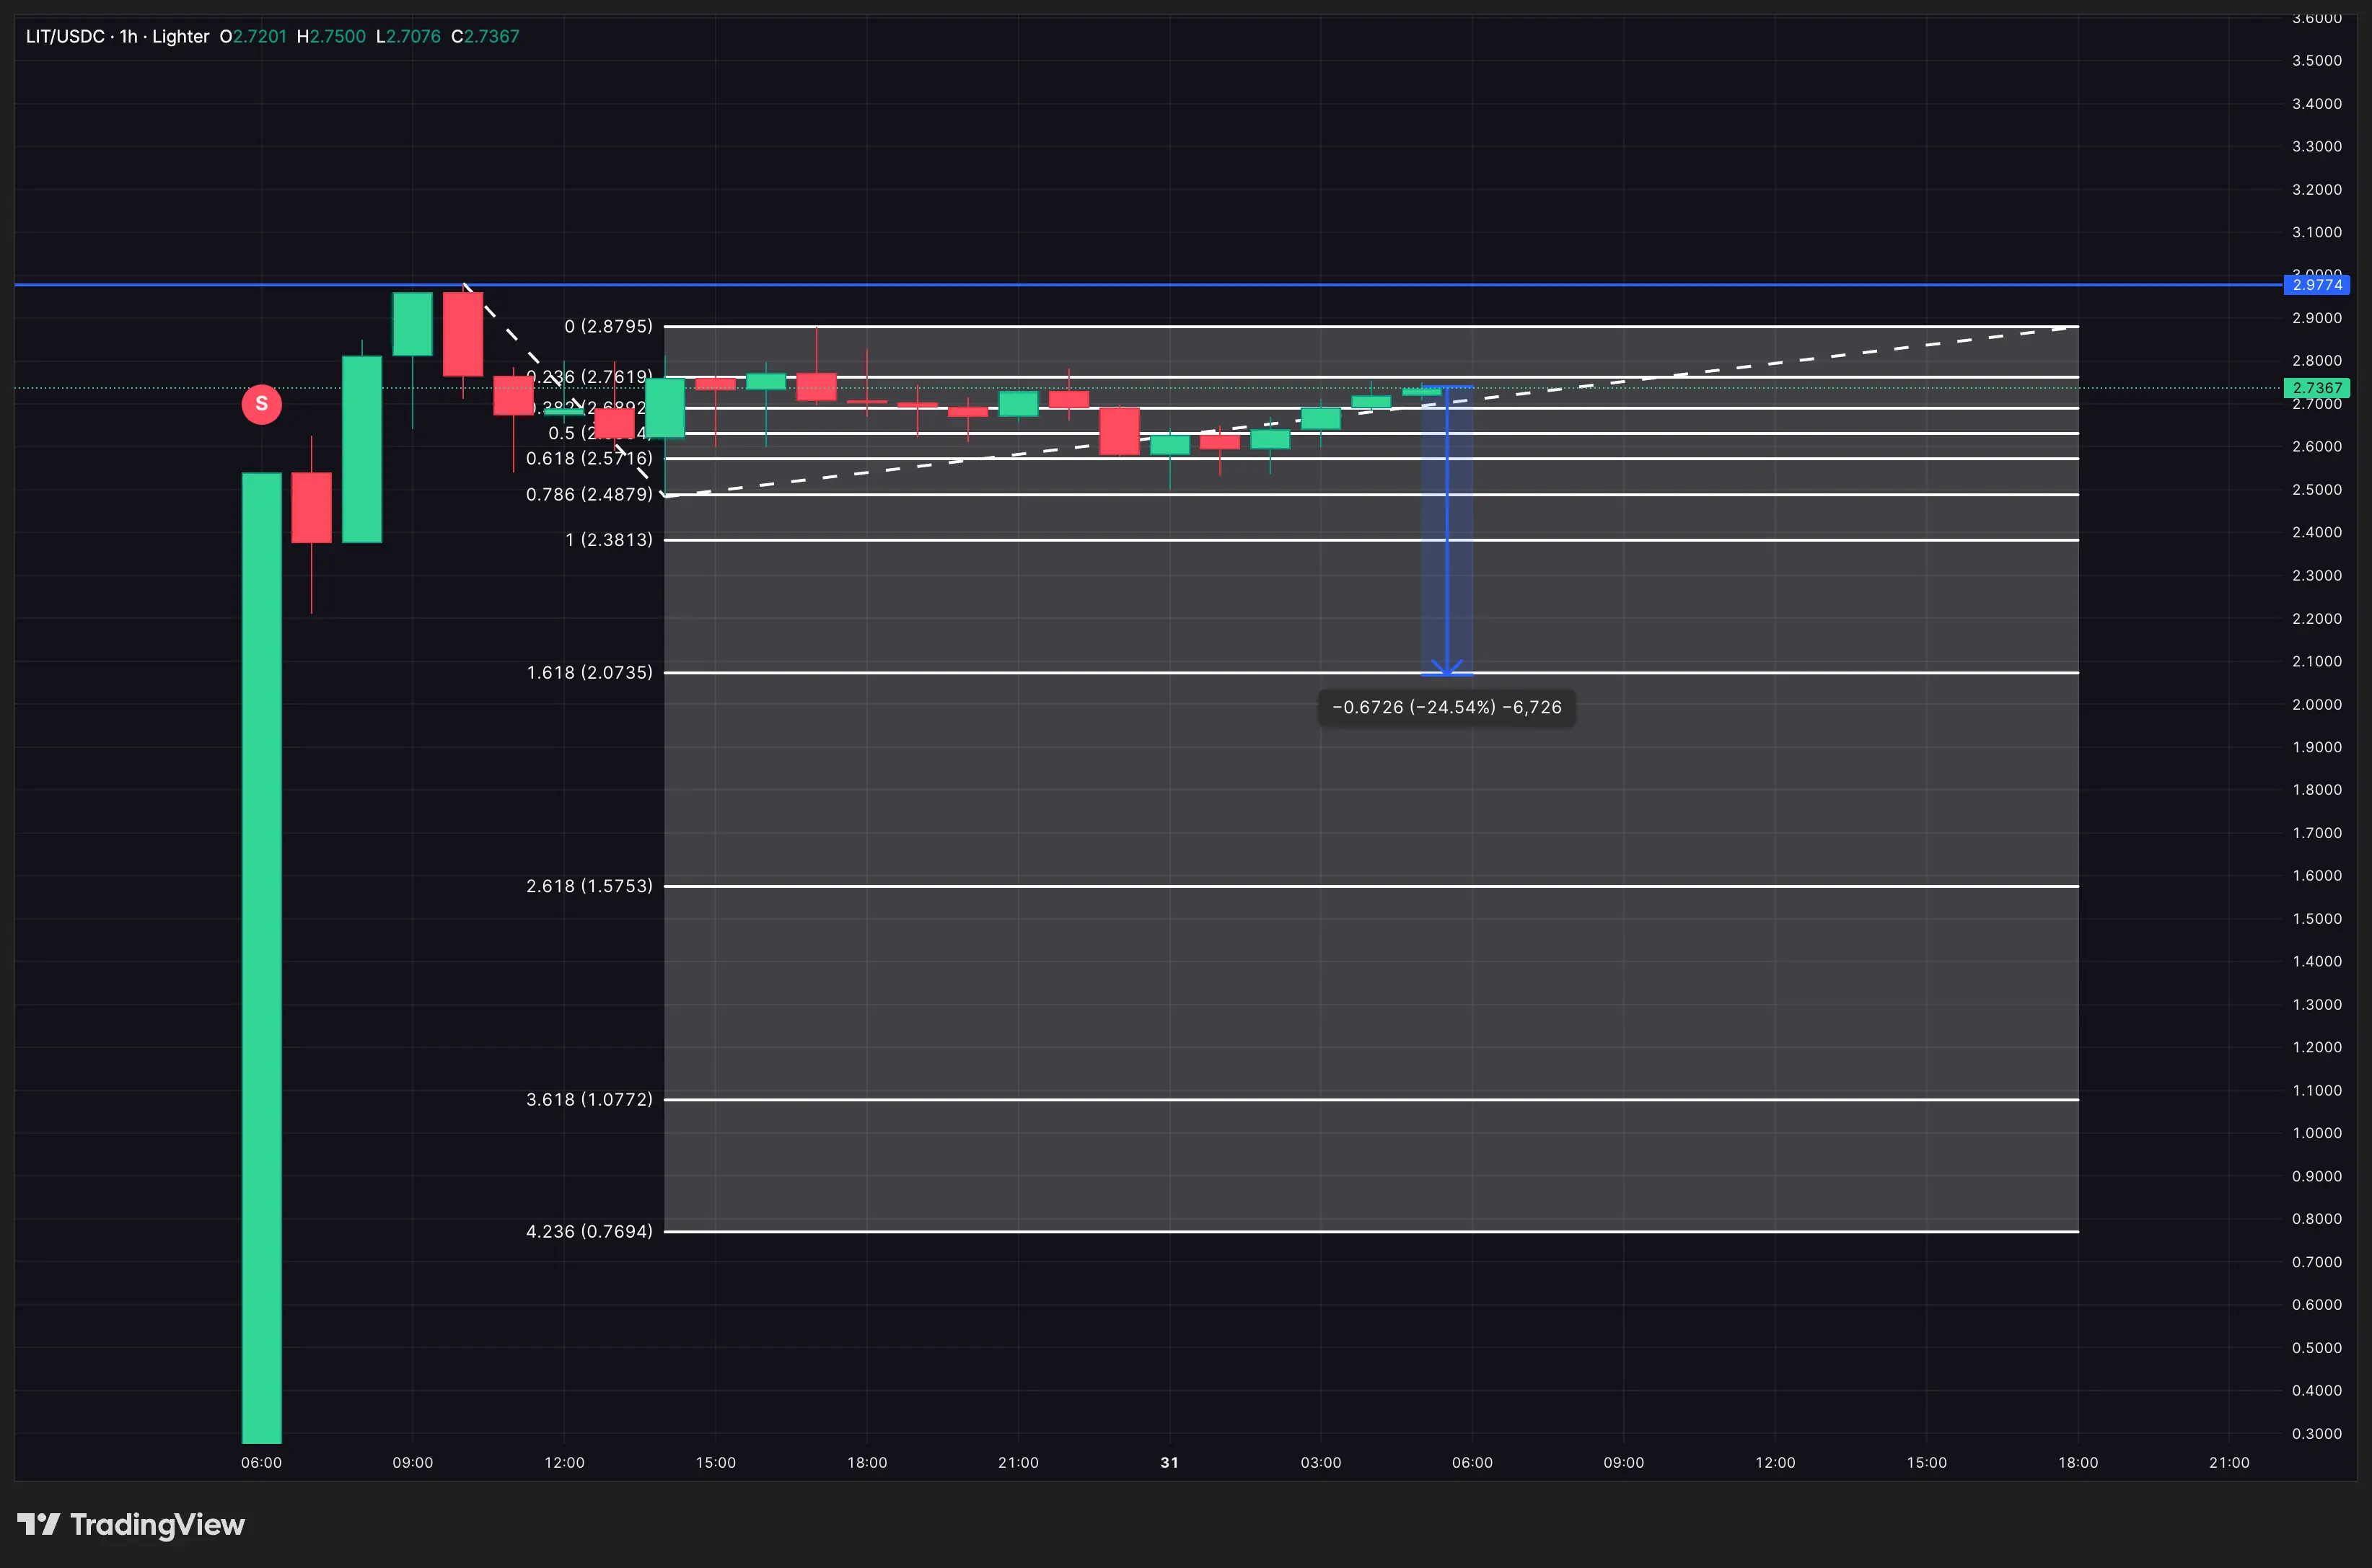 Lighter price analysis | Source: Lighter.XYZCurrently, buying pressure has appeared but is not yet dominant. The bullish scenario still relies on support indicators rather than a clear breakout structure.
Disclaimer: The information on this page may come from third parties and does not represent the views or opinions of Gate. The content displayed on this page is for reference only and does not constitute any financial, investment, or legal advice. Gate does not guarantee the accuracy or completeness of the information and shall not be liable for any losses arising from the use of this information. Virtual asset investments carry high risks and are subject to significant price volatility. You may lose all of your invested principal. Please fully understand the relevant risks and make prudent decisions based on your own financial situation and risk tolerance. For details, please refer to
Disclaimer.
Related Articles
Crypto Market Sees Continuous Downturn As Geopolitical Tensions Grow
The global crypto market is down 1.60% to $2.38T amidst escalating U.S.-Iran tensions, with Bitcoin and Ethereum experiencing declines. Notably, some smaller cryptocurrencies have surged. DeFi and NFT sectors show mixed trends, while regulatory developments emerge.
BlockChainReporter1h ago
Where Could Kaspa (KAS) Price Go This Week?
Kaspa (KAS) is showing serious resilience even as its price remains near lows. Kaspa’s hash rate is holding near all-time highs, showing miners aren’t stepping back and the network’s backbone is rock solid.
A major hardfork is coming on May 5, bringing native tokens and more programmability.
CaptainAltcoin1h ago
19.81% Surge for DUSK: What It Means for Traders
DUSK's price surged 19.81% to $0.09667 amid increased market activity and a broader altcoin shift. Analysts highlight its rising relevance and key resistance at $0.10, suggesting significant future trading interest.
Coinfomania1h ago
Bitcoin Briefly Falls Below $70,000 Mark During Asian Session as Fed Hawkishness and Macro Uncertainty Weigh on Market Volatility
Bitcoin dipped below $70,000 on March 19th, touching a low of approximately $69,537, reflecting the market's reassessment of the Federal Reserve's interest rate decision and inflation outlook. Although it later rebounded to around $70,180, the $70,000 level remains a key support in the near term. With weakening market sentiment, coupled with energy prices and macro risks, capital is turning more conservative, and Bitcoin may consolidate around the $70,000 level going forward.
区块客3h ago
XRP Enjoying 'Strong Retail Demand,' Report Says - U.Today
The essay explores the contrasting dynamics between retail and institutional demand in the cryptocurrency market. It highlights XRP's strong retail base and growing adoption, while institutional interest remains cautious, especially compared to assets like Bitcoin and Ethereum, amid recent ETF flows.
UToday3h ago
Fractal model predicts Bitcoin will hit bottom in October 2026
Bitcoin shows positive recovery signals, improving market sentiment after a long phase of volatility. However, experts believe the current uptrend is short-term, with deeper correction risks ahead. According to Crypto Rover's fractal model, Bitcoin's price follows a four-year cycle influenced by halving events. The current cycle likely peaked in late 2025, with further declines expected before a potential bottom around 2026. Short-term price fluctuations can mislead investors, emphasizing the importance of understanding these cycles for long-term trends.
TapChiBitcoin3h ago
